Dot (polkadot) No. 1 on development this year .
One on crypto that have a large market cap , with great value and staking rewards
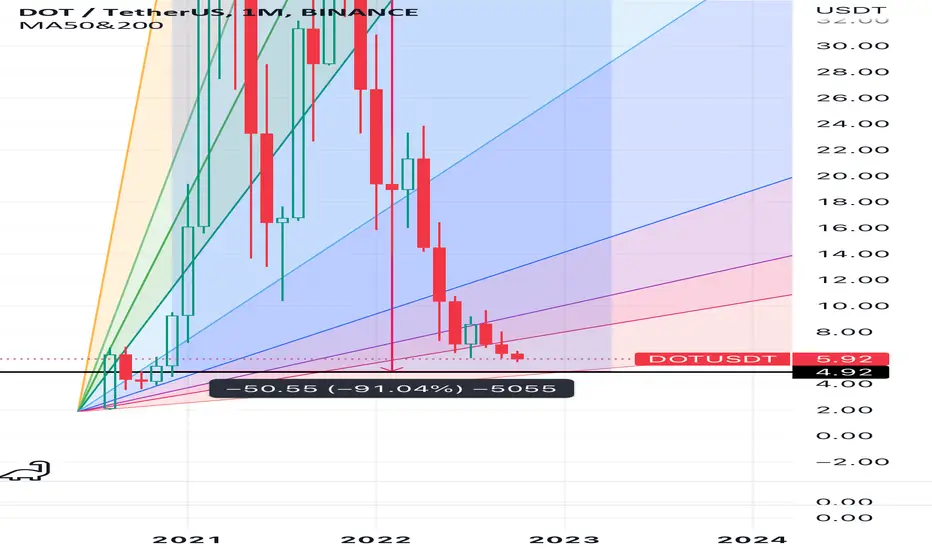
Same of BTC CHART , but it is an alt so dont expect to be better .
At 5 $ it can be a good price to me .
GOOD LUCK
Polkadot
PBR is time to sell not buy I believe no one with at least minimum use of reason would buy near to highs is like buy in the ATH no one should do that

Polkadot/ Dot symmetrical triangle On Dot has there been a symmetrical pattern formed which shows a 50/50 of the price breaking to the upside of the downside. This said does the price trend show that the price is more likely to break to the downside as the market trend is bearish .
Entry price: In the apex at 10.00.
Stop loss: At 10.50, which is inside the triangle so when the triangle breaks to the downside but after the break to the downside starts trending upwards and is stopped by the stop loss.
Target price: Is extrapolated from the triangle height/the upper trend line and this target price set at 4.48.
This is also 55% gain if the prediction is successful.

Polkadot (DOT) – insane long today!Hello, everyone!
Let’s continue analyze altcoins which have the potential to reverse before the whole cryptomarket. Yesterday I told you that ADA is about to finish the bear market, today I found the DOT which have almost the same or even stronger bullish bias!
Let’s take a look at the 1W timeframe DOTUSDT chart. On the weekly chart the signals are very strong but can be realized several months. I suppose that this asset is now next to the perfect entry mid and long term point. First of all I want you to bring your attention to the clear Elliott wave structure. The whole bear market globally consists of the waves ABC. Waves A and B have the zigzag abc structure and the wave C has the 12345 waves structure. Looking at the very strong divergence I can conclude that the wave 5 is about to finish. What does it mean? It means that downtrend on this coin is about t end. Now it’s the best time to start accumulating the long/mid term holdings in crypto.
Classical TA also showing us the nice buy opportunity. 1W demand zone is the extremely strong support. It is not just the abstract line which have to stop the dump with no reason – this is what the large players on the market monitor to have the best entry point. Moreover, look at the decreasing volume during the bear market. It means that the bears became weaker an weaker every week and very soon they will not be able to maintain the new lower lows setting. I have already bought DOT without the confirmation because it is the fundamentally strong asset which is not going to be scammed with the high probability.
Best regards, Ivan

📊🔥3 tagets for DOT: this trap force the alts to PUMP!Hi friends! I hope you follow my yesterday recommendation att least for scalping! Another swing trades you can open when the BTC show it's power.
✅ My recent plan for BItcoin in this video!
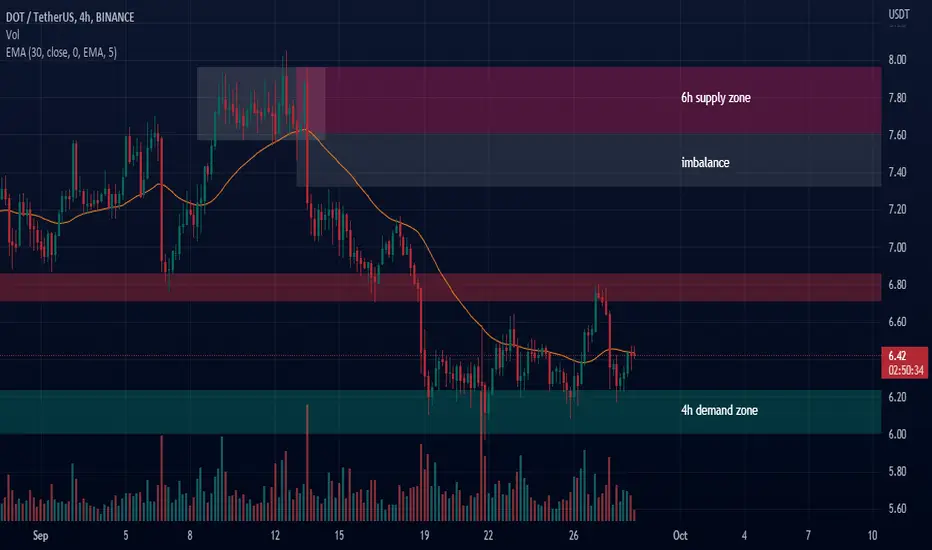
Now the price of DOT consolidating in the FALLING WEDGE and start to squeeze to the upper boundary. It's a nice signal for the bulls. I hope the value area of $6.20-6.50 will become the support for the price in the closest future.
📊 The preconditions to open a long:
✅ false breakout +volume indicator confirmation (volume bars growth)
🔥 pullback to $5.9-6
🔥 squeeze to the trendline
🔥 bullish BTC
✅ The volume indicator help you to understand where is the bottom or high. The biggest volume are always there. If you want to make more succesfull trades, use the DOM and Footprint tools for scalping. It helps to open a short and long with the whales (big players). As far as you understand, the whales are the most profitable traders at the market.
🚩 The targets are the 3 key levels of $7, $8, $9.65.
🔥Traders, set your sl at the breakeven when the price reach the 1st target. My recommendation is to book at least 50-60% of profit when the price reach the second target.
💻Friends, press the "boost"🚀 button, write comments and share with your friends - it will be the best THANK YOU.
P.S. Personally, I open an entry if the price shows it according to my strategy.
Always do your analysis before making a trade

Polkadot (DOT) - October 12Hello?
Welcome, traders.
By "following", you can always get new information quickly.
Please also click "Boost".
Have a good day.
-------------------------------------
(DOTUSDT 1W Chart)
Whether or not it can rise above 7.16 to receive support is the key.
(1D chart)
We need to see if it can rise above 6.28.
Otherwise, it is expected to move towards the 5.11 area.
However, since the volume profile section is formed over the section 5.67-6.60, there is a possibility that the trend will continue in the direction deviating from this section.
To turn into an uptrend, it must rise above 6.60.
------------------------------------------------------------ -------------------------------------------
** All descriptions are for reference only and do not guarantee a profit or loss in investment.
** If you share this chart, you can use the indicators normally.
** The MRHAB-T indicator contains indicators that indicate support and resistance points.
** SR_R_C indicators are displayed as StochRSI(line), RSI(columns), CCI(bgcolor).
** CCI indicator is expressed as overbought range (CCI > +100) and oversold range (CCI < -100).
(Short-term Stop Loss can be said to be a point where profit and loss can be preserved or additional entry can be made through split trading. It is a short-term investment perspective.)
---------------------------------

#Polkadot down 88% in 11 Months, is the DOT Bear Run Over?Past Performance of Polkadot
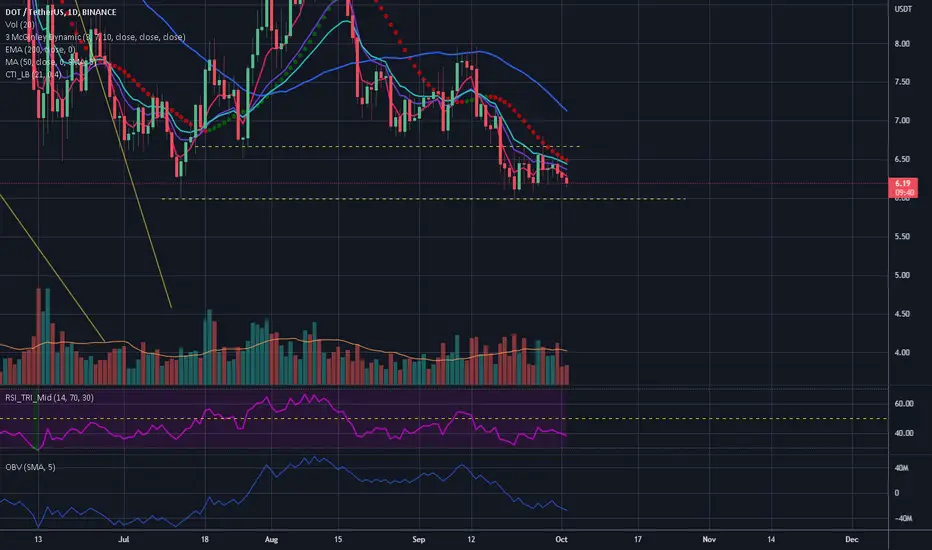
Polkadot, like most coins, is inside a trading range, and buyers are yet to unshackle themselves from determined sellers. From the daily chart, DOT is up a paltry six percent from September 2022 lows. However, from the daily chart, there are flashes of strength, signaling growing upside momentum.
#Polkadot Technical Analysis
DOT is within a bear formation but bottoming up from 2022 lows. Even though the coin is shaped by the losses of September 18, the rejection of lower prices in the first week of October may be the basis for more expansion in October. Whether DOT's impressive performance thus far can continue depends on whether there is a high volume close above the middle BB and $7, the upper limit of the current consolidation. In that case, DOT may easily soar to $8 and later $9.5, marking August 2022 highs.
What to Expect from #DOT?
DOT is at around 2022 lows and down 88 percent from 2021 highs. After months of lower lows, the bear run may be near. However, this depends if DOT can close above $7 with increasing trading volumes. If not, further losses below $6 may quickly lead to panic sales to new 2022 lows.
Resistance level to watch out for: $7
Support level to watch out for: $6
Disclaimer: Opinions expressed are not investment advice. Do your research.

$DOT | In A Channel: Rinse & RepeatDOTUSD while not at extreme levels on RSI, is still touching upper Bollinger Bands in a tight channel signaling LESS volatility. Which means, it should follow a consistent path of UP & DOWN trend. Couple this with the fact of the previous candle rejected at resistant, I predict this price to come back down to below the 20 MA right before the short term support line.
Rinse and repeat type of trade here.

DOT on weekly TF is ready to move as Rocket!at the end of 2020 we had the same consolidation moves with 16 weekly candles, then price broke out with a master candle in 17 weekly candle.
now price is in 16th week of consolidation, so if history repeat this move, we can expect a new rally at next week.

DOT fractal 2020#DOT/USDT
$DOT #fractal
at the end of 2020 we had the same consolidation moves with 16 weekly candles, then price broke out with a master candle in 17 weekly candle.
🐮 now price is in 16th week of consolidation, so if history repeat this move, we can expect a new rally at next week.

Dot ( #polkadot ) usdt ready for buy ?I think there are many buy orders in the $4 range waiting for Dot
Your own risk
This chart will be updated
If you want me to analyze a particular coin for you, tell me in the comments
Don't forget to like and comment

DOT.Usdt (Y22.P4.Video1).short term trading apportunitiesWe look at the overall situation for DOT now and how it fits into the bigger picture from a Elliot wave count and formation perspective. We also apply our fibonacci levels.
For more confluence, add your MA and use the indicators of your choice.
All the best,
S.SAri

Polkadot (DOT) - October 5Hello?
Welcome, traders.
By "following", you can always get new information quickly.
Please also click "Boost".
Have a good day.
-------------------------------------
(DOTUSDT 1W Chart)
Whether or not it can move higher than 7.16 is the key.
(1D chart)
1st resistance: 7.16-7.74
2nd resistance: 9.26-10.13
A volume profile section is being formed around 6.28.
So, the key is whether we can find support and move up around 6.28.
If it fails to move higher, it is expected to move towards the 5.11 area.
------------------------------------------------------------ -------------------------------------------
** All descriptions are for reference only and do not guarantee a profit or loss in investment.
** If you share this chart, you can use the indicators normally.
** The MRHAB-T indicator contains indicators that indicate support and resistance points.
** SR_R_C indicators are displayed as StochRSI(line), RSI(columns), CCI(bgcolor).
** CCI indicator is expressed as overbought range (CCI > +100) and oversold range (CCI < -100).
(Short-term Stop Loss can be said to be a point where profit and loss can be preserved or additional entry can be made through split trading. It is a short-term investment perspective.)
---------------------------------


🚀🔥Long on DOT: same situation as with XRP before 40% PUMP!Hi friends! Just take a look on the chart and volume indicator. Do you see how many times the whales buy the bottom of DOT? I think they do it to make money unlike the retail traders who buy at the top and sell in loss).
The spike of the volume is always at the bottom, as you can see on the indicator. This means that the big players might already accumulate enough DOTs. The same situation were to XRP before the PUMP:
1. a lot of buyers at the bottom
2. lost interest to the coin from retail investors/trader
📊 I see this preconditions to open a long:
🔥squeeze to the upper trendline
You can try to open a local trade on the wedge breakout if you are the intaday trader.
🔥 bulls BUY limit order wall which is support the price and doesn't let it to fall
🔥 bullish BTC pull the altcoins to the top.
🚩 I use DOM and Footprint dcalping tools for the purpose of identifing the big players. Big players are the reachest on the market and as you know they choose the right size in the most cases. I prefer to follow the whales.
✅ The targets for the long:
1. $7-7.33 - the closest value area and resistance
2. $8.05 - the key level
4. $9-10 is importan psychological value area for traders. A lot of them will book the profit here
🔥 I also recommend you to book profit at least 25% when the price reach the targets.
💻Friends, press the "boost"🚀 button, write comments and share with your friends - it will be the best THANK YOU.
P.S. Personally, I open an entry if the price shows it according to my strategy.
Always do your analysis before making a trade

Maybe is late to short but if you wanna try....Yesterday I posted a short signal on ETH but today I noticed that DOT is in the exact same situation even thought maybe is too late to enter this one.
Notice the last two days session VLPR with POC at the same level (I'm trying to implement this VLPR in my TA):
The first and very close support is 5.98USDT but I've an alert set at 5.17 where I think I might buy some to hold if the market will look bottomed for when/if we go there.
DOT inside ascending channel#DOT/USDT
$DOT is trading inside ascending channel, and now price is near and above lower line of this zone.
🐻 holding the descending resistance and break down from lower line of channel will shape a bearish flag pattern that will drop price to somewhere around $0.57
🐮 but holding the lower line and break out from descending resistance can increase price toward upper line of ascending channel.

DAY 12: #DOTUSDT (#SHORT) (30M TF)#DOTUSDT (#SHORT)
2% of the deposit
Margin: isolated
⚖️Leverage: x10-20
🗝Entry point: 6.485-6.500
🎯target 1 - 6.407
🎯target 2 - 6.326
🎯target 3 - 6.238
🎯target 4 - 6.156
🎯target 5 - 6.078
❌ stop loss: 6.602
(PENDING ORDERS - 6.550 and 6.576 2%)

Where to sell (short term)strong volume profile and 0.5 Fib. We might have a slight pull back during 0.618 Fib but I expect the big selling pressure would be around 6.966
======
This technical analysis by no means, is a financial advice and this only works for me and I personally think post the best analysis I can, Please do you own research.

Polkadot (DOT) - September 25Hello?
Welcome, traders.
By "following", you can always get new information quickly.
Please also click "Like".
Have a good day.
-------------------------------------
(DOTUSDT 1W Chart)
The key is whether you can climb to the 11.72-14.93 section.
To do that, we need to see if it can rise above 7.16.
(1D chart)
If it fails to rise above the downtrend line (1), it is expected to decline towards the 4.16-5.11 section.
The 11.72-14.93 section is a trend-determining section and is a strong support and resistance section.
Therefore, as we get closer to the 11.72-14.93 range, psychologically, if we don't buy now, we will continue to feel like we are about to surge.
Therefore, you should buy after confirming that it is supported by rising to the 11.72-14.93 section.
Otherwise, you will most likely make the mistake of buying at the high.
The final section where you can buy is possible when you see support in the 7.16-7.74 section.
If you buy in this range, in the short term, you can take profit when you find resistance in the 9.26-10.13 range.
------------------------------------------------------------ -------------------------------------------
** All descriptions are for reference only and do not guarantee a profit or loss in investment.
** If you share this chart, you can use the indicators normally.
** The MRHAB-T indicator contains indicators that indicate support and resistance points.
** Background color of Long/Short-S indicator: RSI oversold and overbought sections
** Background color of CCI-C indicator: When the short-term CCI line is below -100 and above +100, oversold and overbought sections are displayed.
** The OBV indicator was re-created by applying a formula to the DepthHouse Trading indicator, an indicator disclosed by oh92. (Thanks for this.)
(Short-term Stop Loss can be said to be a point where profit and loss can be preserved or additional entry can be made through split trading. It is a short-term investment perspective.)
---------------------------------

Polkadot longPolkadot broke trough off the upper boundary of descending channel. Bullish movement to resistance level at 7.6 is expected to happen.

Kusama AccumulateWhat Is Kusama (KSM)?
- Self-described as "Polkadot's wild cousin," Kusama is an experimental blockchain platform that is designed to provide a massively interoperable and scalable framework for developers. Kusama has almost the same codebase as Polkadot — one of the most successful interoperable blockchains.
- By deploying on Kusama, fast-paced projects gain access to a highly scalable, interoperable sharded network, with features that are not yet available on Polkadot. To that end, Kusama describes itself as a “canary network.”
- This is a long term trade, as we remain in bearmarket for now, KSM could enter a long consolidation corridor.
- KSM can be staked in Kraken for 18% (and more exchanges) or Onchain via Polkadot.JS
- Total Supply for Kusama is Total 9,651,217 so his price is far under valuated.
- When you see BB is thinner and thinner a potential move is about to start.
- Remember that all altcoins follow TheKing so if BTC don't move, they won't move.
- i will post my older KMS Chart in comments.
-------------------------------------------------
Trading Parts
-------------------------------------------------
Buy : 40$ ish ( Now )
Rebuy : 25$ ( Max Buy if we have a BTC wick )
-------------------------------------------------
Tp1 : 999$
Tp2 : 1499$
-------------------------------------------------
Happy Tr4Ding !
