Polkadot (DOT) - April 19hello?
Traders, welcome.
By "following", you can always get new information quickly.
Please also click "Like".
Have a nice day.
-------------------------------------
(DOTUSDT 1W Chart)
Resistance: around 19.37
1st support: around 13.64
2nd support: around 9.26
If it rises above 19.37, it is expected to create a new wave.
(1D chart)
(buy)
- After confirming the support in the section 17.69-19.37
- If possible, it's good to see support in 19.37.
(Stop Loss)
- When it falls below 16.16
(Sell)
- When receiving resistance near 25.07
- When resistance is received in the section 33.80-36.76
Several indicators are set in the section 17.69-19.37.
As such, I think it is a section that will play the role of support and resistance well.
Therefore, it is important to find support or resistance in the 17.69-19.37 section.
If it rises above 36.76, we expect a full-fledged uptrend to continue.
------------------------------------------------------------ -----------------------------------------------------
** All indicators are lagging indicators.
Therefore, it is important to be aware that the indicator will move accordingly as price and volume move.
However, for the sake of convenience, we are talking in reverse for the interpretation of the indicator.
** The MRHAB-T indicator used in the chart is an indicator of our channel that has not been released yet.
** The OBV indicator was re-created by applying a formula to the DepthHouse Trading indicator, an indicator disclosed by oh92. (Thanks for this.)
** Support or resistance is based on the closing price of the 1D chart.
** All descriptions are for reference only and do not guarantee a profit or loss in investment.
(Short-term Stop Loss can be said to be a point where profit and loss can be preserved or additional entry can be made through split trading. It is a short-term investment perspective.)
---------------------------------
Polkadot

POLKADOT - Buy Zone Approaching - UPDATE 🚀Following on from our last post on Polkadot, we are now running gains of over 25% from our sell zone.
We are still in wave C, which is a 5 wave formation. In our last post we identified the completion zone for subwave 4 of Wave C and now we are seeing the 5th and final subwave of wave C. We are looking for Polkadot to move lower to around the 10-11 level where we will be looking for bullish reversal signs.
There's a potential 400% that can be made from the next bull run just on Polkadot alone, which is why we're constantly updating this clean setup!
Trade Idea:
- Hold shorts at breakeven until we reach 14.50 for first targets and 11 for second targets
- Watch for bullish price action on lower timeframe
We will update Polkadot once we reach our buy zone so we can all get in on the next bullrun 💪🏼
Goodluck and as always, trade safe!
See below for our previous Polkadot analysis:

Polkadot (DOT) Buy ZonePolkadot (DOT) Buy Zone
--------------------
BIAS
Mid-Term : Bullish
Risk : Medium
Polkadot once again on our $17 zone mid-term support and see a drastic short-erm increase in market sentiment and buying intentions.
--------------------
$DOT/USDT LONG SETUP
Leverage : x3 - x5
Entry Price : 17.4 - 17
TP 1 : 17.65
TP 2 : 18.15
TP 3 : 18.6
TP 4 : 19
TP 5 : 19.35
TP 6 : 19.75
TP 7 : 20.2
TP 8 : 20.55
Stop Loss : 16.5
*Maximum 3% of Portfolio.
*Unload 12.5% at each TP. Whenever TP 2 hits, Move stop loss to entry.
--------------------

Long on DOT$DOT is bouncing off the support level. Bullish movement to resistance level at 18,59$ is likely to happen.

POLKADOTDOT/USDT Polkadot creating a nice flat top triangle, and a nice RSI at the moment that shows you how undervalue the price is.

Bearish Flag on DOTUSDTBased on technical factors (bearish Flag - RSI ) there is a short position in :
📊 DOTUSDT Polkadot
🔴 Short by confirmed Breakout ( RSI or Flag )
🧯 Stop loss 19.50
🏹 Target 1 17.01
🏹 Target 2 16.01
🏹 Target 3 14.50
💸Capital : 1%
We hope it is profitable for you ❤️
Please support our activity with your likes👍 and comments📝

Polkadot DOT Price Targets and Stop LossDOT/USDT
Entry Range: $18.40 - 20.40
Price Target 1: $23.50
Price Target 2: $27.30
Price Target 3: $30.80
Stop Loss: $15.20

DOTUSDT, Its going exactly to the analysisHello everyone
If you checked our last analysis of DOT the we published, the price exactly moving toward to the analysis and we exactly be ready to take position and buy in the main zone that we shown on chart.
Everything is programming and happening that we expect
Good Luck
Abtin
Previous analysis :
Good Luck
Abtin

Daily Polkadot Broken Trendline!!Very easy chart as you can see just buy some Dot or KSM and hold and profit, TPs are there as dotted lines as you can see.

DOT strong supportDOT Polkadot has found a strong support at 17.50 from which we might see a reversal to the next resistance, 27usd.
Looking forward to read your opinion about it.

Polkadot Bullish BiasIMO its looking good for polkadot.
Its showing similar structure as some other
cryptocurrencies. If we break fib level 0.618
I expect more to come for the whole market
maybe some cashflow moving from stockmarket
to crypto who knows :)
-No FA
-Always do your own research
-Feel free to share,like and suscribe

Polkadot looking interestingPolkadot (DOT) has been quiet for a while vs BTC--but that's often when the best opportunities present themselves. Negative momentum appears to be slowing and I'm seeing Bullish Divergence on the Daily chart. Having said that, I'm still expecting a retest of the Trend Support and that's where I would look to start averaging into a long position. If Support breaks, I'll be looking at 3500 sats for another buy opportunity.
Happy Trading.
----------------------------------------------------------------
These are my personal views and not financial advice. Please do your own research before investing.
I'd love to hear your thoughts, ideas and feedback. Feel free to Comment and I'll try and get back to you quickly.
If you appreciated this analysis, consider Liking or Following . Thanks!

DOT is Forming Head and Shoulders DOT is forming Head and shoulders pattern if we could see price would reverse toward upside so we could say it will have valid.
For now , with today price action , DOT locally looking bullish such as more Alts so i think it can bullish move to $21 ~ $22 area if the BTC will stay Natural/Bullish
Happy trading 🔥🔥🔥🌷


DOT (Polkadot) Coin {Market Cap} Analysis 10/04/2022Fundamental Analysis:
Polkadot is an open-source sharded multichain protocol that connects and secures a network of specialized blockchains, facilitating cross-chain transfer of any data or asset types, not just tokens, thereby allowing blockchains to be interoperable with each other. Polkadot was designed to provide a foundation for a decentralized internet of blockchains, also known as Web3.
Polkadot is known as a layer-0 metaprotocol because it underlies and describes a format for a network of layer 1 blockchains known as parachains (parallel chains). As a metaprotocol, Polkadot is also capable of autonomously and forklessly updating its own codebase via on-chain governance according to the will of its token holder community.
Polkadot provides a foundation to support a decentralized web, controlled by its users, and to simplify the creation of new applications, institutions and services.
The Polkadot protocol can connect public and private chains, permissionless networks, oracles and future technologies, allowing these independent blockchains to trustlessly share information and transactions through the Polkadot Relay Chain.
Polkadot’s native DOT token serves three clear purposes:
staking for operations and security,
facilitating network governance,
bonding tokens to connect parachains .
Polkadot has four core components:
Relay Chain: Polkadot’s “heart,” helping to create consensus, interoperability and shared security across the network of different chains;
Parachains: independent chains that can have their own tokens and be optimized for specific use cases;
Parathreads: similar to parachains but with flexible connectivity based on an economical pay-as-you-go model;
Bridges: allow parachains and parathreads to connect and communicate with external blockchains like Ethereum.
Following the network’s redenomination after a referendum on Polkadot, DOT balances increased by 100, so one old DOT was equivalent to 100 new DOT. This meant that the initial maximum supply of 10 million old DOT in August 2020 became 1 billion new DOT tokens. The redenomination was undertaken purely to avoid the use of small decimals and make calculation easier. While all balances were increased by a factor of one hundred, this did not impact the distribution of DOT or holders’ proportional share.
Polkadot’s first initial coin offering (ICO) was held in October 2017, and the Polkadot price was $0.29, with 2.24 million tokens offered. The second ICO was held in July 2020, and the Polkadot price offered was $1.25, and 342,080 DOT tokens were sold.
The current CoinMarketCap ranking is #12, with a live market cap of $19,263,288,614 USD. It has a circulating supply of 987,579,315 DOT coins and the max. supply is not available.
Technical Analysis:
Looking at the Market Value and Fluctuation Patterns in historical data of the Asset from Jan 2021, we can see there has been a completed Cycle with ATH: 47B$ , thus retracement to 10B$, followed by 3 Months of Re-Acumulation Phase till End July 2021, which developed the New Cycle with its New ATH of Approx. 55B$, followed by Market Cap Correction to 14B$ which is Below the 61.8% level of Fibonacci retracement of 0 to the Latest ATH (55B$). this means the Capital has Been accumulatiing since its retracement for its 3th cycle which can have the new ATH of 160B$.
There exist the Hidden Bullish Divergence of Market Cap Value and MACD at the 4 Hours Time Frame , which is the very Significant sign of Bullish Trend Continuation which eventually Start the new Bullish cycles.
As the Capital Accumulation Start its Bullish trend From these kind of Discounted Zones such as Fib 61.8 or lower , we can Rationally expect the ATH to be easily Achievable and ultimately developing the new cycle thus new ATH.
There are Total of 3 Targets defined by the Average Confluences of the Fibonacci Expansion and Fibonacci Trend Base Extension. these confluences Points can even be counted as the Major Pivot Points .
The 3 TP gets its confirmation as the Bullish trend Triggers the 2 TP followed by some Market Cap correction and Reaccumulating. on its Up Formation rally.

DOT Analysis 09/03/2021we have achieved our Past Specified Targets and now Updating the Idea and Taking New Positions
as you can see the price has done its accumulation phases in 2 zones and triggered our past TPs with a sharp Impulsive wave and consolidating above our 3 TP,
it will started its Rally after some consolidation as we can see there exist a Hidden Bullish Divergence with MACD Histogram, which is the sign of trend continuation.
there total of 3 New Targets specified where as the 3TP will gets its confirmation if the Price Triggers and Correct the 2 TP which is the extension zone of Fibonacci Projection of the Previews impulsive wave.

DOT (Polkadot) Coin Analysis 10/04/2022Fundamental Analysis:
Polkadot is an open-source sharded multichain protocol that connects and secures a network of specialized blockchains, facilitating cross-chain transfer of any data or asset types, not just tokens, thereby allowing blockchains to be interoperable with each other. Polkadot was designed to provide a foundation for a decentralized internet of blockchains, also known as Web3.
Polkadot is known as a layer-0 metaprotocol because it underlies and describes a format for a network of layer 1 blockchains known as parachains (parallel chains). As a metaprotocol, Polkadot is also capable of autonomously and forklessly updating its own codebase via on-chain governance according to the will of its token holder community.
Polkadot provides a foundation to support a decentralized web, controlled by its users, and to simplify the creation of new applications, institutions and services.
The Polkadot protocol can connect public and private chains, permission-less networks, oracles and future technologies, allowing these independent blockchains to trustlessly share information and transactions through the Polkadot Relay Chain.
Polkadot’s native DOT token serves three clear purposes:
staking for operations and security,
facilitating network governance,
bonding tokens to connect parachains.
Polkadot has four core components:
1. Relay Chain: Polkadot’s “heart,” helping to create consensus, interoperability and shared security across the network of different chains;
2. Parachains: independent chains that can have their own tokens and be optimized for specific use cases;
3. Parathreads: similar to parachains but with flexible connectivity based on an economical pay-as-you-go model;
4. Bridges: allow parachains and parathreads to connect and communicate with external blockchains like Ethereum.
Polkadot is a sharded multichain network, meaning it can process many transactions on several chains in parallel (“parachains”). This parallel processing power improves scalability.
Custom blockchains are quick and easy to develop using the Substrate framework and Substrate blockchains are designed to be easy to connect to Polkadot's network. The network is also highly flexible and adaptive, allowing the sharing of information and functionality between participants. Polkadot can be automatically upgraded without the need for a fork in order to implement new features or remove bugs.
The network has a highly sophisticated user-driven governance system where all token holders have a vote in how the network is run. Teams can customize their own blockchain’s governance on Polkadot based on their needs and evolving conditions. Nominators, validators, and collators all fulfil various duties to help secure and maintain the network and eradicate bad behavior.
At the end of 2021, Polkadot successfully concluded its first Parachain auctions. The Parachain auctions followed an un-permissioned candle auction system. The winning bid is the highest bid at the random moment the auction ends.
Polkadot assigned the first five slots to the following auction winners: Acala, Moonbeam, Astar, Parallel and Clover. These projects will have their parachain slots locked in for 96 weeks, guaranteed by the DOT bidders committed as collateral. As customary on Polkadot, all projects had previously been battle-tested on its de-facto testnet Kusama.
The network uses an NPoS (nominated proof-of-stake) mechanism with validators and nominators. Nominators back validators with their tokens. These staked tokens maximize chain security by making it prohibitively expensive to misbehave.
Validators are staked on the Relay Chain and confirm transactions coming from the different parachains. This unique validity scheme enables chains to interact with each other securely under the same rules, yet remain independently governed.
Polkadot is the flagship protocol of Web3 Foundation, a Swiss Foundation with a mission to facilitate an open-source, fully functional and user-friendly decentralized web.
Polkadot’s founders are Dr. Gavin Wood, Robert Habermeier and Peter Czaban.
Wood, Web3 Foundation’s president, is the most well-known of the trio thanks to his industry influence as Ethereum co-founder, Parity Technologies founder and the creator of the smart contract coding language Solidity. Wood is also credited with coining the term Web3.
Habermeier is a Thiel Fellow and accomplished blockchain and cryptography researcher and developer. Czaban is the former Technology Director at Web3 Foundation, with a wealth of experience across highly specialized fintech industries.
Following the network’s redenomination after a referendum on Polkadot, DOT balances increased by 100, so one old DOT was equivalent to 100 new DOT. This meant that the initial maximum supply of 10 million old DOT in August 2020 became 1 billion new DOT tokens. The redenomination was undertaken purely to avoid the use of small decimals and make calculation easier. While all balances were increased by a factor of one hundred, this did not impact the distribution of DOT or holders’ proportional share.
Polkadot’s first initial coin offering (ICO) was held in October 2017, and the Polkadot price was $0.29, with 2.24 million tokens offered. The second ICO was held in July 2020, and the Polkadot price offered was $1.25, and 342,080 DOT tokens were sold.
The current CoinMarketCap ranking is #12, with a live market cap of $19,263,288,614 USD. It has a circulating supply of 987,579,315 DOT coins and the max. supply is not available.
DOT Market Capitalization Analysis:
Technical Analysis:
There exist Bullish Divergence of Price Value and MACD on 4 Hours Time Frame, which is the sign of bearish trend reversal and start of the new Bullish trend which may lead to the new Economical Cycle.
The bullish Trend has already Started and we can notice the Strength.
There are Total of 3 Targets defined by the Average Confluences of the Fibonacci Expansion and Fibonacci Trend Base Extension. these confluences Points can even be counted as the Major Pivot Points.
The 3 TP gets its confirmation as the Bullish trend Triggers the 2 TP followed by some Price correction and Reaccumulation. on its Up Formation rally.
Currently the Price Value is below 61.8% Fibonacci Retracement level from its ATH of 55$; it means that, it is in the undervalue Level and counted as Discounted Asset Price.
The Fibonacci Tools have been Drawn From 0$ to the ATH (55$), so the Specified Levels are well Defined and Proved.
The Asset is at the Accumulation Level Currently, which means soon the smart money will Flow in it and the Price Value will get Pump and Appreciates.
Probably we may not again see this 78.6% Fibonacci Retracement Level or bellow in the current cycle though there are some minimal chances of Price falls to the 85% of its ATH Support area, which may Pivot the Price Fall and start the new cycle.
Our Past Analysis:
Initial Asset Acquisition:

DOTUSDT: Bullish divergenceDOTUSDT: Bullish divergence
1H
Buy from current prices and 19.55-19.08 zone
Stoploss - <18.78
Target-price 1 - 19.94
Target-price 2 - 20.25
Target-price 3 - 20.88

DOT: +$250DOTUSD
Technically and fundamentally, DOT has the potential that reaches $250 by 2024. let's see where it goes.

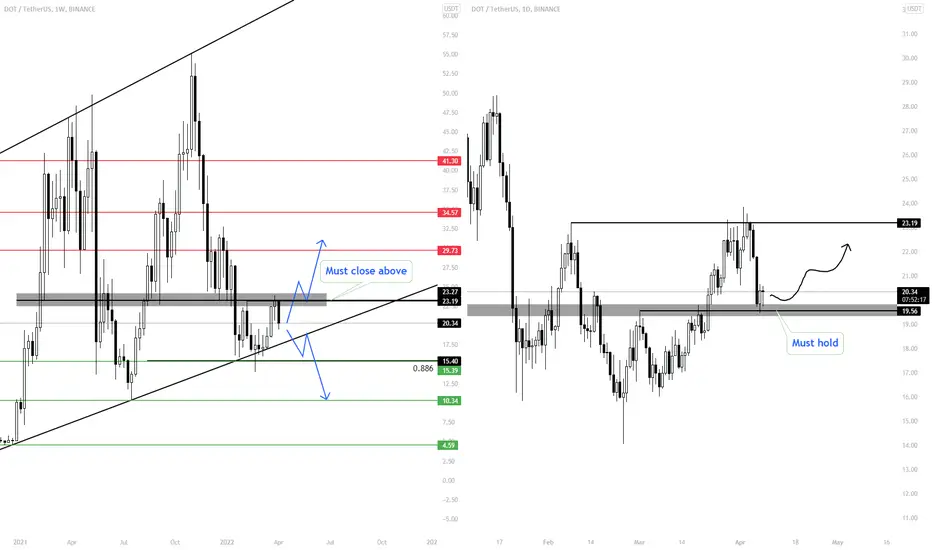
DOT Struggling on Higher Timeframes In the last 5 months DOT has lost 70% of its value, it corrected till 0.886 on Fibonacci until it found a local bottom & bounced off $15.
DOT Higher timeframes:
However, DOT is still struggling to break above the supply at $23 - $24, which is now acting as a strong resistance on higher timeframes.
We need DOT to close a weekly candle above the supply zone $24 for further upside or else it will go for further correction.
DOT Lower timeframes:
On lower timeframes, we're currently retesting the breakout, if we hold it will retest the $23 - $24 supply zone.
Look for entries on lower timeframes for short term trade, for longterm look out for clear break through above the strong supply zone $23 - $24.
DOT bull Run set upDOT Bull Run soon , May and April will be big months for crypto Lets goooooooo Lets make this MF money

DOT/USD: Trend line lower highPolkadot forming a nice trend line lower high since $16.12 USD in the date of March, 07, 2022 and we see an uptrend. Also, you can to put a buy now and SL to $20.20 USD and target to $26 USD. Also, the target toward $24 USD could be good if in case that DOT doesn't reach the $25 USD or we see any correction toward this trend line.
So guys, it's very easy we see that Polkadot forming a lower high in this market structure.
This it's the H8 timeframe and I see a bullish structure from this timeframe.
This will be a risk/benefit of 1:2
Good luck!!!

DOT: Rectanglethe failed descending triangle target has been reached
a close above 23.20 would confirm the bullish rectangle
