Astar Network $ASTR will 40x - 130x this bull run!KRAKEN:ASTRUSD may be one of the most undervalued, under-the-radar cryptocurrencies at the moment.
Astar is the token of the Astar Network. Recently, it was announced that Astar zkEVM will transition to become #Soneium, the revolutionary #Ethereum CRYPTOCAP:ETH L2 launched by #Sony. The founders of the Astar Network and Soneium have announced and confirmed that the Astar Network is a special partner of Soneium and that there will be massive incentives and rewards for Astar token holders. Sony is the first giant tech and entertainment company to enter the crypto industry. Sony will launch a #crypto exchange in #Japan. Sony has a vast entertainment network - Sony Music, Sony Gaming, Sony Film will all be integrated within the Soneium network, so the Astar Network (& Token) will, als the de-facto coin of Sony, have massive utility, unmatched by any other cryptocurrency currently in existence. This insanely bullish news will finally lead to crypto Going Mainstream #GM - and here's your chance to be "in" before the masses arrive - and they will arrive.
This is the bullish narrative and news for #Astar.
However, the Astar chart also shows promising bullish signals.
1. There is a massive hidden bullish divergence on the weekly chart, indicating underlying strength.
2. There has been an EXPLOSIVE increase in volume near the lows. The insane increase in volume began prior to the Soneium announcement, which count hint at insiders accumulating.
3. On Balance Volume is also increasing EXPLOSIVELY, which indicates that the massive increase in volume was primarily due to BUY PRESSURE (buy volume), not sell pressure!
Now, how high can Astar Network go?
Currently, the coin is ranked #140 in terms of marketcap. Its market cap is $0.45b while its fully dilluted marketcap is $0.5b. This means there won't be many unlocks, and, in fact, the Astar Foundation has been burning tens of millions of tokens. The tokenomics are insanely bullish. Furthermore, the coin has very high volume, which means its a liquid coin.
SCENARIOS:
1. Astar bull cycle market cap = Polkadot's current marketcap --> 14x
2. Astar bull cycle market cap = 2x Polkadot's current marketcap --> 28x
3. Astar bull cycle market cap = Polkadot's 2021 marketcap peak --> 130x
4. Astar bull cycle market cap = half of Polkadot's 2021 marketcap peak --> 65x
--- Astar bull cycle market cap = the average of the above 4 scenarios --> 60x
5. Astar bull cycle market cap = Filecoin's 2021 marketcap peak --> 28x
6. Astar bul cycle market cap = Cosmos' 2021 marketcap peak --> 28x
--- Astar bull cycle market cap = the average of the above 6 scenarios --> 49x
--- Astar bull cycle market cap = the average of the two averages --> 55x
7. Astar bull cycle market cap = 20% of Polkadot's this cycle potential marketcap if price returns to previous ATH --> polkadot new ATH marketcap potentially 80 billion x 0.20 = 16 billion / 7.5 billion = 2.13 / 0.062 = 34x
8. Astar bull cycle market cap = 50% of Polkadot's this cycle potential marketcap if price returns to previous ATH --> polkadot new ATH marketcap potentially 80 billion x 0.50 = 40 billion / 7.5 billion = 5.33 / 0.062 = 86x
--- Astar bull cycle market cap = average of the last mentioned two scenarios = 60x
--- Astar bull cycle market cap = average of all the outcomes above (scenarios + averages of scenarios) = 637 / 12 = 53x
Based on these scenarios, a 53x could theoretically happen for the Astar token. The token checks all marks: extremely bullish reversal chart, incredibly bullish news + narrative, new token, good tokenomics, and potential future catalysts to fuel it rising even higher (like a listing on Coinbase, for example).
In my opinion, Astar could 53x from here.
The Astar Network chart looks like it is poised for a breakout. A break above the $0.1 level could trigger a parabolic move.
Finally, lets not forget that Astar Network token has been in a correction since January 2024, while most other coins have only been correcting since April. In other words: Astar's bear market is more advanced and could therefore, theoretically, reverse sooner than other coins.
Do with this information as you wish!
Polkadot

Is Polkadot going to make lower low?Yellow Line - BOS zone
White Line - Resistance of Bearflag pattern.
This is my idea on BINANCE:DOTUSDT and how it will go. We all know Dot is one of the top altcoins with huge potential. As you can see BINANCE:DOTUSDT is much likely to form a bearflag pattern before it goes up. If DOT ever reaches the 2.5-3 zone I would re-enter Long position again. You may think why 2.5-3 zone? isn't it going to make lower low? For me seeing a lower low is a confirmation that we are in a bearflag pattern and checking the bottom support line 3rd time is a huge confirmation to consider a Long Position. So time will tell!

(DOT) polkadotdata according to www.crunchbase.com, data measured monthly.
It is said, Polkadot is most active in China.

Polkadot 2.0- So i predicted many times that 4.30$ was the bottom.
- And i was wrong, Polkadot is still young.
- Trading Altcoins is like that, it's really hard to predict a perfect bottom with a new project.
- it's much more easy with BTC because TheKing volumes are high and it stays around from many years already.
- Remember that Trading is trying to predict the future by looking at the past, more you have data from past, more the job is easier.
-------------------------------------------------------------------------------------------------------------
- A bit FA here :
-------------------------------------------------------------------------------------------------------------
- Polkadot did the same as Cardano's first bullrun, it went back to the start.
( i will post a Cardano Charts in comments )
- Actually it's not a sign of weakness, but an opportunity.
- Polkadot didn't make noise just because they want to build steady following some SEC rules.
- Now if you follow the news, you can find that Cardano, Polygon and Near Protocol are building on Polkadot's SDK, DYOR it more to get some more informations.
- With time Polkadot could be the mother of all blockchains connections and interoperability.
- Remember what they had to do with ETH when problems came around, they forked it for ETC ( Ethereum Classic ).
- Polkadot doesn't need any FORKs, everything can be changed by votes in the governance.
- The difference between DOT and ETH is very simple.
- Polkadot is scalable, Ethereum is not.
-------------------------------------------------------------------------------------------------------------
- Trading Parts :
-------------------------------------------------------------------------------------------------------------
- So Right now look at the graphic.
- DOT made a bottom around 3.60$. The exact same bottom it did in 2020.
- DOT is actually staying near a demand zone (6$).
- i do not recommend to buy now but wait for a retracement or a breakout from this area.
- To get peace of mind i would buy DOT after 8$, after that zone, it's a free fly!
-------------------------------------------------------------------------------------------------------------
My predictions on DOT for the next bullrun are unchanged :
-------------------------------------------------------------------------------------------------------------
- Security TP : 85$ ish
- Middle TP : 140$ ish
- Max ATH : 220$ ish
-------------------------------------------------------------------------------------------------------------
- if you missed to become a Whale with ETH in 2016.
- Here yours second chance with Polkadot.
- Stay S4fe
Happy Tr4Ding !

DOT - Polkadot's Last Hope...Polkadot is facing a huge challenge during the current frustrating sell-off.
As long as it's still above $3.57 I believe there's a chance for a massive bullish run with a bullish confirmation above $7.77
The final stop-loss or cancelation of the idea is below $3.57

DOTUSDT Long Trade Setup✉️ Pair: DOTUSDT
📈 Direction: Long
💯 Leverage: Cross 5x-10x-20x
📊 Entry: $6.00
✅ Target 1: $6.215
✅ Target 2: $6.534
✅ Target 3: $7.12
✅ Target 4: 🚀🚀🚀
⛔️ Stop Loss: $5.00
Wave (3) should start from here; otherwise, the larger wave (2) is likely to be extended, with support at $5.24.
Manage your risk – never trade more than 1% of your capital on a single trade.
🔔 For more updates, follow me and don`t forget to hit the BOOST :D

Will PolkaDot DOT reach the sky this bullrun?Hello, Skyrexians!
Despite the Bitcoin price fast recovery after correction, altcoins remain dead and we understand that it's really annoying for most of market participants. Most of traders now in huge loss after -60% dump for entire crypto market since March 2024. But crypto trading is very risky to experience it without proficiency in different crypto trading strategies. This time even top crypto bot trading strategies and the best crypto traders failed. Nobody has been waiting for such a big crash. Analyzing ideas of top crypto traders on TradingView we can see that most of them are still bullish. For sure it does not mean that market will definitely do down, but if when it start bouncing they remain bullish mood it's gonna be dangerous signal and different trading tools such as automated trading bots, grid trading bot and other algorithmic trading bots can face with a huge loss again. In our opinion only ai crypto trading bot can overcome this problem because of using non linear approach.
In today's article we are going to share with you our analysis on BINANCE:DOTUSDT to help you setup your crypto trading bot algorithm or trade manually. Hope it will help to avoid mistakes and decrease potential losses. Let's get started!
DOT macro overview
History of this crypto asset has enough bars to make a complex analysis. This fundamentally strong L0 project has been listed in 2020 just before the massive bull run. The previous bull run wave the largest degree wave 1. After that we saw the first sell off. Some traders may tell that it's wave 4, but we counted it as wave A inside the larger wave 2. Wave B set up the bull trap and printed the irregular correction and after that the wave C has started.
In our opinion this wave C inside 2 has been finished in October 2023 with the massive reversal bar at the bottom. This is the strongest signal of trend end. Now the new impulsive wave 3 has been started. We want you to pay attention to the fact that DOT is the uptrend asset, price has not hit the previous bull run start and it's the great sign that in this cycle it has a great chances to set new ATH.
Talking about potential targets we can use our favorite Fibonacci extension. The most conservative target is $51 (almost at the ATH), the likely one is $79 and unbelievable is $119. We expect the reaching at least the first target in $2024-$2025.

I am entering Long-term Long position on Polkadot!BINANCE:DOTUSDT all time high in early March which is huge sign to go up. As you can see there was a crucial resistance channel holding BINANCE:DOTUSDT since last June. Now BINANCE:DOTUSDT consolidating above it and checked weekly crucial support zone once. I suggest you to look at my last idea on BINANCE:DOTUSDT and where to take profits.

DOTUSDT 1DDOT ~ 1D
#DOT In 1D Time Frame, BITSTAMP:DOTUSD Successfully penetrated the resistance line of this pattern. this seems to be very good for bull domination. short term target of at least 10%+ from here.

DOT DOT DOT DO YOU LIKE DOT?After a nice reaction from the Value Area low, we are trading at the POC.
The areas I would look for a long would be a supply/demand flip of the POC targeting the Value Area High & Range High, or a retest of the Value Area Low After a sweep of the lows.
Calculate Your Risk/Reward so you don't lose more than 1% of your account per trade.
Every day the charts provide new information. You have to adjust or get REKT.
Love it or hate it, hit that thumbs up and share your thoughts below!
This is not financial advice. This is for educational purposes only.

DOTUSDT Poised for Major Bullish Breakout or Risk of Decline!Yello, Paradisers! Have you been tracking #DOTUSDT lately? It's showing some strong signals that could lead to a major bullish continuation from support. Let's dive into the details!
💎After a careful analysis of #DOT price action, we've observed a promising pattern. For a long time, CRYPTOCAP:DOT has been adhering to a descending trendline. Recently, it has successfully retested this descending resistance, assessing key resistance at $6.576, indicating a potential bullish move. If #POLKADOT breaks above the $6.576 resistance and sustains its momentum, we could see a significant bullish continuation.
💎However, due to previous strong bearish pressure, there's an imbalance in the price. It's likely that the price might revisit this level to fill the imbalance. If CRYPTOCAP:DOT fails to initiate an upward movement from the retest level, we should look for a bullish rebound from the lower support at $5.403. On the flip side, if the price breaks below the $5.403 support, this could invalidate the bullish setup and lead to further declines.
Stay sharp and trade smart, Paradisers! Stay disciplined and focused on your trading strategy.
MyCryptoParadise
iFeel the success🌴

DOT providing a clean Long SetupDOT with a nice bullish market structure break provides a long setup into the buyside liquidity above.
Low hanging fruit target provides the bread.
Good luck :)

DOTUSDTPolkadot (DOT) retraced to the golden pocket after a very good impulse to the upside from the bear market low. This is looking like a very promising chart. It can have a good impulse to the upside for its Wave 3.

Polkadot (DOT): Setting Up for a Bullish ReversalBINANCE:DOTUSD has recently breached the $6 level, forming a bullish divergence, as indicated by the vertical lines on the chart. The exit from the 3.618 Fibonacci time zone should ideally mark the end of Wave 2, though the exact completion of Wave 2 may lie slightly outside this range. It appears that Polkadot has completed its accumulation phase and is now entering the manipulation phase, with potential for expansion to follow.
Given the current situation, we are planning to place an entry at $4.85, with a stop-loss set just below the 100% Fibonacci retracement to protect against a Wave 2 invalidation. Our initial target is $9.30, aligning with the Daily Fair-Value Gap. This strategy aims to capture the potential upward movement as Polkadot transitions from accumulation to expansion.
Yearly VWAP Analysis:
Polkadot is currently holding the 2021 VWAP level perfectly. However, if this level is lost, the price could move down towards the 2021 VAL (Volume Area Low) at $4.55, which might provide significant support. To resume a bullish trend, Polkadot needs to reclaim the 2021 VAH (Volume Area High) at $6.80. Overcoming this level is essential for a sustained bullish move. If these levels are breached, a drop to the 2021 VAL at $4.55 is possible, where we might find strong support. Overcoming the yearly VWAP resistance is crucial for a bullish continuation.
Monthly VWAP Analysis:
Polkadot has lost the April VAL (Volume Area Low) and recently touched the November 2023 VWAP. Holding the November 2023 VWAP is crucial to maintaining a bullish stance, although there is potential for further downside. We anticipate a possible drop to retest the November 2023 VWAP and VAL levels to gather momentum for a bullish reversal. To turn bullish again, Polkadot needs to reclaim the current month's April VAL and VWAP levels, suggesting a stronger bullish outlook.
Conclusion:
If Polkadot fails to hold the November 2023 VWAP, we expect a move towards $4.82. For a bullish reversal, reclaiming the April VAL and current monthly VWAP levels is essential. Until these levels are reclaimed, we remain cautious and anticipate further downside. Our trading strategy involves entering at $4.85, with a stop-loss at $3.55. The take-profit targets are set at $7.76, $9.50, and open for further potential gains.

Polkadot (DOT) Faces Increased Selling MomentumCritical Support Breach:
The daily chart shows a significant increase in selling momentum, driving Polkadot’s price below the critical $6 support level and out of a multi-month triangle pattern. This breach has triggered a substantial long liquidation event.
Downtrend Indication:
The price displays no signs of recovery on the daily timeframe, indicating the possibility of a continued downtrend.
Temporary Pullback Potential:
A slight and temporary pullback to the broken $6 threshold could occur, confirming the breakout and solidifying the bearish scenario.
Key Levels to Watch:
Primary Target: The substantial support region at $5.
Resistance: The significant resistance at $6.
Market Volatility:
Traders should exercise caution as the market may experience heightened volatility and notable fluctuations in the short term.
Stay alert and manage your positions wisely during this volatile period! ⚠️📉
#Polkadot #DOT #Crypto #MarketAnalysis #TechnicalAnalysis #Cryptocurrency #Trading #Bearish #Volatility

Long idea on DOTok, I need to describe the damn thing, I came in, I just believe in the high season now (I will duplicate the description in coins that I will take)

Support around 6.684 is the keyHello, traders.
If you "Follow", you can always get new information quickly.
Please also click "Boost".
Have a nice day today.
-------------------------------------
Unlike the SOLUSDT chart, the DOTUSDT chart is in a reverse arrangement, that is, a downward trend, with the M-Signal of the 1D chart < M-Signal of the 1W chart < M-Signal of the 1M chart.
When trading stocks (coins, tokens) that show this kind of movement, it is recommended to trade in short bursts.
Currently, the BW indicator of the TS - BW indicator is forming a horizontal line at the lowest point, and StochRSI > StochRSI EMA.
And, depending on whether there is support near HA-Low (6.684) on the 1D chart, you can trade.
Therefore, it can be seen that it is in a position where you can trade before the SOLUSDT chart.
However, as I mentioned above, since the price is below the M-Signal indicator on the 1D chart, it is recommended to check whether it breaks through upward and maintains the price.
Accordingly, I think it is more stable to check whether there is support near 7.283 in the box section of the HA-Low indicator on the 1D chart (6.053-7.283) and trade to make a purchase.
Since it has not been long since it turned into a downtrend, if it rises above the HA-High indicator (8.144) on the 1W chart, there is a possibility that it will show a movement to turn into an uptrend, so whether there is support near the HA-Low indicator on the current 1D chart is an important key point.
If it falls below 6.343, you should check for support near the 5.473-5.929 range.
If it rises above 7.319,
1st: 8.144-8.620
2nd: 10.131-10.611
You should check for support near the 1st and 2nd ranges above.
Have a good time.
Thank you.
--------------------------------------------------
- Big picture
It is expected that a full-scale uptrend will begin when it rises above 29K.
The range expected to be touched in the next bull market is 81K-95K.
#BTCUSD 12M
1st: 44234.54
2nd: 61383.23
3rd: 89126.41
101875.70-106275.10 (overshooting)
4th: 13401.28
151166.97-157451.83 (overshooting)
5th: 178910.15
These are points where resistance is likely to occur in the future.
We need to check if these points can be broken upward.
We need to check the movement when this section is touched because I think a new trend can be created in the overshooting section.
#BTCUSD 1M
If the major uptrend continues until 2025, it is expected to start forming a pull back pattern after rising to around 57014.33.
1st: 43833.05
2nd: 32992.55
-----------------

Polkadot Next BullRun- Okay now that we got the Bottom ( 4.3$ ish).
- We can try to calculate the highest points for the next bull run.
- i am not in patterns too much but we can see that DOT formed a kind of Cypher Bullish Pattern.
- A resistance was created around 9.80-10$.
- So Polkadot will have to go retest this zone and breakout to climb more.
--------------------------------------------------------------------------------------------------
- TP Zones :
--------------------------------------------------------------------------------------------------
- TP1 : 50$ ish (ATH 2021).
- TP2 : 85$ ish (161.8 Fibo).
- TP3 : 200$ ish (Max Fibo 423.6).
--------------------------------------------------------------------------------------------------
- Like Always :
-- Take your train ticket before the mass.
-- Sell when others rush to buy :D.
Happy Tr4Ding !


DOT's last bottom before the new ATHCRYPTOCAP:DOT will be ready to target a new ATH from the $4.90 : $4.25 range in my opinion.

DOT - at the beginning of the returnIt seems that Polkadot, the DOT, has made a harmonic pattern. And the downtrend line has broke due to the uptrend wave started by the BTC.
However, be careful since there probably be a retest or pullback down to shake some of the buyers.

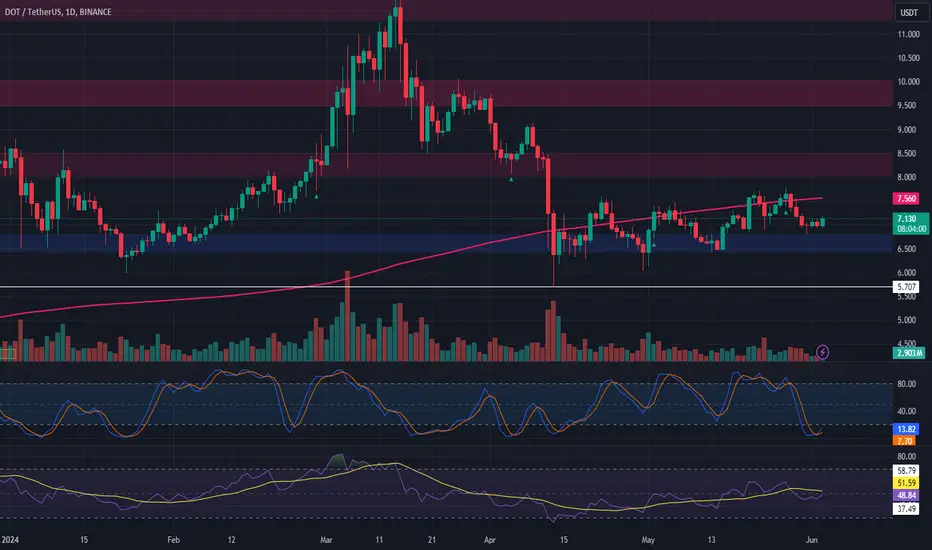
Polkadot (DOT) Daily Chart AnalysisCurrent Situation:
A detailed examination of Polkadot’s (DOT) daily chart reveals a bearish sentiment. The price faced rejection after a period of sideways movement around the critical $7.5 resistance level and the significant 200-day moving average.
Bearish Indicators:
Resistance Rejection: The price was rejected at the $7.5 resistance level, reinforced by the 200-day moving average.
Seller Dominance: Sellers are currently dominating the market, suggesting a bearish retracement towards the $6.5 threshold is increasingly likely.
Key Support and Resistance Levels:
Resistance Level: $7.5
Support Level: $6.5
Market Context:
Despite the bearish sentiment, Polkadot remains confined within a decisive range marked by the $7.5 resistance and $6.5 support. A breakout from this range will likely establish the direction for a sustained trend.
Trade Strategy:
For Bears: Watch for a break below the $6.5 support level for potential short opportunities, targeting lower levels.
For Bulls: A break above the $7.5 resistance could signal bullish momentum, providing opportunities for long trades.
Stay vigilant for a decisive breakout from this range to gauge the next sustained trend direction for Polkadot.
#Crypto #Polkadot #DOT #MarketAnalysis #SupportAndResistance #BearishTrend #200DMA #TradingStrategy #Cryptocurrency #Blockchain
Polkadot: Is it time to buy?DOT is trading almost 87% lower than its previous ATH and is now about to hit its bottom support again, IMO. The $4.75 level is my buy zone for DOT, with a target of $14 for the midterm and an optimistic target of $128 for the long term in case of a super bullish market.
