DOTUSD - Falling Wedge Falling Wedge leading to a strong pattern break out
Below is an example of a similar Falling Wedge however on a different coin (NEO)
Polkadotlong

POLKADOTDOT/USDT here is the another coin we waiting to make pullback on Fixed Range Volume Profile (FRVP) if dont support this zone we will go in the SUPPORT 1 waiting for breakout to take LONG position if and this zone dont make Breakout Next is Support 2


DOT USD ANALYSISPolkadot has a nice healthy bullish trendline which is holding. When we break this resistance, we can go to $27. Just watch EMAs and volume.

The Reversal has Begun DOTUSDSimilar situations can be seen between the previous reversal and the one we are about to see
entering into DOT right now is nice because it is already in a state of reversal
Trying out new indicators

DOT - The Journey Of Two Paths...The much beloved Polkadot (DOT) is at a point of inflection in its journey. It has reached a point where it could have either a strong bullish or bearish run. In this trade idea, I will discuss each possibility and you can see which trade idea you would like to initiate.
TO BUY DOT?
How did we get to this point? When looking at DOT on the 1 Day chart, the price has fallen to a very longer-term level of resistance; dating back to 2020. This level of resistance is probably due to the large amounts of DOT that is staked and provides a strong level of support. If your Bitcoin thesis is that BTC has reached its lows and will start to consistently rebound, then this presents a good DOT buying opportunity
LONG: Enter at Current Market Price
Stop-Loss: $14
Take Profits: $22.50, $27,60, $30.80, $38.00
TO SHORT DOT?
DOT and many other alt-coins could have a bloody several weeks or even months if Bitcoin is not able to maintain its current price levels and BTC starts crashing down to the $20k range. With this, you could short DOT as there is no resistance from the current price levels down to the $7 range. Although many people have DOT staked for long periods of time, there reaches a point where the price gets too low for them and they start unstaking and selling.
SHORT: Enter at Current Market Price
Stop-Loss: $20
Take Profits: $10.30, $8.25, $4.20
Let me know your comments & opinions below.
Cheers!

polkadot is ready for Wave G NOTE :
Personally, I have been a staunch opponent of digital currencies for a year now, but as I said before, I have recently seen good endurance and demand in this bloody market, and now I hope to climb.
I think that the banks and financial institutions of the world, with the decline of all markets and its uncertain future in the war, have a good excuse to have a good profit in this market from the people.
Governments are also supporting the burning of money and the reduction of inflation

POLKAD👁🗨T Consolidation PatternDOT seems to be headed into consolidation pattern with 78.6% acting as strong support with a favorable risk & reward. Look to place longs on DOT while managing the downside risk for DOT as the consolidation pattern is likely bring us into April -May

POLKADOT(DOTUSDT) SHORT TO $8-$9 POLKADOT(DOTUSDT) is going through an A-B-C correction. The correction looks like a Zig-zag correction which is a 5-3-5 wave design
Wave A - Went from $49 to $10.6
Wave B - Went from $10.6 to $55
Wave C - it's a 5 wave series and I think it will end up at $8-$9 zone before reversal
POLKADOT(DOTUSDT) going to retrace to 88.6% or 94.1% correction TO $8-$9 . We are presently at 78.6% FIB retracement, so the next best points are 88.6% and 94.1% and they are derived by the following formulae:
88.6% price level is derived by squaring (or multiplying by itself) from the Golden Ratio, 0.618:
0.618 x 0.618 = 0.786 (78.6%)
0.786 x 0.786 = 0.886 (88.6%)
0.886 x 0.886 = 0.941 (94.1%)
88.6% retracement price is $9.3
94.1% retracement price is $6.7
I believe POLKADOT(DOTUSDT) will still be shorted and may find the reversal between 88.6% and 94.1% zone because that's also a junction point where retracement of the whole five-wave series and the extension of the A-B-C meet
Please like and comment for feedback

#DOTUSD #Polkadot Target 65$I estimate 2 different path for Polkadot.
I think before new ATH we will test long term support line. But according to BTC moves, it might be now or after H&S formation.
One way or another it doesn't matter at final I believe we will see 65$ within 6 months.

Polkadot: Ready to Go Downhill 🎿We’ve connected the dots for Polkadot and established our forecast: Polkadot develops a new interim low by falling below the support at $25.3272. In our opinion, this confirms further downward movement toward $10.3759 and into the magenta-colored area between $10.8195 and $5.7131, where wave (c) in blue should end. Only after reaching this zone should the price go up for longer periods.
However, there is a 25% chance that the price could rise earlier and, after hitting the support line at $50.5587, ascend further still.

Dot usdt polkadot longHere is polkadot long setup. Since MARKET is Choppy use little margin. If a positive scenario it could go upto 32.

EVER HEARD OF THE SEX GODESS NAMED POLKADOT???Greetings fellow Traders,
Today we consider the trading pair DOT/USDT
Looking at the chart above us, we can see that ever since DOT was listed(or after the rebrand at least), Price has continued to respect an ascending Trendline while forming a Ascending Triangle pattern in the process.
Currently Near Support of the trendline, and still in it's Larger Wave 2 correction, Price seems almost bottomed out.
Taking a look at our RSI, ever since the wave 1 top & price hiting our triangle resistance, a bearish divergence was formed, sending both price action & our RSI into territories for a buying spree, most notably the RSI into the oversold region and price into accumulation.
Should that same pattern repeat itself (and it looks just as though it might), we can expect one last retracement to the trendline support before gearing up for another impulse wave move to complete wave 3.
Take profit zone is calculated by taking the length of the triangle from start to resistance and placing it ontop of the triangle, along with some other confluences on the fibonacci tool.
Trade Idea:
--DCA your way down to triangle support
--Target PROFIT ZONE for quick gains
--HODL the rest until strong price rejection.
If you agree with this idea, pls leave a like as well as your thoughts in the comments section.
As always, feedback is appreciated!

Dot Extremely Bullsih!Despite the Recent Downtrend, Polkadot is finally bullish again. It has recently seen a trend breakthrough. I am going to be leveraging this trade, and my tp levels are at each resistance level. With a macd cross and stoch cross, momentum is in our favor on this trade.

Polkadot might be headed to the moon!History repeats itself or not? It has happened with Bitcoin, Ethereum, Binance Coin and several others.

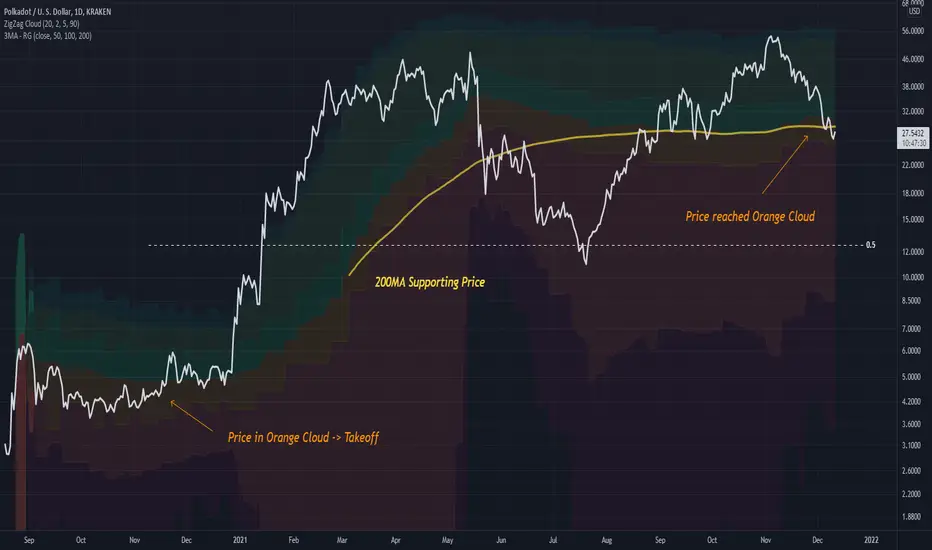
DOTUSD Analysis Using Cloud IndicatorUsing the cloud indicator we can see that prior point of being in the orange area price went lift off!
Assuming we are in a bullish state, (as price was then), the orange area is a good candidate point for price to continue upwards
This theory is also supported by the 200 day MA, which price is currently hanging onto right now.
Entry into DOTUSD now is a great decision if you are a believer in the project
POLKADOT IS BLEEDING - DOT USDDOT USD chart does not look good for POLKADOT. But the RSI shows it is oversold and we are also hiding pretty strong support. I expect the price to go higher at least to $32. YOU should not go all in until we break up the bearish TL.

Polkadot: Shake It! 🤑🤑🤑Now, Polkadot has successfully left its past low behind and is set for a moderate rise in the area between $43.80 - $52.76. However, the price should then start another correction and move to the bottom end of the green zone. Finishing this movement, there is plenty of room on the upside, where the price should push through the resistance at $55.3767.
Let's Go!

PolkadotHello
everyone look at this chart
we near important support line at weekly time
I suggest you buy Dot and holding for 70

Great long term entries for $DOT56% from all time high is a steal! Polkadot is a phenomenal project in its parachain auction process. I will be adding to my long-term bag here.

POLKADOT YEAR END PROJECTIONPOLKADOT seems to be respecting the trend lines
Along with the fib retracement
bullish target at $72
If history repeats itself
Let me your thoughts in the comment section

DOTUSD Ascending Scallop Pending BreakoutDOT can be seen to continually reject the price along this chart pattern line
It is called an ascending scallop
and they love to break out to the upside even further when the formation is completed (green oval)
Big upsides coming

PolkadotPolkadot is beginning to weaken, not only in itself, but particularly in comparison to that of Bitcoin.
As we've discussed at length here on TW, Bitcoin continues to show some bullish sentiment due to its recent technical breakout in MARA/BTC. As long as this pertains, we'll stick with the majority of our position in Marathon Digital Holdings.
60 percent of my portfolio is currently in Marathon. The remaining 40 percent is spread out in alts. With that said, I might consider reallocating a good chunk of those alts into Marathon as a few of them show emerging weakness, both individually, but even more so when directly compared to Bitcoin.
On the Poladot versus Bitcoin chart, the price was once again rejected by the horizontal resistance zone - and this after a minor fakeout. On top of that, the price has recently dropped below the diagonal support as well and is presently trading in a weak spot.
And to add fire to the flames, we also have a 3-point RSI divergence on the daily chart.
If this bearish internal trend were to continue, it naturally doesn't mean the price of Polkadot may go down. All it means is that Polkadot will then be expected to under perform versus that of Bitcoin.
Let's then dig a bit deeper to find more clues of the overall market health condition.
If we proceed to look at Polkadot itself (as in compared to the USD), we can firstly detect that it's trading right at the horizontal support zone. On top of that, the RSI looks strong too and for two reasons.
Firstly, it has retraced quite much - by almost 20 points to be precise - from a mere and seeming price correction.
Secondly, it is still trading within a strong bullish red RSI channel.
So far it shows every sign of health. This in combination with the strong horizontal support zone and the thus far strong bull trend gives me no reason whatsoever to be bearish on Polkadot. Quite the opposite!
This means that if we put the just-turned-bearish DOT/BTC next to the nicely and bullish-looking DOT/USD we can technically conclude that Polkadot's trend is up, but that it is yet statistically bound to under perform versus that of Bitcoin. This in turn leaves us with the conclusion that Bitcoin is even more bullish.
To further add weight to our technical case - as in to further increase the probability of being correct - we will soon proceed to compare more individual alts and their respective strength-relationship to that of Bitcoin.
But for now, it's Bitcoin season 1 - altcoin season 0, yet with both looking technically bullish regardless.
