DOTUSDT Ready to make new ATH!DOTUSDT (Day Chart) Technical Analysis Update
DOT/USDT currently trading at $44.90
Buy level: $40.00 - 45.00
TP 1: $60.00
TP 2: $75.00
TP 3: $85.00
TP 4 : $100
Stop loss: $38.00
Max Leverage: 1x or buy it on spot market
Always Keep stoploss
Polkadotusd

Dotusdt Weekly H&S Breakout confirm Dot usdt pair is looking very solid and has strong fundamental news as well. Buy a bag full of dot to enjoy the all-time high this moonovember. BTFD and DCA is must
TP 75
TP 83
TP 90
TP 100

We Dancin'Close above 47.02 to clear the previous 2 week highs and 161 fib level means we are doing the Polka al the way to 60.

Highly anticipated Polkadot Parachains auction is bullishHello everyone,
It's been a while, i've been very busy with The OWL channel. Here is a DOTUSDT chart. Polkadot is looking good, KDJ is green on every timeframes and DOT keep creating higher high..
Resistance to watch :
0.9 at 44.58$
1.23 at 57.06$
Going over 57$ and confirming 57$ new support can trigger another swing to :
161.8% = 68.55$
175% = 72.30
200% = 79.41
261.8% = 96.99$
Last 2 weeks candle push us over the last tweezer top resistance (green dots lines).. Now not much resistance left until last ATH and the 1.23 fib.
Parachain Auction will start soon for Polkadot... first auction is slated to begin on Nov. 11.
Which you the best ! Crypto Mercy

Polkadot ready for a swing to 68$It's been a while, i've been very busy with The OWL channel. Here is a DOTUSDT chart. Polkadot is looking good, KDJ is turning and the RSI is responding, no divergence on the last higher high.. We are now very near a new ATH...
What to watch : Resistance 1.23 at 57$
Going over 57$ and confirming 57$ new support can trigger another swing to :
161.8% = 68.55$
175% = 72.30
200% = 79.41
261.8% = 96.99$
Last 2 weeks candle push us over the last tweezer top resistance (green dots lines).. Now not much resistance left until last ATH and the 1.23 fib.
Which you the best ! Crypto Mercy

DOT TrendPolkadot price is going through full-size resistance as it sits interior a supply region. Clearing this barrier will open the course for DOT to retest its all-time high and set a new one.
Polkadot price is presently consolidating inside the $40.06 to $48.34 supply sector.
DOT would possibly dip to the $37.50 support floor from wherein it could catalyze a 65% bull run.
A decisive close under $33.27 will invalidate the bullish thesis.

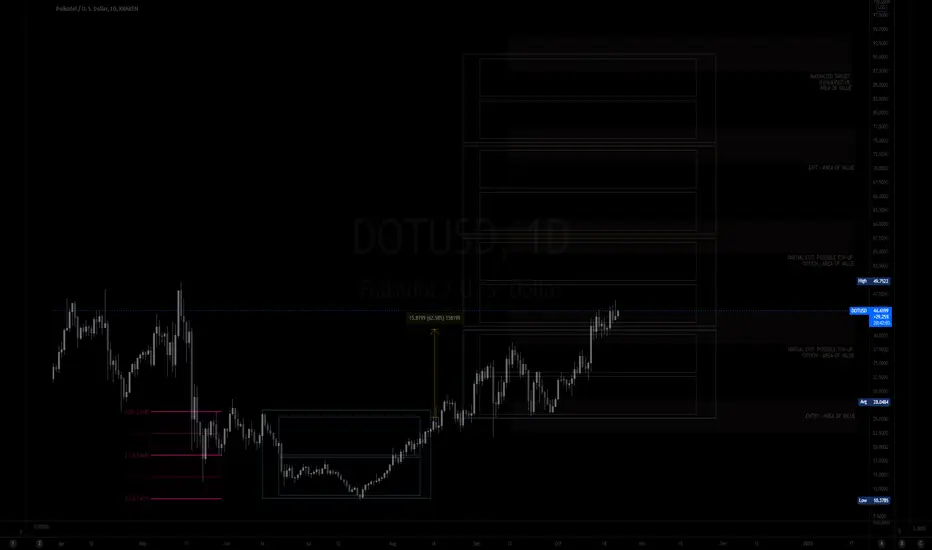
MY MINIMALIST ANALYSIS FOR POLKADOT$DOT
10.23.21
116H +8 SINGAPORE
ALERT: MARKED ENTRIES and EXITS FOR A SWING TRADE
HOW TO USE MY CHART
It is designed for SWING TRADES at the BOTTOM. I do not SHORT (in support of all the DUMB-MONEY traders like me.) Though you can still use it.
Created on a WEEKLY & DAILY Analysis of Dynamics of the Market.
LARGE BOXES are major pivots that will occur, while the small boxes are MINOR PIVOTS. These can be entries to a BUY/ SELL POSITION or an EXIT/PARTIAL EXIT/TOP-UP AREAS.
Watch out for Chart Patterns, Candlestick Math, Market Dynamics, and your Fibs.
This CHART is best used without indicators. The MINOR and MAJOR BOXES (TOPs and BOTTOMs), together with
the market's price action and the above mentioned is sufficient enough as analysis when ENTERING AND EXITING TRADES.
Thank You for your appreciation and support (Follows, Comments, and Likes.)
DISCLAIMER:
The findings of the following analysis are the sole opinions of the publisher of this idea and should not be taken as investment advice.
Polka Dot divergence and Fractals So I am looking at this daily....
They had 25 days of price growth with a downward trend of RSI: Causing a 35% pull back
Naw we see a solid recovery but it looks like the same thing is playing out on a smaller scale?
Coould we see RSI tend down while price goes up?
Could the pull back be at the prior ATH resistance of just shy of $50?
Ill watch it and update it..
I am always sus on shorting in the bull market...if I do it for 5 or 10% swings. because it could spike hardcore upwards on a dime.
But also with the release or Parachains and ecosystem growth...I could see Dot do 300 easy this bull run.

DOT own directionDOT is going its own way and strong position on the market allows to avoid more influence of BTC on DOT, we will see if the near future will also be the same

DOT is ready to make new ATH!According to technical analysis DOT have a perfect potential to make new ATH and growth.
Potential Targets are marked on the chart.
Write your comments and don't forget to like.

Polkadot Price AnalysisDOT is trading within a tight range after bouncing off the psychological level of 40 earlier in the week. On Wednesday, the altcoin has been on a rebound for two consecutive sessions. Subsequently, it hit an intraday high of 45.53 on Thursday before pulling back. On a three-hour chart, it is trading above the 25 and 50-day exponential moving averages.
In the immediate term, I expect the crypto to trade within the horizontal channel of between Thursday’s high of 45.53 and along the 25-day EMA at 42.65. Above the channel’s upper border, the bulls will strive to retest the year’s high of 49.75. On the flip side, a move below the lower border will likely have the bears retesting the support zone of 40.00.
Feel free to get in touch for premium trade signals

Polkadot Update: 11% away from ATH next Target $73 @ 161.80%Polkadot Update 20/10/21: 11% away from ATH @ $49.45, the next Target $73 @ 161.80% Fibs. Happy Trading
Polkadot Update 19/10/21: Bullish Bias still holds! Please See Previous analysis below. Buy Signal from Script triggered on the 1st August: Fast EMA Crossover Slow SMA .
Confirmed reversal, Polkadot Buy Signal from Script triggered: EMA Crossover SMA just below the 23.60% fibonacci level, 43% gain from here to retest the 200 MA. Use buy zone to map your buys. Swing target from here is 160% gain from $18.92 to $49.75.
Current Price Targets: 20/10/21
127.20% Fibs @ $60.08 (35% Gain from current price level)
161.80% Fibs @ $73.59 (66% Gain from current price level)
261.80% Fubs @ $112.66 (155% Gain from current price level)
Happy Trading :)
See previous analysis below.
Polkadot (Dot) Buy opportunity! Potential 50%+ Gain to set a New ATH of $50 at the 161.8% Fibonacci Level. Dot's price soared to a high of $42 on 20/02/21. Since setting this new ATH , it has lost some momentum, retracing down to a low of $26 on the 23/02/21 after such an impulsive move, but currently it is still trading 45% above this low 4days ago on the 23/02/21.
The fundamental outlook for Dot in the long-term is great and still very much bullish , its total Market Cap is at $33.7 billion and currently ranked 6th biggest digital currency in the world after Bitcoin , Ethereum , Cardano , Binance Coin and Tether. Over the coming month we expect Dot to retest the previous ATH of $50 at the 161.8% Fibonacci extension .

Polkadot Update: Buy Signal Script triggered: 45% Gain to $60Polkadot Update 19/10/21: Bullish Bias still holds! Please See Previous analysis below. Buy Signal from Script triggered on the 1st August: Fast EMA Crossover Slow SMA.
Confirmed reversal, Polkadot Buy Signal from Script triggered: EMA Crossover SMA just below the 23.60% fibonacci level, 43% gain from here to retest the 200 MA. Use buy zone to map your buys. Swing target from here is 160% gain from $18.92 to $49.75.
Current Price Targets:
127.20% Fibs @ $60.08 (45% Gain from current price level)
161.80% Fibs @ $73.59 (78% Gain from current price level)
261.80% Fubs @ $112.66 (173% Gain from current price level)
Happy Trading :)
See previous analysis below.
Polkadot (Dot) Buy opportunity! Potential 50%+ Gain to set a New ATH of $50 at the 161.8% Fibonacci Level. Dot's price soared to a high of $42 on 20/02/21. Since setting this new ATH , it has lost some momentum, retracing down to a low of $26 on the 23/02/21 after such an impulsive move, but currently it is still trading 45% above this low 4days ago on the 23/02/21.
The fundamental outlook for Dot in the long-term is great and still very much bullish , its total Market Cap is at $33.7 billion and currently ranked 6th biggest digital currency in the world after Bitcoin , Ethereum , Cardano , Binance Coin and Tether. Over the coming month we expect Dot to retest the previous ATH of $50 at the 161.8% Fibonacci extension .

DOT TRENDIt’s natural to be hunting for appealing investments inside the altcoin market right now. Once market leader Bitcoin scales to a new ATH, alts might be waiting in the wings for a rally in their very own. Now Polkadot makes a robust argument that its anticipated leap could come sooner than most of its peers, attributable to bullish market conditions.

(DOT) POLKADOT - Cup and HandleHello everyone !
Today the Black Cat Trader is analyzing DOT based on a weekly chart.
What we can see :
- A nice Cup and Handle pattern has been printed on the weekly chart. We can see that prices recently broke the neckline at 37.80 $
- Using the pitchfork (low : 3,60 high : 49,78 Low : 10,37) we can see that prices are stuck between the median line and the intermediary lower line of the pitchfork.
What we can expect :
- The ideal scenario would be for prices to make a pullback on the neckline of the C&H pattern at approximately 36,50$ and then take off to go even higher. You can see that the expected pullback area is located exactly where the intermediary lower line of the pitchfork is.
- Using the trend-based fib extension we can mathematically expect prices to reach two targets that match with our C&H objective too (208,25$).
Take profit 1 : 85$ (1.618)
Take profit 2 : 131$ (2.618)
Take profit 3 : 177$ (3.618)
Take profit 4 : 208 $ (C&H objective)
Support 1 : Neckline of the C&H / Intermediary lower line of the PF
Support 2 : Mid-term ascending trendline
Support 3 : Lower line of the PF
IF YOU LIKE THIS POST, FEEL FREE TO LEAVE A LIKE AND FOLLOW THE BLACK CAT TRADER
MAY THE CRYPTO BE WITH YOU GUYS (D.Y.O.R)

DOTUSD Bullish TargetTargeting the 1.272 Fib level which is placed within a parallel channel that can be developed
DOT has been acting very bullish lately
Hence the chart

Polkadot daily chartToday I took a look at the Polkadot chart. And as usual I first looked at daily chart. And what I found? There is a huge resistance at approximately 38-39$. So far, DOT has had a lot of trouble breaking through that resistance. However, when will DOT successfully breake this resistance, I expect explosive growth. Especially in anticipation of the upcoming parachain auctions. I expect at least 100$ DOT.

DOTUSDT Broadening Wedge!DOTUSDT Technical Analysis Update
DOTUSDT currently trading at $34.55
Broadeneing Wedge
Long Entry: Above $34.70
Stop loss : 33.45
Target 1 : $35.45
Target 2 : $36.20
Target 3 : $37.00
Max leverage : 2x
Always keep stop loss

DOT Great BuyThis upward cone has formed with two distinct formations within it
the first expanding, the second contracting
after these formations finish bullish action is experienced (in green)
And we have just finished the contracting formation (green)
also see chart below

DOT breakoutDOT broke out of our triangle pattern that has been forming since late august. We can see a strong bullish candle just tapping the most recent resistance level. If it closes above I will consider that a strong entry point.
We can also see the 50MA curling up and looking like it's about to form a golden cross. Volume seems to be increasing as well although there is room for improvement on that front.

Polkadot- temporary stagnationDOT currently looks stable and whether it will grow strongly only depends on BTC and its impact on the rest of the market, BTC has the biggest impact on the rest of the cryptocurrencies


DOT Buy Potential ContinuesA falling wedge and a current rising megaphone
I expect .786 fib level to hold and a breakout above the megaphone will occur
0.5 showed great support
