Polygon · Bottom, Recovery & 5,000% Growth PotentialPolygon has been bullish since April, clearly rising from its base for months. Now this Cryptocurrency trading pair is preparing for a new phase and market cycle. It is preparing for its 2025 bull market wave.
Polygon after a major drop produced a clear bottom and higher lows. This process has been active now four 120 days/4 months. This is a long consolidation period and there are no new lows, clearly. A rising triangle as a reversal signal is also present on the chart.
The accumulation period has been lasting, we can see how patience is key for success. Who would be able to hold for four long months? Who is still holding wise for 120 days?
Well, those who wait get paid. Those who waited will get paid but there is no need to wait because you can still buy and profit from the incoming bullish wave. The difference is that prices are higher now so growth potential is limited compared to several months in the past, that's how it works. The market builds up strength slowly and as this strength is being built prices grow.
When there is enough strength, enough interest and enough growth, the masses enter the market and this produces a major bull run. I've been warning you, we are getting very close. The action is already happening now, don't be surprised when you see a 300%+ bullish jump. That is exactly what is coming and it will all happen within a few months.
Expect 500% to start but aim for 1,000%, 2,000% and in some cases even more. Many good, strong and reputable pairs will grow 3,000%, 4,000% or 5,000%. Polygon will be one of the big ones.
Thanks a lot for your continued support.
Namaste.
POLUSDT

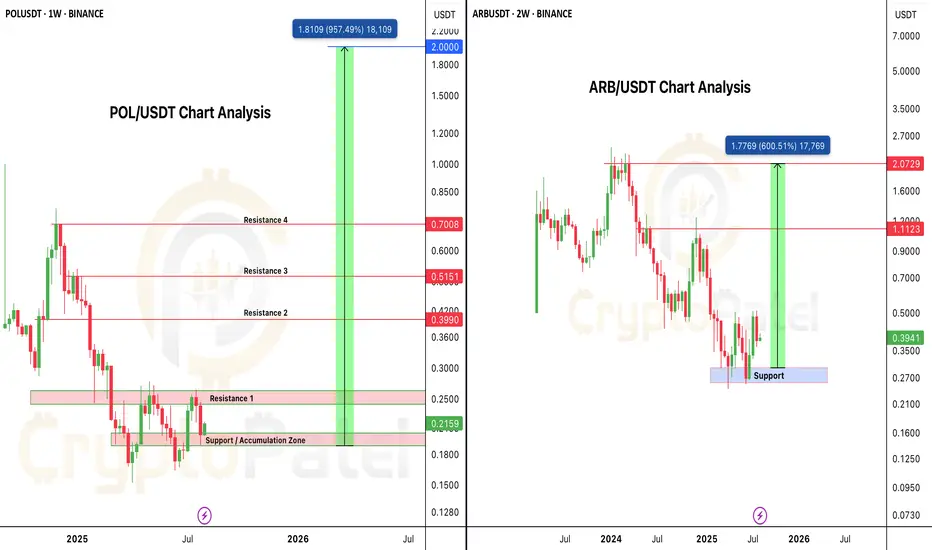
Altseason is Loading... Which One’s Your 10x Pick – $POL or $ARB🚨 BULL MARKET ACCUMULATION ALERT 🚨
Both PSX:POL and AMEX:ARB are currently trading below $0.40, and both charts are showing strong long-term bullish structure.
PSX:POL Analysis:
• Current Price: Under $0.40
• Strong Entry Zone: $0.20 – $0.17
• Bull Run Targets: $2 – $5
• Backed by powerful fundamentals, strong tech, and serious investors.
AMEX:ARB Analysis:
• Current Price: ~$0.40
• Key Accumulation Zone: $0.40 – $0.30
• Bull Run Targets: $2 – $5
• One of the strongest L2 ecosystems with deep liquidity and solid fundamentals.
Both are technically oversold, fundamentally strong, and positioned for major upside in the coming altseason.
Question for the community:
Which one hits $2 first — PSX:POL or AMEX:ARB ?
Drop your pick below 👇
NFA & DYOR
POL At Critical Fib Level, Targeting 0.28 With 16% GainHello✌
Let’s analyze Polygon’s upcoming price potential 📈.
BINANCE:POLUSDT is currently testing a crucial daily support level that aligns with a significant Fibonacci retracement zone 📉. This area could provide a strong foundation for a bounce. If the support holds, a move toward 0.28 is likely, offering approximately 16% upside potential 📈.
✨We put love into every post!
Your support inspires us 💛 Drop a comment we’d love to hear from you! Thanks, Mad Whale

POLUSDT 1D AnalysisPOL ~ 1D Analysis
#POL This coin is currently at its lowest support. Buy if you still have confidence in this coin with a short term target of at least 15%+ from this support.

Polygon, Higher Low? Easy 1,000% Profits PotentialFour weeks red! Do you really believe the market will continue moving lower? If the answer is yes; think twice, stop! Think again.
Four weeks red is all that you will get you bearish bastard.
Your time is over. We are taking over, the bulls are entering the game.
You had your fun, you had it for a few days.
You can't have it anymore, I am calling my friends.
Friends, look at Polygon (POLUSDT), the chart looks great.
Whenever there is a retrace within a bull market, this is an opportunity to enter again.
Great timing, great prices; the start of a new bullish wave.
Prices are about to grow... Everything is about to grow... Crypto is going up. Are you in or are you out? Did you miss the initial bullish breakout? That's ok. The next bullish wave will 4-6 times bigger than the previous one for this pair. Sometimes even more. Here we have 1,000% profits potential as an easy target.
Get ready and be sure to be prepared.
Start buying like the world is about to end. Why?
Because there will be so much growth in the coming days, that you want to profit all the way. To profit you need to be in, you have to buy when prices are low.
You cannot wait for the green candle, the best time is now.
Thanks a lot for your continued support.
Namaste.

POLUSDT 1D Analysis POL ~ 1D Analysis
#POL Buy gradually from here if you still have confidence in this coin with a short term target of at least 15%++ from here.

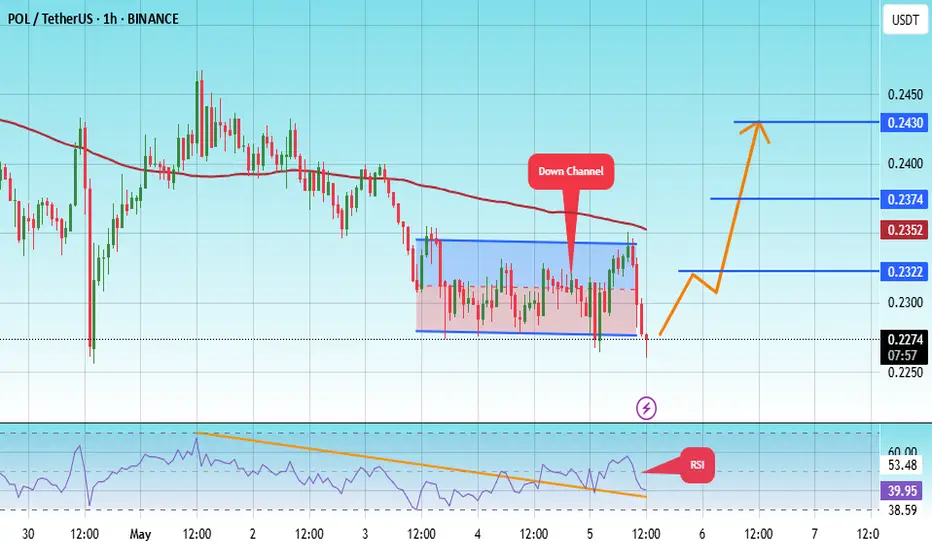
#POL/USDT#POL
The price is moving within a descending channel on the 1-hour frame, adhering well to it, and is on its way to breaking it strongly upwards and retesting it.
We are seeing a rebound from the lower boundary of the descending channel, which is support at 2270.
We have a downtrend on the RSI indicator that is about to break and retest, supporting the upward trend.
We are looking for stability above the 100 moving average.
Entry price: 0.2270
First target: 0.2322
Second target: 0.2374
Third target: 0.2430
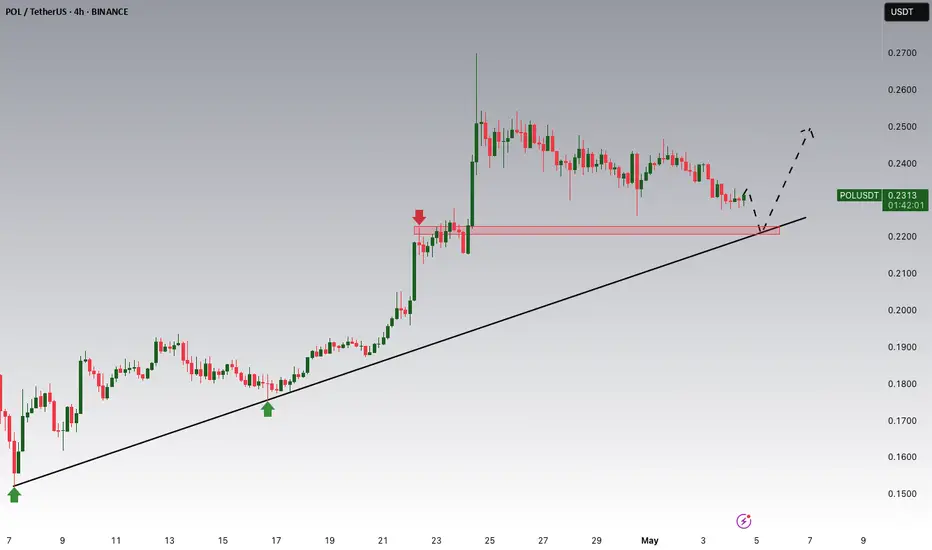
POLUSDT Potential UpsidesHey Traders, in today's trading session we are monitoring POLUSDT for a buying opportunity around 0.2220 zone, POLUSDT is trading in an uptrend and currently is in a correction phase in which it is approaching the trend at 0.2220 support and resistance area.
Trade safe, Joe.
Polygon Ecosystem Token Last Chance, It Is Not Too LateLet's close the day with a classic —RSI bullish divergence.
Polygon Ecosystem Token (POL) has been moving lower and hit bottom on the 7th of April. It's RSI on the other hand isn't doing the same, it bottomed in early July 2024. While POLUSDT went on to produce lower lows, its 3D RSI has been doing higher lows. This is a very strong bullish divergence and also a classic reversal signal.
This signal coupled with volume and marketwide action confirms that the bottom is in.
This pair is going through a pause now, a small one, before additional-huge growth.
The market is giving us one last chance to buy all we want before massive growth.
When the next move starts, there will never be a chance to buy at prices like we have now today. This is good. Cryptocurrency will evolve and the entire world will benefit.
This is a friendly reminder.
Time to work. Wake up!
It is not too late.
Namaste.

#POL/USDT#POL
The price is moving within a descending channel on the 1-hour frame, adhering well to it, and is heading for a strong breakout and retest.
We are experiencing a rebound from the lower boundary of the descending channel, which is support at 0.2400.
We are experiencing a downtrend on the RSI indicator, which is about to break and retest, supporting the upward trend.
We are looking for stability above the 100 moving average.
Entry price: 0.2480
First target: 2565
Second target: 0.2645
Third target: 0.2734

POLUSDT 1D AnalysisPOL ~ 1D Analysis
#POL Buy gradually from here if you still have a Conviction on this coin with a short -term target of at least 15%+ from here.
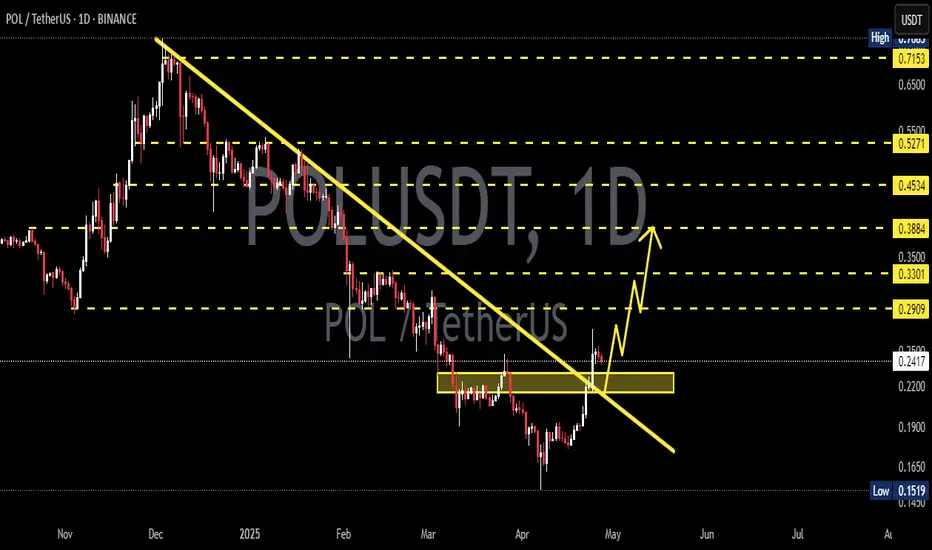
POL is breakout out of the descending wedge upper trend line.POLYGON is now trading outside the upper trendline of the descending wedge pattern and may be preparing for a substantial move in the month of May.
Good luck, and always use a stop-loss!

MATIC/POL buyers beware; bearish signals in the mid-term (1W)The MATIC/POL pair has been dropping for over 1200 days from its peak price, but the structure suggests that a new bullish pattern may have started from the point where we placed the red arrow on the chart.
We’ve marked a supply zone on the chart that could reject the price downwards.
The minimum expectation is for the price to drop to TP1.
The best buying zone for MATIC/POL is the green zone at the bottom of the chart, which could push the price upwards by more than 500%. In fact, it is expected that wave A of the bearish pattern or X wave will end in this area, and the price will enter a mid-term or even long-term bullish phase.
A weekly candle closing above the invalidation level will invalidate this analysis.
For risk management, please don't forget stop loss and capital management
When we reach the first target, save some profit and then change the stop to entry
Comment if you have any questions
Thank You

Polygon Ecosystem 4,300% Potential @10XHere we have several signals related to the candles low and close.
We've been looking at Polygon (POLUSDT) for a long while now and this is a great example of 'patience is key.' Definitely mandatory to have patience. It takes time for the bullish wave to unravel because we are always early, but once the action starts it cannot be stopped. We have the blessing of being able to be around right at the bottom, with plenty of time to plan, buy-up and accumulate. Many people won't be as lucky, they will hear/learn/know about the market only when it is too late or when the bullish wave is halfway.
The last candle closed as a hammer with the highest volume ever. The session low is a higher low compared to the 3-Feb session. A hammer is a reversal signal when it comes at the end of a trend. The high buy-volume confirms the hammer as a bullish reversal signal. Normally, 1-2 weeks are needed for confirmation but we know that will happen next. I don't wait.
The close this week (last week) ended up being higher than the late October 2024 market low. This is another important signal. Twice POLUSDT wicked lower in February, but closed above this level. This level is marked with a purple line on the chart.
As a friendly tip. We are active with high leverage on this pair.
The chart is ready, the market is ready and timing is great.
430% potential with 10X can lead to 4,300%. This is possible and do-able. There will be more of course. Opportunities abound in this market. Crypto is going up. Buy and hold.
Thank you for reading.
Namaste.

Forever Crash? The Truth About Polygon's Ecosystem Token (POL) Remember Cardano last year?
Remember how Cardano became weak during the second part of 2024 and continued to be weak for so long? How did it all end? It ended with a very strong bullish wave.
After the bearish phase, Cardano ended up being one of the strongest moving pairs.
The same can happen in this upcoming cycle with POLUSDT.
The following is also true for Notcoin (NOT).
The lower it goes, the stronger it grows when the time is right.
This pair right now is bleeding massively but this shouldn't be a cause for concern. The market moves in cycles and within these cycles we have waves.
A bearish wave is followed by a bullish wave.
A bullish wave is followed by a bearish wave.
The positive side of a bearish phase is the fact that you can't have a forever down-wave. If it is bearish now, it will turn bullish next.
The last peak was hit in early December 2024, more than two months ago.
A Cryptocurrency trading pair, within a bull-market year, can go bearish for 2-3 months, not more. This means that POLUSDT is getting very close to producing a reversal, very close to a change of trend.
The market has been going down. We saw some bullish action but this action wasn't a bullish trend. It was simply a "bounce" within the broader decline, here starting March 2024.
The great news is that the next rise won't be a bump, it will be an uptrend and an uptrend produces higher highs and higher lows. We are set to experience long-term growth.
Right now it might be hard, but patience is key.
The market can be red, shy and weak now, but everything will change within weeks.
Believe it or not, the time to buy is now.
We are in the accumulation phase.
When the first move starts, it will be too late for low prices; there will be opportunities to enter and to enjoy massive growth. But only those with a vision can buy and accumulate when prices are low.
It will be a life changing bull-market.
It will be the biggest bull-market in the history of the Altcoins.
Bitcoin will be really strong but standard.
The Altcoins will blow-UP.
Namaste.

MATIC returning to equilibrium would be a 128% gain from here!MATIC is looking extremely undervalued at current levels. The price has pulled back considerably since the "Trump election pump" and is forming a nice wedge on the 4-hour chart, which is currently on a four-count. A price move back to equilibrium from the wedge's bottom trendline would, by itself, result in approximately a 128% gain.
Longer term, if the price breaks out of the monthly chart wedge pattern (see comments below for the chart), which is also currently trading at a four-count, we could see some incredible price appreciation over the next 6 to 9 months.
Good luck, and always use a stop-loss!

Polygon is ready to take off!Hi fellow traders, POLUSDT is ready to make a move higher after completing the complex correction in WXY formation. Target the 0.8414 level. Good luck and trade safe!

POL/USDT Trading ScenarioIn November, POL showed confident growth driven by euphoria following the U.S. presidential election results. The asset's price surged from $0.2852 to $0.7705, marking a gain of over 160%. However, profit-taking by market participants soon followed, resulting in a correction that now exceeds 46%.
Currently, seller activity appears to be waning, with a support level forming at $0.4104, from which the price has rebounded twice. Volume profile analysis indicates that POL has stabilized within a zone of market interest.
Further declines may occur as liquidity from short-term players is absorbed, potentially setting the stage for a trend reversal. The recovery dynamics and subsequent growth of the asset are largely influenced by U.S. macroeconomic indicators. Special attention is being paid to the Federal Reserve's decisions on adjusting the key interest rate, which are revised based on current data.

POLUSDT Elliott Waves AnalysisHello friends.
Please support my work by clicking the LIKE button👍(If you liked).
Everything on the chart.
Entry zone: market and lower
Targets: 1 - 1.4 - 2
after first target reached move ur stop to breakeven
Stop: ~0.3 (depending of ur risk).
RR: 1 to 10
ALWAYS follow ur RM
risk is justified
It's not financial advice.
DYOR!

TradeCityPro | MATIC(POL) Fresh Look at MATIC During Christmas👋 Welcome to TradeCityPro Channel!
Let’s analyze POL, formerly known as MATIC, due to your frequent requests. 😊
🌐 Overview Bitcoin
Before starting, let’s take a look at Bitcoin. In the 1-hour timeframe, it is currently fluctuating below the 98807 resistance. This resistance has been tested multiple times, indicating a high probability of breaking through.
It seems likely that Bitcoin dominance will increase along with this potential upward movement. Therefore, it might be better to either
Open a position on Bitcoin itself, Look for altcoins that show a bullish trend against Bitcoin and take triggers to open positions, Just make sure to watch out for Bitcoin’s low volume.
📅 Weekly Timeframe
MATIC, which once ranked well in the market, is now underperforming. The repeated blockchain hacks have caused significant damage to its ecosystem, leading to the rebranding from MATIC to POL.
MATIC could have remained among the top 10 coins, but poor project management caused DeFi activities and TVL to shift to platforms like Solana, SUI, and Base.
Personally, I wouldn’t consider buying MATIC unless its DeFi ecosystem becomes active again. For those interested in purchasing, buying above 0.7629 could be an option, but only if the volume increases for both the coin and its chain.
If you have been holding MATIC for some time, I suggest selling below 0.3636 in the weekly timeframe. On lower timeframes, I can suggest other exit points. Alternatively, you can use DeFi platforms to create USDT liquidity using borrow & lend mechanisms.
Note that MATIC faked the 0.3636 support and rebounded with a bullish engulfing candle, creating a new upward move. Personally, I might become interested in this coin after 1.2457.
🌞 Daily Timeframe
After bouncing from 0.2922, MATIC had a solid upward movement. However, most coins experienced similar trends, so it cannot be said that MATIC outperformed.
If the price doesn’t drop below 0.4738, it can be considered a sign of gradual recovery. This level is significant both from a Dow Theory and Fibonacci perspective. If 0.5794 resistance isn’t broken and the price gets rejected, there is a high probability of losing the 0.4738 support.
I recommend selling your holdings if the 0.4738 level breaks and you have purchased at higher levels. However, if your entry was at 0.3623 or lower, you can continue holding and exit risk-free.
⏰ 4-Hour Timeframe
MATIC is currently stuck below the 0.5316 resistance and fluctuates within the range of 0.4654 to 0.5316.
📈 Long Position Trigger
I would personally avoid this coin due to its low volume. However, after breaking 0.5316, you can open a risky long position if you’re comfortable with the risk. I’d still prefer to long Bitcoin instead.
📉 Short Position Trigger
given the weak condition of this coin, you can consider opening a short position below 0.4654. Keep in mind that your short trades should have quick profit-taking and small stop-losses to exit the market efficiently.
📝 Final Thoughts
Stay calm, trade wisely, and let's capture the market's best opportunities!
This analysis reflects our opinions and is not financial advice.
Share your thoughts in the comments, and don’t forget to share this analysis with your friends! ❤️

Possible scenario for POL for next few monthsHello, looks like we are in a big challenge aren't we?
Not only BINANCE:POLUSDT but also almost every cryptos are dropping hard due to news of the U.S. interest rate cut adjustments.
In last post, I mentioned two possible scenarios, rally or adjustment, and we are in adjustment unfortunately. However, don't jump into conclusion that cryptos are doomed and there will be only a apocalypse. It's too early to say that.
Today, I wanna share my point of view of future scenarios of POL. And I tell you my conclusion first: LONG 📈. Here's the reasons.
=======================================
1) Now the price almost touched 60 days moving average line, and 4 Hours Chart RSI is also in oversell area. This can be as a possible support for a short period.
2) Also, the price is almost near of 0.618 level of Fib. retracement($0.45). In addtion, there were a lot of trading volume in the past, which means also there will be a support. I believe that price will not go down easily through this level.
3) If we consider past 30 days of rally as an eliot impulse wave, I think we are in ABC correction phase. And after that, we can think another rally again.
4) If we look into a chart with weekly period, I think this kind of view is also not quite impossible... but it's just my hope for now.
=======================================
Hope my vision will come true in the future. Don't be so disappointed, fellows! Our life and journey are "long", and so is our chart.

POLUSDT - 1H - Critical point: $0.35 - $1POLUSDT - 1H - Critical point: $0.35 - $1
TRADEX BOT NEWS:
We are continuing to move forward with the development of the CEX autotrading bot. At the moment we are testing it on OKx accounts, but we are working to include other exchanges: binance, coinbase, krakken...
We have also added "all" of the exchange's trading pairs.
This will be the first version of TradeX BoT, which will work as a second layer Order Book in CEX markets, hiding our greed (TP) and fears (SL) from the exchanges.
We will have more news soon!
Thank you!
_______________________________________________________
POLUSDT - 1H - Critical point: $0.35 - $1
We are in the support zone of the current bullish trend. It should be a good support point to boost the price up to $0.98-$1.
On the contrary, if it continues to delve into its current bearish channel, it could lose all interest for the investor and could collapse to $0.34 - $0.35.
__________________________________________________
Automated Cryptocurrency Trading Bots: All these strategic alternatives can be configured with TradeX BoT, since it will allow you to position in both directions without having to block any amount per position. It will only be necessary for the conditions to be met, either downward or upward, for the orders to be executed in one direction or another, taking the necessary deposits from your portfolio.
TradeX BoT (in development): Tool to automate trading strategies designed in TradingView. It works with both indicators and technical drawing tools: parallel channels, trend lines, supports, resistances... It allows you to easily establish SL (%), TP (%), SL Trailing... multiple strategies in different values, simultaneous BUY-SELL orders, conditional orders.
This tool is in the process of development and the BETA will soon be ready for testing.
FOLLOW ME and I will keep you informed of the progress we make.
I share with you my technical analysis assessments on certain values that I follow as part of the strategies I design for my portfolio, but I do not recommend anyone to operate based on these indicators. Inform yourself, educate yourself and build your own strategies when investing. I only hope that my comments help you on your own path :)

pol pol usdt daily analyses
time frame daily
risk rewards ratio > 5 ( incredibly )
look at the chart
this analyse is base on price action and support and resistance
pol has 2 resistance boxes above its price
the weak one ( red ) and the strong one (blue)
pol broke the weak resistance and price came down little and moved up and broke again.
now it pass the first box and will move to strong one.
if pol can break second resistance ( blue ) we will reach our valuable target and 500% benefit
it is not out of reach
