Could we be headed to .90 MATIC/USD (polygon) ?
Polygon's Layer 2 solution is becoming increasingly important for Solana developers seeking to connect with Ethereum's DeFi ecosystem. The fast and cost-effective integration options offered by Polygon are driving greater cross-chain interoperability and connectivity. #Polygon #Solana #Ethereum #DeFi"
Polygon

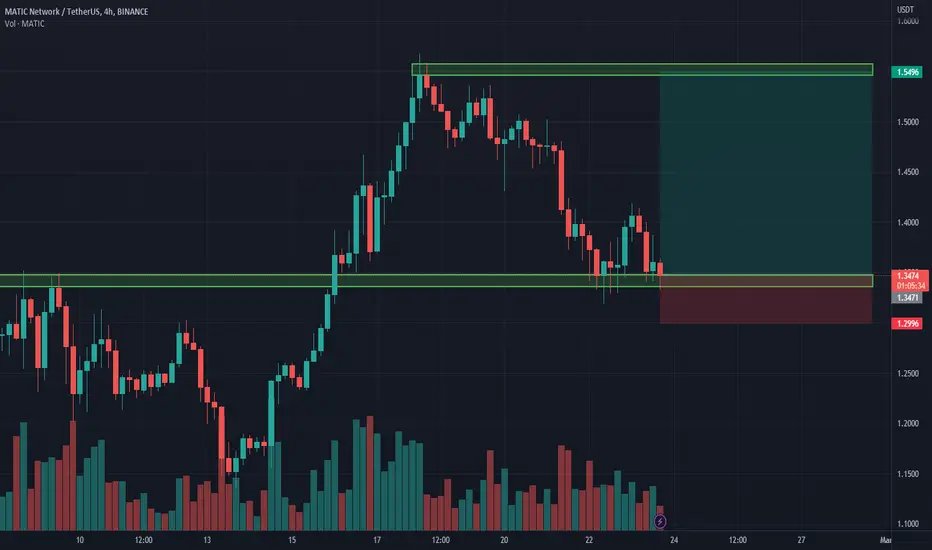
Navigating MATIC's Volatility: Important Support and Resistance Hello and welcome to my technical analysis of the MATIC/USDT trading pair.
Currently, MATIC is trading at $1.27. Based on the chart analysis, it appears that the ascending trendline has broken down, indicating a bearish trend in the short term.
Moreover, the high time frame (HTF) ascending trendline support has turned into resistance, and $1.30 is the current resistance level.
Thus, it would be wise to wait for confirmation before opening any trade.
If the price falls below the recent low of $1.193, then we can expect the price to drop further to around $1
However, if the price breaks upward at $1.35, then we can expect a bullish trend.
It is essential to keep an eye on the support and resistance levels, with the support levels at $1.07 and $0.90 and the resistance levels at $1.35 and $1.52
Additionally, the RSI is not in the overbought area. A good entry point would be when the RSI hits below 30.
In conclusion, it is important to make trading decisions based on confirmation and not blindly.
If you found this analysis useful, please like, share, and follow me for more quality updates.
Thank you.
Regards:-
CryptoPatel

Polygon MATIC in a Bullish Channel
KUCOIN:MATICUSDT is in a bullish channel and about to hit the lower trend line.
After touching the lower trendline, a reversal to the upside is expected.
Keep it simple.

What will happen to MATIC after leaving the $1 penny Crypto areaWhat will happen to MATIC after leaving the $1 penny Crypto area❓
The Renko Chart shows that Polygon is at an important support line🟩
Chances for a bullish breakout confirmation are good IMO🚀
Let me know your thoughts in the comments🤗
⬇️⬇️⬇️
Likes and Follow for updates appreciated🤗
Disclaimer:
Not financial advice
Do your own research before investing
The content shared is for educational purposes only and is my personal opinion

February 25 BTCUSD BingX Chart Analysis and Today's HeadlineBingX’s Bitcoin Chart
Bitcoin is down 3.54% over the last 24 hours and fell to an intraday low of $22,841.19. The largest cryptocurrency was unable to hold above the 20-day exponential moving average ($23,430) today, suggesting the sellers increased the selling pressure. The negative divergence on the relative strength index (RSI) suggests that the bullish momentum is weakening. If the price sustains below the 20-day EMA, bears will likely push the price to the 50-day simple moving average ($22,052).
Today’s Cryptocurrency Headline
Polygon zkEVM to Launch Audit Upgrade Testnet Next Week
Polygon Labs will launch the Polygon zkEVM audit upgrade testnet next week. The audit-upgraded testnet for Polygon zkEVM will be nearly the same as the permissionless, anyone-can-join, no whitelist, real assets, live system with a working prover that launches with Mainnet Beta.After the deployment of the audit upgrade testnet, Polygon zkEVM will also support Etherscan and integrate FFLONK to improve verifier performance.

#Polygon Finds Support at $1.30, Is The Bull Run Over?Past Performance of Polygon
Despite the contraction of the past few days, Polygon is trading above November highs, and looks firm. The coin is up roughly 80 percent from December lows, and trading above the middle BB, signaling strength. Per the current setup, support lies at $1.30.
#Polygon Technical Analysis
The overvaluation of February 18 is being corrected in a move that has seen bears wipe out gains of February 17. Despite the cool-off, the primary trend remains bullish. This will hold especially if MATIC prices are still above $1.30 by the close of this week. After an impressive surge from December 2022 lows, the retracement was expected. The trend will continue if there are fresh gains above $1.60, with expanding volumes. Meanwhile, losses below $1.30 may spark a sell-off, forcing MATIC towards $1.15 and later $0.95, which are critical support lines of the December to February trade range.
What to Expect from #MATIC?
Traders should watch out for the middle BB, the flexible support line. A breakout below this level may set the base for a leg down in an inevitable correction. Specifically, how MATIC reacts at November 2022 high at $1.30 is important in the near term.
Resistance level to watch out for: $1.60
Support level to watch out for: $1.30
Disclaimer: Opinions expressed are not investment advice. Do your research.

ETH Denver ; World’s Largest Hackathon TomorrowThis year at ETHDenver, the world’s largest Ethereum hackathon to ever be held, will begin its “buidl” week tomorrow!
During this time developers who chose to come early and get a shot at using brand new technologies which will be unveiled and highlighted during the subsequent “core” week.
During the “core” week is when the most investors and head-honchos will be there to behold these new inventions and fund the creative teams behind them which will overall improve their own existing brand. There will be many new technologies unveiled and a few key networks will be underlying and helping run the event including zkSync technology from both Ethereum & Polygon.
Testnets are already poised for use and may help point some of you more savvy crypto traders discover what tokens to watch after this launch. Mumbai test net and the zkSync ERA technology will also be used for in-event purchases which will NOT be cheap. Meaning; the activity of both networks will be consistently active and assuredly being watched by those trying to sway the event and boost the new technologies unveiled so I do not foresee them letting an opportunity to “pump during the con” due to legitimately brilliant and useful new features that are sure to be the kicker when it comes to major companies like VISA choosing what protocol to run their blockchain on.
What we have needed to produce a full fledged, autonomous market is literally coming out in the next 12 days. Transaction speed/throughput will see dramatic raise along with ease of use which has been a major problem since day one.
Disclaimer; I know nothing, I am nobody, this is all my opinion and should never ever be considered real or some sort of instructional manual. Do with this info as you will.
As for me? I shall be waiting for the pump (along with major buy/sell action to fill in gaps automatically as we jump) and heading to Denver for the convention on the 3rd!
See you there, Bufficorns!
#bufficorn #ethdenver #eth #ethereum #matic #polygon #zk #zksync #era #denver #tech #investors
www.westword.com
ETH/USDT ; MATIC/USDT ;

ETH/MATIC/ERA/MUMBAI ETHDENVERThis year at ETHDenver, the world’s largest Ethereum hackathon to ever be held, will begin its “buidl” week tomorrow!
During this time developers who chose to come early and get a shot at using brand new technologies which will be unveiled and highlighted during the subsequent “core” week.
During the “core” week is when the most investors and head-honchos will be there to behold these new inventions and fund the creative teams behind them which will overall improve their own existing brand. There will be many new technologies unveiled and a few key networks will be underlying and helping run the event including zkSync technology from both Ethereum & Polygon.
Testnets are already poised for use and may help point some of you more savvy crypto traders discover what tokens to watch after this launch. Mumbai test net and the zkSync ERA technology will also be used for in-event purchases which will NOT be cheap. Meaning; the activity of both networks will be consistently active and assuredly being watched by those trying to sway the event and boost the new technologies unveiled so I do not foresee them letting an opportunity to “pump during the con” due to legitimately brilliant and useful new features that are sure to be the kicker when it comes to major companies like VISA choosing what protocol to run their blockchain on.
What we have needed to produce a full fledged, autonomous market is literally coming out in the next 12 days. Transaction speed/throughput will see dramatic raise along with ease of use which has been a major problem since day one.
Disclaimer; I know nothing, I am nobody, this is all my opinion and should never ever be considered real or some sort of instructional manual. Do with this info as you will.
As for me? I shall be waiting for the pump (along with major buy/sell action to fill in gaps automatically as we jump) and heading to Denver for the convention on the 3rd!
See you there, Bufficorns!
#bufficorn #ethdenver #eth #ethereum #matic #polygon #zk #zksync #era #denver #tech #investors
www.westword.com
ETH/USDT ; MATIC/USDT ;

long MATIC$MATIC is bouncing off the support level. Bullish movement to the resistance level at 1.54$ is likely to happen.
Continued BEAR thoughts on #MATIC
Continued BEAR movement to the area of 1.25 is seeming certain now! Calling it!

MATICUSDT, key zones to watch and next move. UpdateHello guys, This is an update of previous analysis (blow link). Everything is explained on the chart for you like always. The price is currently moving as we expected and finally broke its major resistance and retesting that to change it to a support base band then continue to reach the second target. The targets will be 1.6 and 1.7 .
Good luck.
If you like the idea, do not forget to support with a like and follow me for next analysis :)
Write your comment and opinion below to me

$Matic - End of PUMP Era - Retest $0.3Matic printing BEAR FLAG pattern just like $BTC did Jan-Apr 2022 (TERRA LUNA COLLAPSE)
POLYGON had already gone through big announcements and finally Sell the HYPE?
And ARBITRUM taking the edge over POLYGON
Complacency Phase. Expecting New All Time Low

MATIC headed down to 1.20's?
I believe we will see some bears win for awhile until the better news of hiring or a next project comes out.

🔥MATIC IS GOING TO MAKE +120%, BUT ONLY AFTER THIS!🔥 Hi friends! MATIC looks much stronger than other altcoins because it's a strong fundamental project.
📊 THE TRADING PLAN FOR MATIC:
1. pullback to $1.3 key level (is a must-have) and test it or the false breakout (much better)
2. volume growth. As you can see, it always grows at the bottom
3. bullish BTC
🚩 It's essential to see the huge buy orders of the whales on DOM and Footprint. I use these scalping tools to track the big guys on crypto market and make a profit with them.
✅ THE LONG TARGETS FOR MATIC:
🔥 $2.1 - the ley level
🔥 $2.45 - the key level, local highs
🔥 $2.92 - the key level, ATH
If the price makes another 100%, it become #6 or #7 in the capitalization list (now #9), overtake XRP and reach $25B cap. Possibly, it can renew it's ATH if BTC reach $32-35k.
Traders, this is a scenario where I will open my longs, but it can go straight to the first target, because it's so strong.
💻Friends, press the "boost"🚀 button, write comments and share with your friends - it will be the best THANK YOU.
P.S. Personally, I open an entry if the price shows it according to my strategy.
Always do your analysis before making a trade.

🔥MATIC IS A MOST STRONGEST ALTCOIN: +20% IS ONLY FIRST TARGET🔥 Hi friends! Matic fell well and very bullish altcoin unlike Cardano and many other weak altcoins. In this idea, I will explain my point of view and the most possible scenario for Polygon.
Now we see how the price makes a pullback after the test of the value area of $0.89-0.94 as the resistance. Matic fell to the key level of $0.76 and this is a key area where we should open a long.
📊 PRECONDITIONS TO OPEN A LONG ON MATIC:
1. false breakout of the key level of $0.76
2. volume growth
3. bullish BTC
✅ THE LONG TARGETS FOR MATIC:
🔥 $0.89-0.94 - closest value area and strong resistance
🔥 $1 - key level and even number
🔥 $1.3 - local highs and key level
🚩 Take a look at the chart and previous value areas tests. It became the strong resistance so often, so if MATIC makes a false breakout after reaching it, I recommend you to close the whole trade and pull the sl to breakeven. Also, you can try to open a short but only if you will see that BTC will become bearish soon.
Traders, what is your opinion on MATIC? Do you hold this coin as a long-term investment? Let me know in the comments!
💻Friends, press the "boost"🚀 button, write comments and share with your friends - it will be the best THANK YOU.
P.S. Personally, I open an entry if the price shows it according to my strategy.
Always do your analysis before making a trade.


MATIC looks bearishHello, everyone!
Let's take a look at the BINANCE:MATICUSDT chart. After the huge downside impulse price is printing the clear upward sloping trend channel. We can also notice that it formed the deviation below this channel. It was the fake breakdown to stimulate traders open short trades.
In such cases price usually tends to create the same deviation to the upside. It could perfectly coincides with the supply zone above. Therefore I expect the MATIC price a little bit higher at $1.8 and crash after that.
Best regards, Ivan
________________________________________________________________________________________________
If you like my trade ideas, please smash the boost button to stimulate me make more quality analytics!

MATIC trade setup The idea is: Buy when the price breaks above 1.535$ and take profits at the levels shown in the chart.
Targets:
1. 1.56$
2. 1.62$
3. 1.68$
-------------------------------------------
What's a Fair Value Gap (FVG) ?:
A fair value gap is the difference between a financial instrument's theoretical value and market value, such as a derivative or security. It can indicate a misprizing opportunity for traders to profit by buying or selling at the misprized level. In other words, there is a gap in the price in which some open orders still need to be filled. The price will return to fill the orders.
-------------------------------------------
What are triangles when it comes to trading?
Key points:
"1. In technical analysis , a triangle is a continuation pattern on a chart that forms a triangle-like shape.
2. Triangles are similar to wedges and pennants and can be either a continuation pattern if validated or a powerful reversal pattern in the event of failure.
3. three potential triangle variations can develop as price action carves out a holding pattern, namely ascending, descending, and symmetrical triangles."
-------------------------------------------
If you like the content, then make sure to comment and like the post :D
Follow me for daily profitable trading setups.
BTC dictates the market. If BTC falls, then Alts will drop as well. Trade safe!

Polygon MATIC price will double or halve its value in few monthFinally, altcoins have started their upward movement, most of the ideas we have published on different coins over the past 2–3 weeks are in the process of working out the targets.
But the MATICUSDT price did not grow much on the crypto market in the last few days. In fact, the MATIC price was one of the first to break out of the downward trend in the summer of 2022 and has been in a protracted consolidation since then.
The way out of such consolidation will be a powerful impulse movement that will double the value of the Polygon token or halve it.
Therefore, it is very important to monitor the behavior of the MATICUSDT price around $0.75.
Another holding of the price above this level will increase the chance of starting growth to $1.50 per MATIC
However, if sellers can easily push and fix the price below $0.70-0.75, then this will be a signal that keeping MATIC in your portfolio may be unprofitable. After all, because of such conditions, an almost unobstructed path will open for the price to fall to 0.44
_____________________
Did you like our analysis? Leave a comment, like, and follow to get more

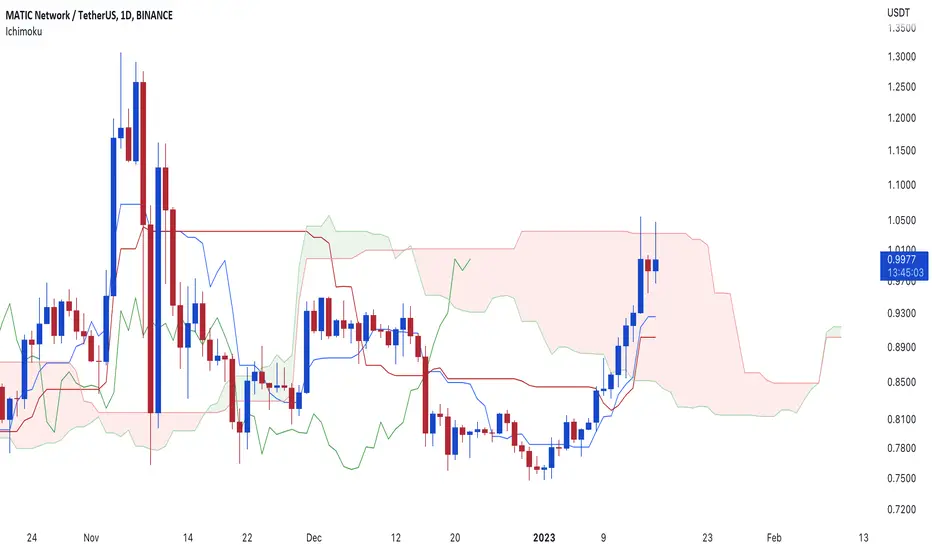
Ichimoku Analysis MATICClosing above 1.035 could get us to 50% Profit in it. There is a bullish kumo crossover already.
MATIC BREAKOUT! Wait for Retest?MATIC has broken out of its long-term resistance in 1.3 USD, and is heading towards 2 USD zone as the next resistance.
The safer plan for now is to wait for a retest on resistance-turned-support (1.3)
We shall look for a bullish candle there to go for a long position/buy
However, if fails (no bullish candle and/or the support is broken, we may see an opportunity to 0.9 even 0.75 area

Matic $1.60 follow uplook at previous post, Almost there, DogElonMars just pumped 23%, just need a bit more for the inverted head and shoulders target of $1.60!
pull back after and or consolidate

✴️ MATIC Network (Polygon) Update (70% More & Then More!)After 6 weeks of growth, 6 weeks closing green... The seventh week becomes even stronger and produces more growth than any of the previous weeks.
Notice here the "low volume".
I always mention how low volume when considered in context to the broader market experience can give a completely different signal than a bearish one.
Volume is low as prices grow strong, this means that the real growth is yet to come.
We will see even more action, more growth, based on this volume signal and the weekly candles of course.
This is the same chart I published weeks ago... Just an update!
Previous charts:
27-Jan. ✴️ Polygon Growing 144% Is Only The Beginning
2-Feb. ✴️ MATICUSDT | Polygon, New Entry (Name Your Altcoin #2 ✅)
Thanks for the support.
Namaste.
