Polygon (MATIC) - November 26Hello?
Traders, welcome.
If you "Follow", you can always get new information quickly.
Please also click "Boost".
Have a good day.
-------------------------------------
(MATICBTC 1W chart)
It is showing a tendency to decline from the high point range of 0.0000 5049 to 0.0000 5393.
If there is a sharp downtrend when it drops below 0.0000 5049, there is a possibility that it will touch the next support range, 0.0000 2954 ~ 0.0000 3337.
However, we must not forget that it has an upward force until it falls below 0.0000 2954.
--------------------------------------
(MATICUSDT 1W chart)
The 0.6164-0.8191 interval is the one that determines the trend.
Therefore, it is important to be able to climb with support in this section.
If it fails to get support, if it falls below 0.5590, it is likely to take a plunge, so be careful.
(1D chart)
The question is whether the price can sustain itself by moving up to or above the 0.8883-0.9486 range.
If not, you should check for support in the 0.6164-0.8191 interval.
A rise to the 0.8883-0.9486 zone is expected to lead to a move towards the 1.0813 area.
-------------------------------------------------- -------------------------------------------
** All descriptions are for reference only and do not guarantee profit or loss in investment.
** If you share this chart, you can use the indicators normally.
** The MRHAB-T indicator includes indicators that indicate points of support and resistance.
** SR_R_C indicators are displayed as StochRSI (line), RSI (columns), and CCI (bgcolor).
** The CCI indicator is displayed in the overbought section (CCI > +100) and oversold section (CCI < -100).
(Short-term Stop Loss can be said to be a point where profit or loss can be preserved or additional entry can be made by split trading. This is a short-term investment perspective.)
---------------------------------
Polygon

#MATIC/USDT Trade Setup 54% Potential Pump. RR 1:9Welcome to this quick trade setup, everyone!
Recent trades posted:-
1. BTC /USDT (Running in Profit)
2. ETH/USDT (Running in Profit)
3. CHZ/USDT (In Accumulation)
4. CHR/USDT (Running in Profit)
5. MATIC/USDT (In Accumulation)
Entry:- $0.8075 TO $0.8611
(6.22% is the accumulation range from CMP so plan your entry accordingly)
Stop Loss:- $0.7576
Recommended Leverage:- 3x- 5x
Target:- Open (Possibly 35% to 54%)
RR 1:9 (Highly Lucrative)
This is not financial advice. Always DYOR.
These are my trades.
Do not cry in the comments if you can't afford the Stop Loss or go for 125x gambling.
I am ready to take the SL if it gets hit.
Trade only if you can afford the SL.
Do the maths before you enter the trades and manage your risks properly.
Fund preservation is our foremost priority.
If you like me to post more please share this idea with your friends and communities and hit the like button.
I have been with you in the bullish days and the bearish days.
We are going to have an amazing bull run for sure.
Cheers!
Thank you
#PEACE

Trading opportunity for MATICUSDT PolygonBased on technical factors there is a Buy position in :
📊 MATICUSDT Polygon
🔵 Buy Now 0.8477
🧯 Stop loss 0.7908
🏹 Target 1 0.8990
🏹 Target 2 0.9900
🏹 Target 3 1.1440
💸RISK : 1%
We hope it is profitable for you ❤️
Please support our activity with your likes👍 and comments📝

long MATIC$MATIC bounced off the support level and broke through the descending trendline. Bullish movement to resistance level at 0,9698$ is likely to happen.

MATIC: Opportunity to AccumulateMATIC back down at range support with re-emerging supply volume is a good indicator of further pullbacks. If it revitalizes and heads back up to TRM (range midpoint), beware of jumping back into another bull trap. Money can be made riding traps, but you better know when to get out. Let the supper supply block be a guidepost. Otherwise, count on more retracements, ultimately down to the 1.618% where the PA mitigates the previous low and thus zeros out that macro liquidity void. Be safe, be prosperous! Note: I uploaded an analysis vid on this very chart to YT. Check it out for a more thorough breakdown.
Do you like winning trades and making easy money? Be sure to SUBSCRIBE for more clean, accurate, easy-to-follow swing charts with exceptionally high win ratios (80-85% average)!
Not financial advice. Always DYOR and trade at your own risk.

Next entry for Polygon (MATIC)I believe that price could temporarily break out of the triangle and make a bear trap at the 0.5 ~ 0.382 Fibonacci retracement.
The MATIC token is one of those that appreciated above average considering this bear market.
The DMI SMI indicator also signals this possible opportune moment to buy

Done Get outta DOGE quite yet...Let this triangle fill out. Waiting on more confirmation on the daily and will enter long. Lots of smart money up high..

Are we going to see wave E?Are we going to see wave E? We have seen an impulsive recovery from 0.76, which made me think about E wave which should be diveded into 3 waves of ABC. As shown, I belive A wave has been done, then corrective B, and we should now be in the last C wave. It should divide into 5 implusive waves of which first has finished. We are now moving in a specific range which may be corrective after which i expect impulsive move upside. If we stay by the rules, C wave should extend minimum 100% of A wave, with the possibility of extending to 1.618 or even more. There is a chnace of one more higher high around 1.32 - 1.47 which would be the end of the corrective ABCDE rising wedge and as a result we should expect impulsive decline in price towards 0.3. Despite all the negativity, polygon is fighting hard and keeping its price at reasonable levels but that shouldnt last long. On the other hand, we should be careful of the position we take. If we dont manage to break above 1.15, 0.72 is the first support i expect it to visit.

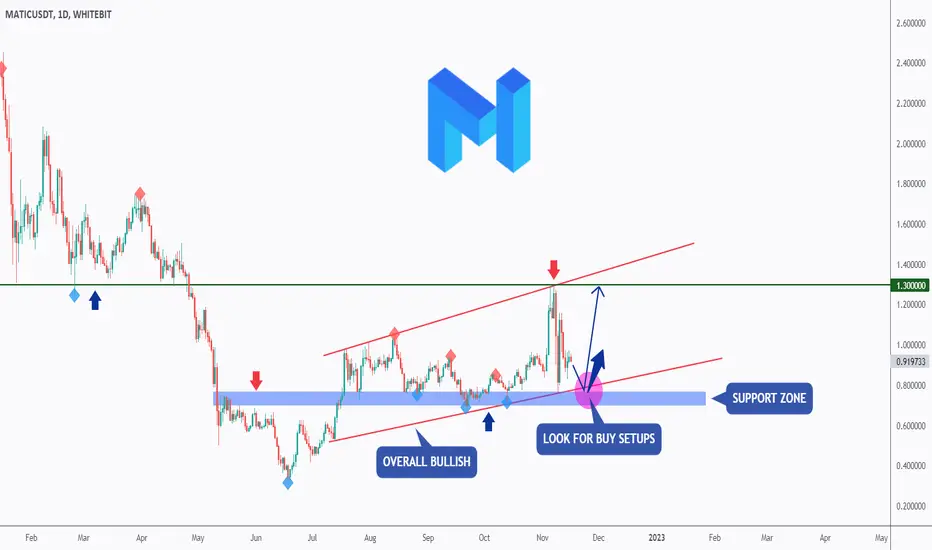
MATIC - Standing Strong!Hello TradingView Family / Fellow Traders. This is Richard, as known as theSignalyst.
MATIC is overall bullish trading inside the red channel and now approaching the lower trendline.
Moreover, the blue zone around 0.7 is a strong support zone .
So the highlighted purple circle is a strong area to look for buy setups as it is the intersection of the blue support zone and lower red trendline. (acting as non-horizontal support)
As per my trading style:
As MATIC approaches the purple circle zone, I will be looking for bullish reversal setups (like a double bottom pattern, trendline break , and so on...)
Always follow your trading plan regarding entry, risk management, and trade management.
Good luck!
All Strategies Are Good; If Managed Properly!
~Rich
🚀MATIC is in the falling wedge! +233% is a technical target✅Hi friends! MATIC is in the falling wadge. Due to the technical rules the targets for MATIC is $2-2.4 if the pattern will be compited.
Take a look on the chart. The MATIC is among the strongest altcoins. Matic make +233% after the fall to it`s bottom. I think that it can also reach my 2 targets for it very easilly. But first of all you should understand where to open a trade.
📊 Preconditions to open a long:
🔥 liquidity collection below the key level of $0.729. By the way it`s already happen
🔥 squeeze to the upper boundary of the wedge
🔥 bullish BTC pull all the altcoins to their targets
🚩 If BTC will go down, you have additionall plan to short on the chart.The value area of $0.57-0.61 should become the support. Remeber about the volumes.
✅ Also i recommend you to check out this idea about BTC and plan for this month. A lot of usefull indformations and stats for the traders.
📊 Me targets for MATIC:
1. $1.05 - the key level
2. $1.35-1.41 - the value area and mid target
🚩 I marked for you the closest strong resistance on the chart. The 50% of profit have to be booked when the price reach these targets.
💻Friends, press the "boost"🚀 button, write comments and share with your friends - it will be the best THANK YOU.
P.S. Personally, I open an entry if the price shows it according to my strategy.
Always do your analysis before making a trade

🔥🚀IS MATIC THE NEXT GAINER AS TWT or DOGE❓I got +65% profit❗🔥Hi friends! MATIC hadn't fall as much as any other altcoins during the dump. It shows for us the pressence of buyer on MATIC. The main things that we need now is to find the best entry point with max RR and short sl.
🚩 Friends, MATIC is already make +65% from my entry point and make reach 1st target and almost touch the 2nd. I'm sure, that MATIC would be reach this target, if not the FTX crash. Congratulations to everyone who open this trade. Even now you in +10% of profit.
✅ A lot of traders were liquidated as well as stop-losses were triggered. The volume growth confirm it for us. Additionally we see gow the HUGE value area of $0.87-0.95 become the support.So now we can expect the pullback and it's can be just the beginning of the huge move.
📊 My main preconditions to open a long:
1. continue to consolidate inside the inportant value area of $0.87-0.95
2. squeeze to the trendline
3. bullish BTC or at least consolidation in the range
🚩 I have very usefull trading tools such DOM and Footprint which helps me to open a trades with the whales. This indicators show the biggest orders which related to the biggers buyers or sellers. So this tools easilly add to your winrate 25-35%, because the biggest players are usually buy or sell at the best price.
📊 The main 3 targest for MATIC:
🔥 $1.13-1.16 - the closest value area+local target
🔥 $1.5 - the key level and ipmortant resistance
🔥 $1.75 - the key level
🚩 The worts scenario will be the renew of lows at $0.82 and test the $0.87-0.95 value area s the resistance. The price will go lower with high possibility. So it's another thrade that you can open.
✅ Traders, remeber to book the profit by parts. As you can see, the any bad news now dumped the price so much and your profotable position can easilly return at breakeven🔥
💻Friends, press the "boost"🚀 button, write comments and share with your friends - it will be the best THANK YOU.
P.S. Personally, I open an entry if the price shows it according to my strategy.
Always do your analysis before making a trade.

Polygon (MATIC) - November 13Hello?
Welcome, traders.
By "following", you can always get new information quickly.
Please also click "Boost".
Have a good day.
-------------------------------------
(MATICBTC 1W chart)
Maintaining the price in the range of 0.0000 5049 to 0.0000 5393 or higher is expected to lead to a move to renew ATH.
When it falls below 0.0000 5049,
1st support: 0.0000 3910 ~ 0.0000 4415
2nd support: 0.0000 2954 ~ 0.0000 3337
You need to make sure it is supported by
As long as it does not fall below the range of 0.0000 2954 ~ 0.0000 3337, I think that a fall below 0.0000 5049 as a mid- to long-term investment would be a good buy range.
-------------------------------------
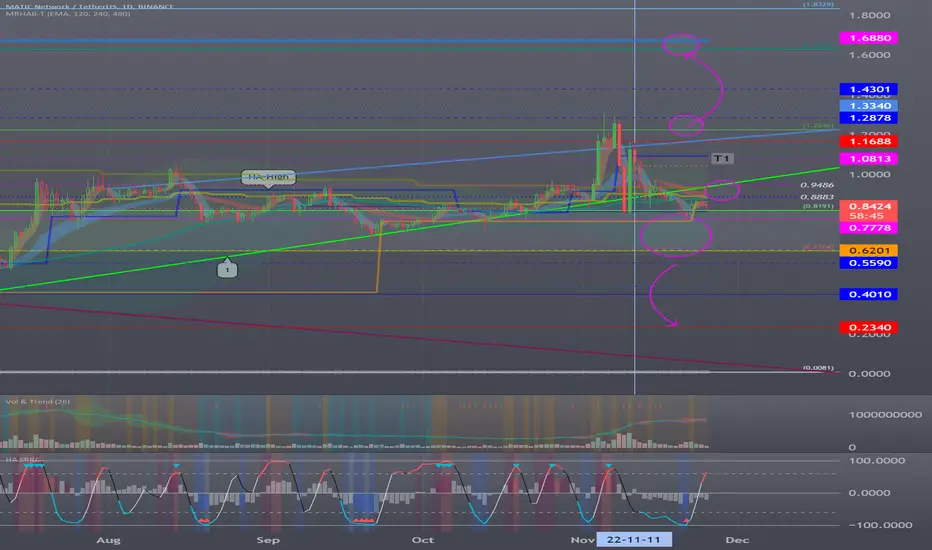
(MATICUSDT 1W Chart)
The key is whether the price can be sustained above 1.2246.
To do that, you need to make sure you can move up along the uptrend line.
(1D chart)
Since the M-Signal line of the 1W chart and the M-Signal line of the 1M chart pass in the 0.8883-0.9486 section, it is important to be supported and rise in this section.
If not, you should check to see if the HA-Low indicator is supported in the 0.6201-0.7778 zone.
As seen in the MATICBTC chart, MATIC is a strong uptrend coin.
Therefore, if it falls to the 0.6164-0.8191 range, those who want to invest in the mid- to long-term will have a good buying opportunity.
This opportunity can cause great losses for some people, so a strategy is needed to reduce the loss and increase the number of coins corresponding to the profit with an appropriate response.
A drop below 0.5590 is likely to result in a sharp move, i.e. large volatility.
Therefore, it is possible to temporarily touch around 0.2340 and move up, so be careful.
------------------------------------------------------------ -------------------------------------------
** All descriptions are for reference only and do not guarantee a profit or loss in investment.
** If you share this chart, you can use the indicators normally.
** The MRHAB-T indicator contains indicators that indicate support and resistance points.
** HA SRRC indicators are expressed as StochRSI(line), RSI(columns), CCI(bgcolor).
** CCI indicator is expressed as overbought range (CCI > +100) and oversold range (CCI < -100).
(Short-term Stop Loss can be said to be a point where profit and loss can be preserved or additional entry can be made through split trading. It is a short-term investment perspective.)
---------------------------------

MATIC/USDT Hello everybody
I have one small idea about matic
In 4h graphic we can see cross RSI and MACD down - so good short opportunity
Don't forget about RS/RW
And have a good day and enjoy ur weekend
Bye

MATICUSD Profit to be made in range as well as break-outs.Polygon (MATICUSD) has been trading within a Channel Up since the June 18 bottom and on November 05 formed its latest Higher High. Since then, it has been highly volatile following the explosive mix of the FTX (bearish) and CPI (bullish) news. This should keep the price volatile and sideways mostly within the bottom (Higher Lows trend-line) of the Channel and the (dashed) Lower Highs trend-line, a sequence that took place from the previous August 14 High until October 17.
A break above the dashed Lower Highs would be bullish towards the 0.382 Fibonacci retracement level while further break, bullish towards the top (Higher Highs) of the Channel Up. Similarly, a break below the Channel Down would be bearish, targeting the previous dashed line.
-------------------------------------------------------------------------------
** Please LIKE 👍, SUBSCRIBE ✅, SHARE 🙌 and COMMENT ✍ if you enjoy this idea! Also share your ideas and charts in the comments section below! This is best way to keep it relevant, support me, keep the content here free and allow the idea to reach as many people as possible. **
-------------------------------------------------------------------------------
You may also TELL ME 🙋♀️🙋♂️ in the comments section which symbol you want me to analyze next and on which time-frame. The one with the most posts will be published tomorrow! 👏🎁
-------------------------------------------------------------------------------
👇 👇 👇 👇 👇 👇
💸💸💸💸💸💸
👇 👇 👇 👇 👇 👇

Ichimoku Analysis for MATICPrice and lagging both above the cloud along with a bullish kumo crossover.

MATIC - Range ReturningMATIC had a beautiful move but I think it is coming to it's end.
Back into the range likely, but that's fine. If it can range some more then potentially consolidate further for another push?
Swept origin of breakdown above in thick line, heavy resistance and will continue to be imo for some time.
Major high time frame market structure break still holding and I want to see it hold.
I provided my full thoughts on my YT channel as well, check it out!
Vatsik

MATIC | Sky is the Limit..!!
#MATIC Broadening Triangle Formation in Weekly TF 🧐
According to Pattern, Expecting New All time High in Coming 2-3 Months.
The SKY is the Limit 🚀🚀
Please like the idea for Support & Subscribe for More ideas like this and share your ideas and charts in Comments Section..!!
Thanks for Your Love & Support..!!

Trading opportunity for MATICUSDT PolygonBased on technical factors there is a Long position in :
📊 MATICUSDT - Polygon
🔵 Long Now 1.1924
🧯 Stop loss 1.0644
🏹 Target 1 1.3629
🏹 Target 2 1.5296
🏹 Target 3 1.7461
💸RISK : 1%
We hope it is profitable for you ❤️
Please support our activity with your likes👍 and comments📝

MATICUSDT Price growth will continue, but under what scenario?Our previous idea MATICUSDT didn't get too many views and likes, but it's a pity...
Just look at how she works beautifully:
Since the publication of our previous idea, at the maximum point, the increase in the MATICUSD price was +90%. The growth was stopped at the border of the trend line, which sellers have been controlling since the end of December 2021, and above it the price does not get yet.
During the growth, the MATICUSDT price quite easily passed upwards the liquidity zone of $0.67-0.81 and is now trying to establish itself above it.
The main question for the coming days: Will the buyers be able to pushing the MATIC price and still break through the purple trend line. Most likely, the point of struggle between buyers and sellers will be around $0.90
According to the results of the battle, it will be clear which of the scenarios will be activated: blue or red?
Safe entry long either after fixing the Polygon Matic price above the purple trend line or after a deep correction in the area of $0.65
If you are having a profitable long position MATICUSDT is great, but be careful when the price goes up to $0.90. And even better, moving up your stop during the growth, so as not to give your profit to the market.
The next goal for growth MATIC price remains valid from the previous idea - $1.10-1.20
_______________________________
Since 2016 , we have been analyzing and trading the cryptocurrency market.
We transform our knowledge, trading moods and experience into ideas. Each "like under the idea" boosts the level of our happiness by 0.05%. If we help you to be calmer and richer — help us to be happier :)

The next resistance is considered in the range of 1.40 to 1.70!MATIC had good price growth during the last week. The price of this currency, as it was in the short-term ascending channel, reached higher targets by breaking the resistance of the $1 range, with more support from buyers and a sharp increase in trading volume, which was the highest price recorded for MATIC in the last five months. The price is $1.15, and a strong reaction has been observed in this area. The price could enter a corrective wave, and the support in the $1-$1.07 range for MATIC could be a reasonable reaction area, at least for the first touch.
Considering that an important resistance has been broken in the weekly time frame if the weekly candle closes above the $1.075 range. If the short-term upward trend of Bitcoin continues, we can expect the continuation of Matic price growth after the price correction. Let's have the following weeks. For this purpose, the next resistance is considered in the range of 1.40 to 1.70 dollars, and the impact of the price in this area can have a heavy reaction. This resistance zone is related to the weekly interval, and the confirmation of its reaction is checked in this interval.

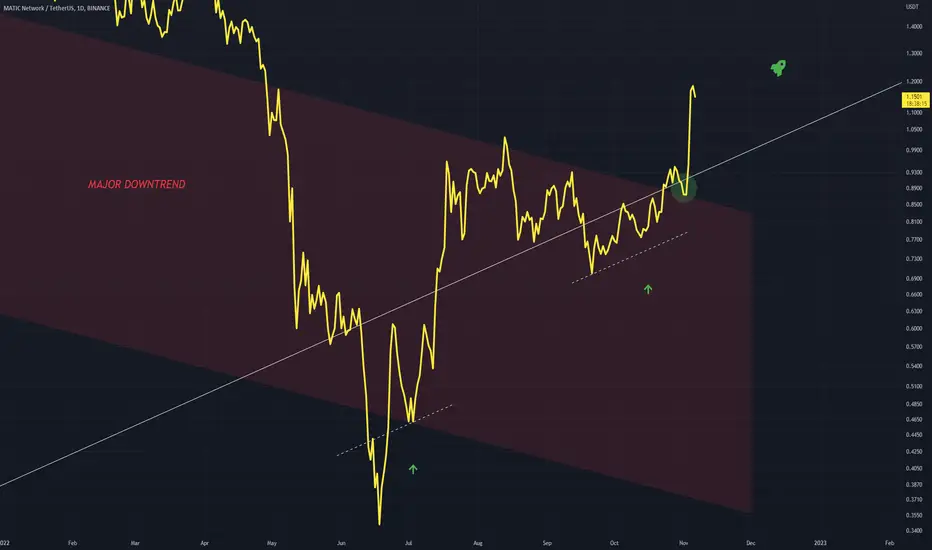
MATICUSD - Major Breakout / ThoughtsMATIC has broken out spectacularly out of a major downtrend in red
This is leading to a new bull cycle that coincides well with a bottom for BTCUSD
MATIC in my eyes is a good choice as recent developments surrounding the NFT area and Reddit is a bull signal
Green circle is the breakout point
MATIC SHORT 1 HOUR TIME FRAMEHello and good morning/night depending on where you are reading this!
We all saw that MATIC pump towards the upside today. But it has barely any support at the top, and it seems that we have established a new resistance line on the 1 hour timeframe: 1.1778 and a new support line at 1.09. It is looking like MATIC is going to consolidate at around the support line. I think MATIC is a great buy this upcoming month but not before it has built more support.
So here is my short trade on MATIC:
ENTRY: 1.1600
TP1: 1.13
TP2: 1.10
TP3: 1.06
Do not take this as financial advice, I'm just sharing my thoughts on it. What do you guys think as I am always looking for input! If you found this useful please consider liking :)
Have a great day rest of your day :)
- The Stallion
