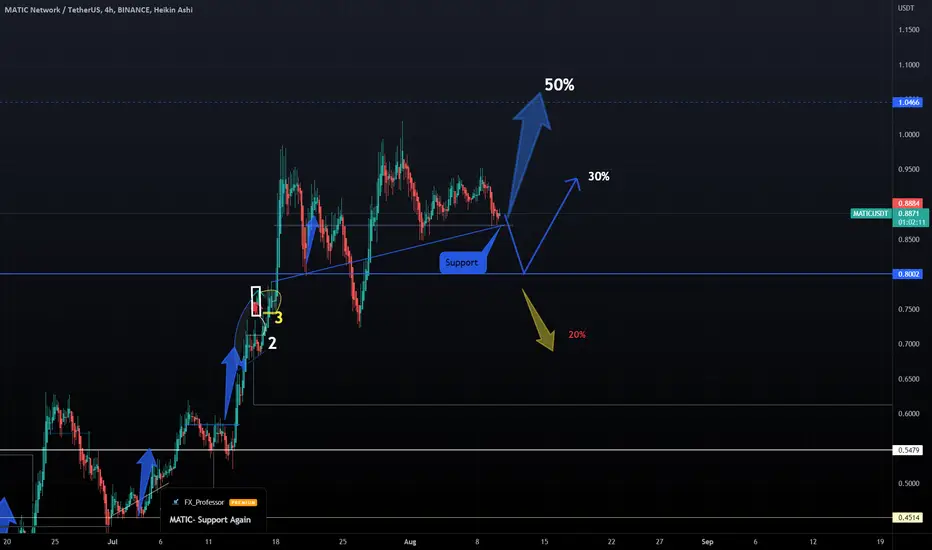
MATIC- From 30c to 80c (Reloaded) To 1,20$MATIC under 80cents?
Only for a little while and probably off to 1$ and eventually 1,20$ target.
We been Long since 30c we remain Long till 1,20 and every dip is opportunity. Given that you stayed alive.
One Love,
the FXPROFESSOR
Polygon

MATIC: decision pointI'm currently shorting ZEC but I got this alert I've set on MATIC weeks ago. After that "revival pattern" broke out it went +57%, I probably didn't enter back then because I noticed it too late and being in "bearish mode" I don't trust longing.
I had set an alert on price crossing EMA 200 and that happened today but price is already below it. If this would breakout EMA 200 it'd be worth to long, assuming off course that volume would be able to sustain the growth. If instead, as I think, EMA will work as resistance we might have a good shorting opportunities.
Market should be already dumping, it's going up only because ETH merge is rising the hype. Currently it's BTC which is following ETH. I think ETH will retrace now after having touched 2K and so market will shift back on BTC leading or dump directly. From this point of view MATIC it's closer to a short opportunity rather than a long. Also notice the bearish DIVs currently forming.
I'll monitor it until I'm in this another short and until I'm not sure it's going down. No trading indication... for now!


BITCOIN : H1 : UPDATEHello friends
. Based on our previous analysis, two scenarios and the price moved based on the downward scenario and hit our target
.Now the price is at the support level, we have two scenarios. Our first scenario is a price correction and our second scenario is an upward movement and a touch of 25,000
.continuation of the price correction based on the chart
. Please follow your strategy, , this is just my idea
.🙌Please do not forget the ' like' button & Share it with your friends
.✍ I will be glad to see your ideas in this post
.🧲Follow me to see more analysis

Polygon Matic and the penny crypto areaPolygon Matic and the penny crypto area
Yesterday Matic closed it's daily candle above $1 - but seems loosing this important mark again
Since this has not happened yet we are still out of the penny crypto area
*not financial advice
do your own research before investing


MATIC targetPolygon Inverted Head and Shoulders undwinding. After long floating around the neckline, price finally shot up.🚀 I think there is chance for run to 1.095 and this is where I will close part of my longs.
Check my other active trades in related ideas down below!
Please boost🚀, comment🗣️, follow me✒️, enjoy📺!
⚠️Disclaimer: I'm not financial advisor. This is not a financial advice. Do your own due dilingence.

MATIC | Getting Ready for Mega Bullish Wave..!!
#MATIC Descending Broadening Wedge Breakout & Retest Confirmed in daily timeframe..!!
Mega Bullish Wave Coming..🚀🚀
Please like the idea for Support & Subscribe for More ideas like this and share your ideas and charts in Comments Section..!!
Thanks for Your Love & Support..!!

Polygon: Bug 🪲Polygon has got the bug – regarding the green zone between $0.87 and $0.71. And just like a bug, the altcoin has been crawling above it, tipping it here and there. Although Polygon could have already finished the current movement by touching the green zone, we expect it to scramble a bit deeper still to complete wave 4 in green. Afterwards, the altcoin should flap its wings and buzz upwards.

MATIC PRICE PREDICTION (-59) DAYSSafe Spot to trade LONG MATICUSD
A secure entry 4 Technical Forecast on Polygon COINBASE:MATICUSD

♌ MaticUsdt - Polygon - 1D ♌Matic Usdt
⏰ Time Frame : 1D
The price has reacted to this area several times in the past , that been supported zone but after break to change to resistance.
you can see in my another Idea.
what do you think?
❓ Will Break Resistance 1.0110 ?
✴️ I have shown Supports and Resistances .
📛 Please follow the market trend and decide to buy or sell.
⚠️ (This isn't a signal for buy or sell) ⚠️
#️⃣ August / 10 / 2022
👸 Analyzed by : Parisa_Alipoor

MATIC- Updated ChartMATIC has been my favorite way to buy the 'Big-Dip' (-ck also would work to express the massive drop in crypto prices):
First Matic post at 40 cents:
Many Matic ideas:
www.tradingview.com
and the one that stood out:
MATIC has been our most posted for Altcoin in the last 60 days.
Everything is for a reason as our research revealed all good things could be happening next for Polygon:
3 reasons why Polygon (MATIC) is up 100%+ during a bear market
Three reasons why the long-term outlook for Polygon remains positive are its continued adoption by mainstream entities, the migration of multiple projects to the Polygon network and an increase in the platforms offering liquid staking services for MATIC.
Major adoption announcements
Protocols launch on Polygon
Aside from the recent NFT projects that have migrated to Polygon, other new additions include the permissionless, credit protocol RociFi and WOO network’s multi-chain decentralized exchange.
MATIC has also seen a growing number of platforms that offer liquid staking for the token, which enables holders to earn staking rewards.
One Love,
the FXPROFESSOR
♌ MaticUsdt ♌ Polygon ♌♌ Matic Usdt
⏰ Time Frame : 1D
✴️ I have shown Supports and Resistances .
please tell me about your Idea
what do you think?
❓ Will Break Resistance 1.0110 ?
📛 Please follow the market trend and decide to buy or sell.
⚠️ (This isn't a signal for buy or sell) ⚠️
#️⃣ August / 08 / 2022
👸 Analyzed by : Parisa_Alipoor

Polygon (MATIC) - August 9hello?
Welcome, traders.
By "following", you can always get new information quickly.
Please also click "Like".
Have a good day.
-------------------------------------
(MATICUSDT 1M Chart)
The key is whether the price can be maintained above the 0.6164-0.8191 range.
(1W chart)
We need to see if the MS-Signal indicator can turn into an uptrend.
For that to happen, the key is to keep the price above 0.8191.
- The Stoch RSI indicator is entering the overbought zone.
As such, it is important to find support at or above the 0.6164-1.8191 range when it breaks out of the overbought zone.
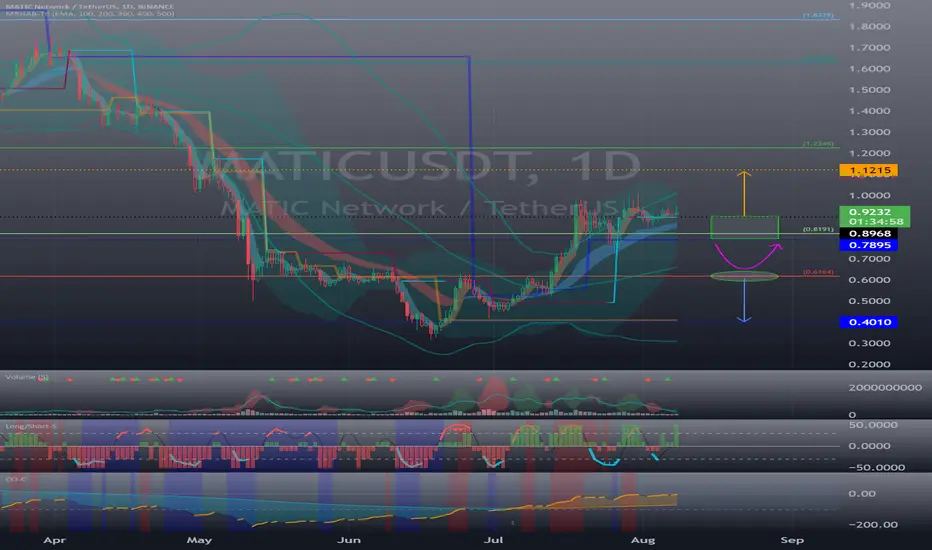
(1D chart)
Resistance: 1.1215-1.2246
1st support: 0.7895-0.9223
2nd support: 0.6164
You should see support near the 0.7895-0.9223 section and see if you can climb.
The 0.6164-0.8191 interval is the interval that determines the trend.
Therefore, if it is supported by falling to the 0.6164-0.8191 section, it is expected to rise.
When it falls below 0.6164, Stop Loss is required to secure cash.
------------------------------------------------------------ -------------------------------------------
** All descriptions are for reference only and do not guarantee a profit or loss in investment.
** The MRHAB-T indicator, which is inactive on the chart, contains indicators that indicate support and resistance points.
** Background color of Long/Short-S indicator: RSI oversold and overbought sections
** Background color of CCI-C indicator: When the short-term CCI line is below -100 and above +100, oversold and overbought sections are displayed.
** The OBV indicator was re-created by applying a formula to the DepthHouse Trading indicator, an indicator disclosed by oh92. (Thanks for this.)
(Short-term Stop Loss can be said to be a point where profit and loss can be preserved or additional entry can be made through split trading. It is a short-term investment perspective.)
---------------------------------
Optimism $OP (SHORT) Currently Overvalued Compared to Polygon Optimism, a layer 2 scalability play on Ethereum is currently trading at an $8.2B fully diluted valuation, as compared to Polygon's $9.2B valuation.
While TVL (total value locked) on Optimism is soaring, it's still only $1.1B compared to Polygon's $1.7B.
We're likely just seeing a rotation of money chasing DeFi opportunities in the Optimism ecosystem as there are no DeFi protocols in the Optimism ecosystem that innovate past what is already available on other L1 and L2 ecosystems.
We've seen similar rotations like this before, most of which result in a large run up followed by a steep crash in token price.
Lastly, only 5% of OP tokens are circulating, making the price extraordinarily sensitive and volatile, particularly to the downside as more tokens become unlocked and flood the market.
Looking at two different shorting opportunities based on key margin pressure level resistance, keeping tight stop losses in case $ETH pumps on the merge narrative and the ETH ecosystem follows suit. Check out my YT channel to learn more about margin pressure levels.

MATIC SHORT TILL 0.8035$MATIC gave a breakout from a bear flag 20 ma , 50 ma , 20 ema , 50 ema , are going to cross downside which is also a heavy bearish sign 4hr 6hr macd is also indicating bearish movement . you can a open a short till our target and sl with low levrage.
NOT A FINANCIAL ADVICE.

MATIC Breakout soon! Get ready!!Hello Everyone.
Kindly boost my post if you like the idea. leave the comment if you have something to say about this idea.
Lets Start!!!
So, we can see a triangles has been formed in the chart of the MATIC USDT. Right now we are testing the support line. also MATIC has tested 300 Moving Average which is working as resistance.
If triangles break towards down, next support area would be $ 0.8475.
if triangles break towards top, next good resistance zone would be $1.05 to $1.2
wait for the confirmation candle before you entered any trade. it may be fake out break. so trade smartly.

What i expect from other ALTs is already happen to MATIC🔥Hi friends! I hope you know how the bearish wedges work at the bull markets. But in this time is pullback to the closest support area of $0.67-0.72 is really possible because of the 100% growth of the altcoin in a month🚩 But after a pullback, the rise could continue.
📊I will use DOM and Footprint to enter this short if it will happen and try to find the best entry point using this trading instruments. It`s not so hard because you see the real orders of whales and can set short stop loss and get the highest RR.
🚩 The same with the long trades. It`s easy to find the support level and open a trade using DOM and Footprint and look how the whales push the price higher and higher.
📊 Preconditions to open a long trade:
🔥 squeeze to the upper trendline of the "bearish" wedge
🔥 bullish BTC help reach the targets for MATIC much faster
📊 The targets:
1️⃣ $1.187 - the closest key level
2️⃣ $1.51 - key level and even number
🚩 Traders, MATIC was broke out the trendline which is really similar to ADA, DOGE, SHIB and all alts that still close to the bottom. Hope all of them make the pump and grow at least for 70% like MATIC did.
💻Friends, press the "like"👍 button, write comments and share with your friends - it will be the best THANK YOU.
P.S. Personally, I open an entry if the price shows it according to my strategy.
Always do your analysis before making a trade.

Polygon (MATIC) x Total volume traded on UniswapAs per the bearish divergence from February 2021 to May 2021, this indicator has early signaled the top.
Now the traded volume is about to exit a bearish channel.
We also have an expansion wedge that is about to be broken along with the 50% retracement.

Matic may retest $0.66We have seen 200% up move from lower levels in a few weeks and at current levels, we may see profit booking in Matic. The 50% Fib Retracement of the current move from $0.31 to $1 comes around $0.66 which was also the breakout zone as well as Anchored VWAP from Lower Levels.

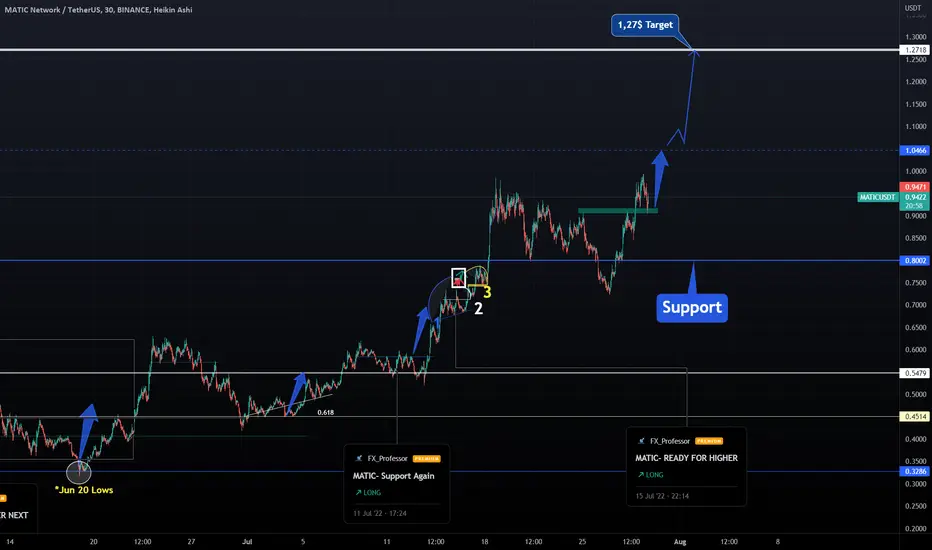
MATIC - 1,27$ IS CALLINGMarket is warming up and APPLE breakout could be a great indication that we are ready for Higher!
YES, THE MARKETS ARE CRAZY: Negative GDP was painted Green but hey: it is what it is and it's all good if the markets can push BTC and Crypto higher.
In any case a good selection is always needed and MATIC has been my Top pick since June...I guess i was right and now 1,27$ seems closer.
NEWS:
MATIC could create a balanced state if this comes to fruition:
The New Polygon (MATIC) Web3 Subscription Platform Is Jumping on the Trend of Dutch Auctions
One Love,
the FXPROFESSOR
Polygon vs Tether Early Bullish Signals With 111.11% TargetToday we have a volume breakout on MATICUSDT (Polygon).
Today's volume on BitMEX is highest daily volume since mid-May.
As prices move above EMA10 daily with a strong RSI, tells us that the bullish potential is building up.
It is early... But this setup can be traded with low risk and high potential rewards.
Namaste.

Matic LONG on Polygon, event August 4th or 5thMatic had a low of 73 cents one night ago, to the low level of 73 cents.
It was at this time that I started researching other traders and going into their defy wallets to see what trades they made. I saw someone pick up $638,000 worth of Matic at .77 cents..
I saw another wallet where someone invested $183,000 into MATIC around .78.cents.
I never made an entry into medic and now it's up to 81 cents and I'm kicking myself.
I still think that this will go to a $1.15 or more. They're having an event on August 4th or 5th. I believe this will push the price up.
I'm chatted on the public chat on trading view and when I said things about matic and that people were getting it at around 76 cents, some people said it was a steal at that price.
So I really wish I got in and I still want to get in. I was waiting for the FED to release their basis point numbers.
It looks like we've reached the support and now we are going for resistance. In the past days I've been monitoring the volume of Matic as well as the total crypto market and the usdt dominate chart..
Usdt dominance was at such a high of 7.04% two nights ago and I saw Matic drop to 73 cents.
Lot of whales got in at 37 cents a few weeks ago and they're making big money right now.
This has potential to go up a lot more and I still will make my entry anywhere from 73 cents if it ever goes down to around 82 cents. I feel that Matic is stable and doesn't drop much when you USDT Dominants happens.
