MATICWe shared some profitable MATIC setups over the last 3 weeks.
Now, MATIC is near a key diagonal support level (log scale) which has always acted as support since April 2022!
If this support fails, we might see MATIC coming to the next support zone between $1.5 and $1.6
Polygon

Polygon - a short term analysis (important)There are 2 scenarios
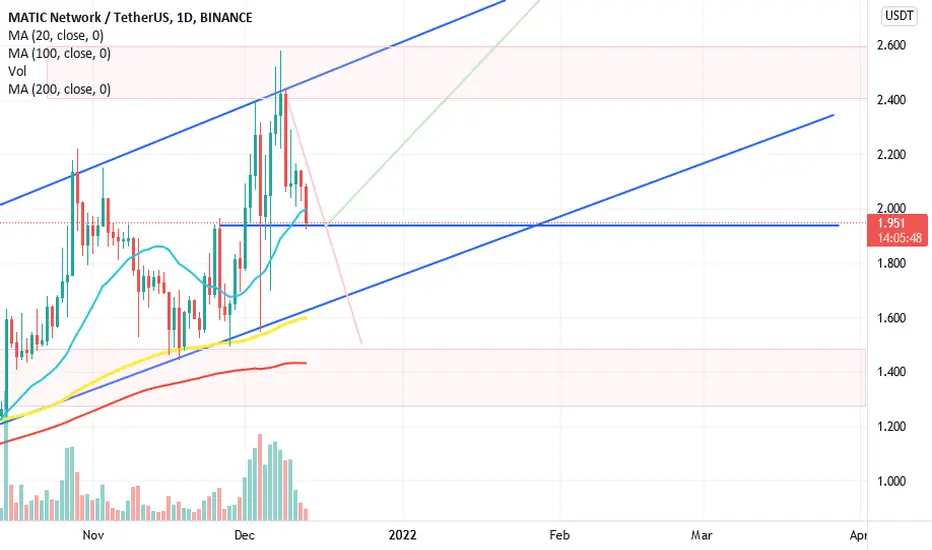
If Bitcoin continues to fall, Matic is likely to miss this short uptrend and could drop as low as $1.7
But Polygon has enough power to keep climbing and even touching ATH at $2.7 (even with a slow BTC drop)
However if the yellow trend line breaks, You can sell a small amount of your Matic for around $2.02 and wait for lower prices to re-enter
Remember that MATIC Supply on exchange is less than 0.2% and is still decreasing ..
Dear Friends, It would be nice to show your support by liking and maybe posting your comment
Good time

#matic cup and handle playing out?matic might be preparing for a cup and handle play, lets see what plays out!


Buy on weakness??this crypto is pretty good i think, because it is a long uptrend, so buy on weakness maybe?
$GALA/USDT 3h (Binance Futures) Descending trendline breakoutGala Games has been bouncing on 200MA showing bulls are in charge, then regained 50MA, continuation is likely.
Current Price= 0.49987
Buy Entry= 0.50150 - 0.45750
Take Profit= 0.61768 | 0.77065 | 0.93697
Stop Loss= 0.38624
Risk/Reward= 1:1.5 | 1:3.14 | 1:4.94
Expected Profit= +28.95% | +60.89% | +95.61%
Possible Loss= -19.37%
Fib. Retracement= 0.618 | 0.883 | 1.117
Margin Leverage= 1x
Estimated Gain-time= 2 weeks
Website: app.gala.games
Contracts:
#ERC20 0x15D4c048F83bd7e37d49eA4C83a07267Ec4203dA
#BEP20 0x7ddee176f665cd201f93eede625770e2fd911990


Matic still need a pullbackMatic is oversold on the 12H and needs a pullback. I am adding at 1.9 zone

MATICA possible scenario for MATIC to reach a new ATH. A pullback lower to the support level before starting a new leg up to reach the top of the channel and a new ATH.

Long for Polygon: MATICUSDTThe two red lines indicate the respective Lowe Low and Higher High of the previous D1 candle. Price has rejected the levels and is expected to retest a few of significance resistance levels marked as Tp in the chart. We expected it to retest the Higher High level with the target profit more than 10%++
God Speed.
TAYOR.

MATIC short term AnalysisHi,
As Polygon is very interesting in our opinion and its technical is far better than all the altcoins, we've provided this TA.
Positive sign = if price breaks the yellow line down with a slightly sharp movement.
The Green area is fine for a short-term buy position in 1h chart
it's possible if the price reacts to the red line in a sharp way.
Like and Comment and Follow us for more TA and news

$MATIC BULLISH TO $30average true range turning to upside with a signal to a break out
measured move from bullish pennant is $30
length of time for the move to play out should be 3 to 6 months
not financial advice

MATIC has formed yet another double bottomMATIC is performing quite well despite the current market conditions. Looks like MATIC on the 1 hour view is testing the neckline of the double bottom. This is yet another double bottom MATIC has made.
I would anticipate another run up like we saw with the last double bottom.

MATIC diamond bottom?This idea is more of an update to my double bottom pattern which seems to be more like a potential diamond bottom(bullish) formation.


MATIC-USDT price action and fundamentalsHello there❄
Technical overview :
Over the last few days I have been seeing many bouncing from resistances/ supports in these channels (I have circled in white above🧐📈)
If you have been crypto trading you have surely noticed MATIC (polygon) soaring to new ATHs 7 months ago (2.44,) but more importantly 2 days ago it came within approximately 4 cents of all time high .
That says a lot about Polygon from a technical analysis of price action 👇👇👇
On December 3rd (before the flash crash) MATIC price was up 40 percent for the week. BTC on the other hand was down about 8 percent.. 😵
I am expecting Matic to follow the ascending pitchfork-channel , however I have also included a slightly descending pitchfork in the event market loses strength👎💪 come open of stocks on Monday.. 🆗📆
It is possible that we come down to test this liquidation capitulation zone once more before consolidating and forming a more structured trend reversal.😃⏬
Short fundamental dive:🌊☃
The network effect on MATIC is gaining traction through everything that is being built on top of it and its low transaction fees. On December 9th (4 days,) Polygon team will be hosting the ZK summit , ZK technology is said to be the solution to having completely encrypted transactions. This will add a lot of intrinsic value to Polygon network and MATIC. Before the announcement there was already a lot of hype around Polygon as it is known for its low transaction fees, a 2-layer scaling solution to Ethereum's current downfalls (high gas fees, slow transaction times.)
🛑Thank you so much, this is not advice! 🛑
Any thoughts 💭💡, questions 🙋♀️🙋♂️❓, good 👍, bad👎, happy 😄 or sad 😥, in the comments always welcome.
👽

Another MATIC and ETH Comparison. BUY MATIC!Early days of MATICUSD are extremely similar to the early days of ETHUSD
Both are within falling wedges
This is my second comparison of these two, the first was of the BTC pair
another example of the 'weak market' hypotheses
link below
I have just loaded up on MATIC based on these analyses


Matic the horseHello everyone,
I proudly caught this baby on the last retest at 1.63.
The future looks bright, especially if the BTC bull run continues...You already know my view.
This is just the beginning, and Matic is the first of many alts to run soon.
If you are all feeling the FOMO because you are not in this baby, and your fingertips are itchy ready to pull the trigger...wait!
Do not buy in the green. Buy the red.
After this acceleration with good volume on the back, there will likely be a retest in the 2.1 area. This will be an excellent opportunity for those who want to add to their position or enter this winning horse.
I laid out the targets and retracement. These have been set by using the Elliott wave Theory and the golden ratio discovered by Fibonacci da Pisa.
FOLLOW ME, SHARE, LIKE AND COMMENT

MATIC - Knockin' on Heaven's DoorPolygon (previously Matic Network) is the first well-structured, easy-to-use platform for Ethereum scaling and infrastructure development. Its core component is Polygon SDK, a modular, flexible framework that supports building multiple types of applications.
The current CoinMarketCap ranking is #14, with a live market cap of $17,500,000,000 USD.
I drawn first trendlines on this coin chart while it was at 0.02$, but unfortunately I didn't load up at this price level.
Since recent big crypto market dump, MATIC is one of few which was bought up quickly and now facing last resistance before takeoff to unknown territory.
If it manage to breakout and turn last resistance into support, as usual I'm targeting Fib. extensions as take profit zones.
In this case it is approx. 4$ as TP 1 and 6$ as TP 2.
In case of rejection from resistance zone, I'm looking at green boxes as buy opportunities.
Considering high CMC ranking and M. Cap, I don't expect huge gains here. That already happen with this coin.
My average buy price is around 0.8$ and I took some profit earlier today. At 4$ and 6$ zones I'm planning to reduce my position to 20-25% of initial position and reallocate into project with smaller M.Cap.
Thanks for reading and good luck!

$MATIC AND ETHEREUM BULL FLAG OBSERVATIONI expect both polygon and ethereum to complete the flag pattern extension somewhere in the grey box. ethereum is already well inside the box, and it looks likely to move higher. polygon has been unusually strong during the pullbacks and I believe it is searching for valuation. It seems polygon has much more upside to come at this point.
Currently over 3000 protocols have migrated to the Polygon network!
view here: awesomepolygon.com
Polygon combines the best of Ethereum and sovereign blockchains into a full-fledged multi-chain system.
Polygon solves pain points associated with Blockchains, like high gas fees and slow speeds, without sacrificing on security. This multi-chain system is akin to other ones such as Polkadot, Cosmos, Avalanche etc, but with at least three major upsides:
1. It is able to fully benefit from Ethereum’s network effects
2. It is inherently more secure
3. It is more open and powerful
this information is not a recommendation to buy or sell. please conduct your own research before investing.

Polygon (MATIC/USDT) technical analysisPrice is moving in an uptrend channel. Currently, the price is bouncing off the two minor downtrend lines. After the downtrend line breaks, there are two possible targets; the ascending channel's top line and the horizontal line.

MATIC pre-breakout pattern and "zk" dayMATIC, the native token of the Polygon blockchain, chart is one of the best currently on the market. I'm long since $1,5 when it touched support line, but will add more at breakout, then new price discovery mode for this token.
Polygon is a protocol and framework for building and connecting Ethereum-compatible blockchain networks, offering an ecosystem with lower transaction costs and faster speeds than Ethereum.
There are some speculations over what the firm has called an “exciting announcement,” scheduled for Dec. 9 at Polygon virtual “zk day.” The event will centre around the applications of zk-STARKs and zero-knowledge (ZK) proofs, a type of cryptography that can verify whether a given statement is true without revealing the data that proves it.
Over the past several weeks, Polygon has also attracted interest from venture capitalists and institutional investors as Ethereum’s soaring gas fees have sent projects fleeing to cheaper blockchains.
Polygon reported all-time high network revenue for November and reached over 300,000 active addresses. Polygon also saw record monthly volume of nearly $60 million on non-fungible token (NFT) marketplace OpenSea last month.
