I think MATIC ...Hello Everyone
#MATIC adjusted to the $ 1.4 range after failing to cross the $ 2 range, from which it has again reached its $ 2 resistance level.
In the daily time frame, it seems that Metic is inside a triangle, and if he manages to break the triangle from the top, progressing to the range of 2.7 is not far off.
But if it fails to break the triangle from above, limits 1.8 and 1.4 are important meticulous supports.
.
.
If you have any questions, you can write it in comments below, and I will answer them
And please don't forget to support this idea with your like and comment, thank you...
Polygon

UNI goes for $28Uniswap is probably preparing to use the Polygon blockchain and it will be huge.
Uni has recently broken its downtrend. But now isn't a good time to buy (Risky)
There is a possibility of Pool-Back to the green zone and that's a good opportunity to enter.
Dear Friends, Always consider that not losing is better than not gaining. There will also always be good opportunities, so never get involved with FOMO.
Good Time

Polygon (MATICUSD) has Nested 1-2,i-ii Elliott Wave SetupPolygon (MATICUSD) has a wonderful nested "1-2,i-ii" setup in place after our recent pullback. In other words, we have a larger 1-2 in place and now a smaller-degree 1-2 in place as well with the rally and pullback over the past month or so. However, there reason to be cautious as this smaller-degree 1-2 has extended beyond the standard expectation of hitting the 0.382-0.618 extension range. While this could very well indicate incredible extension potentials overhead for the remainder of our 3rd wave, the structure can just as easily be interpreted as a giant A-B-C corrective wave up for a larger-degree B-wave fakeout rally, which can easily drop us deeper than our low from this past summer! I will remain bullish until we break the primary 1.00 support however.
With this pullback, we may very well have our last window to deploy lump sums of cash into Polygon if you are trying to build your position. To those considering starting to dollar-cost-average (DCA) into Polygon (as well as all the cryptos in general), I would recommend possibly starting with a sizeable lump sum right away and then reducing your regular DCA purchases into the future. This would keep your cost-average lower as I expect the 3rd wave to really take-off (in other words, less buying at higher price levels).
If we can hold our immediate upside support of 1.23, we are still looking at logarithmic Wave 3 projections of 4.86 to 6.35 with 6.35 being a likely strong resistance. Wave 5 projects to 7.49 to 9.78 but with a strong likelihood of extending to the resistance level at 12.85 for an 8.5x return.
Finally, there is an outside shot that Polygon extends all the way up the major 0.618 extension level of 26.31 for a 17x return as our final top! But that will remain of low likelihood until we see strong extensions within the 3rd wave first. If history and fractal patterns serve as any indication, there's a solid chance of seeing a parabolic 3rd wave with this one!
As this top along with the top of most altcoins will coincide with the MAJOR top expected in BTC and ETH, we may experience a devastating crash across the entire crypto world afterwards. That would be a great time to take profits and reallocate into other asset classes or even Stablecoins, which are designed to hold a constant value in the face of crypto sector volatility (just like Money Market funds or Savings Bonds). But until then, we've got a very bullish outlook!
I use Elliott Wave analysis to project price levels for different assets and asset classes. EW is a form a technical analysis that is absolutely NOT based on fundamentals. Please be aware that this video is not intended to act as financial advice. I am not a trained or certified financial professional. You may invest based on a strategy tailored to your own skill and risk-tolerance levels.
#matic #polygon #polygoncrypto #maticnetwork

MATIC - 2021 Top PredictionTop of the Mornin' !
MATIC has shown a really strong push to the upside leaving us only support & resistances lines. Additionally I double checked fib levels and they match what the trendlines are showing.
My 2021 top prediction is $5-$6 for MATIC.
Cheers!

MATIC - Still Strong and bullish 😍👍Personally I'm a Polygon fan and like all that they have done
Matic will have a great future and is one of the best Altcoins for the long-term holding. So buying its dips can have big results
TP 1 and ATH are specified for selling some of your tokens (optional)
Other points are specified in the chart.
Dear Friends If you are interested, It would be nice to show your support by liking and maybe posting your comment
Good time

Will Polygon (Matic) breakout of a triangle ?Polygon´s 5 tasks on the daily chart...
1. hold the green price trendline channel
2. hold the green support on OBV
3. break the red horizontal price resistance
4. break the red trendline channel on RSI
5. confirm breakout(s) and have fun 😎
Drop me a nice comment if you'd like me to analyze any other cryptocurrency or do another comparison.
*no financial advice
do your own research before investing

MATIC - 3.8 - $5 Top by EOY or Early Jan- If breakout remains, Matic has resistance in the next few weeks.
- If can break the $2 mark by early December then its price discovery until $3.8 (Red)
- Could bounce to $5 (Red)
- If it doesn't break then delayed breakout to possibly $5 (Green)


MATIC ( polygon ) analysesMATIC ( polygon ) analyses
time frame daily
price is in the bullish channel
we can see double hit on bottom of channel , then raise to last ATH , pulback and make new ATH
now we can see double hit again,
so my first target is ATH and then 3.2$ for next target

AM back to Cover Matic!My prev prediction had 2 scenarios and the one that playing out is my breakdown idea!
Now matic is comeback to ascending triangel consolidation and potentialy will perform an Inv H&S (but still uncomplete)
If BTC still sideways or going up the breakout target will BANG!
*not financial advice as always goodluck with your trade ;)

MATIC/USD set to break the intraday highs of $1.68Polygon price analysis is bullish today.
MATIC/USD saw another selloff overnight.
MATIC/USD is currently trading at $1.68
The triangle price pattern is bearish today, as we anticipate recovery to follow after another drop. Since the support level of $1.55 was recognized again, MATIC/USD should recover some of its losses during the next 24 hours.
The Awesome Oscillator displays red bars today, as MATIC/USD continues its drop. Since the triangle price pattern is bearish today, we should see MATIC/USD recover some of its losses during the next 24 hours. Losing another $0.2 against USD overnight left an impact on sentiment towards this cryptocurrency.

MATIC(polygon) PRICE PREDICTIONThis is what we may see for matic (polygon) in the near future as it is acting exactly like ethereum in 2017.
so after breaking this triangle pattern we may see a rise to 3.5-4$ for matic.

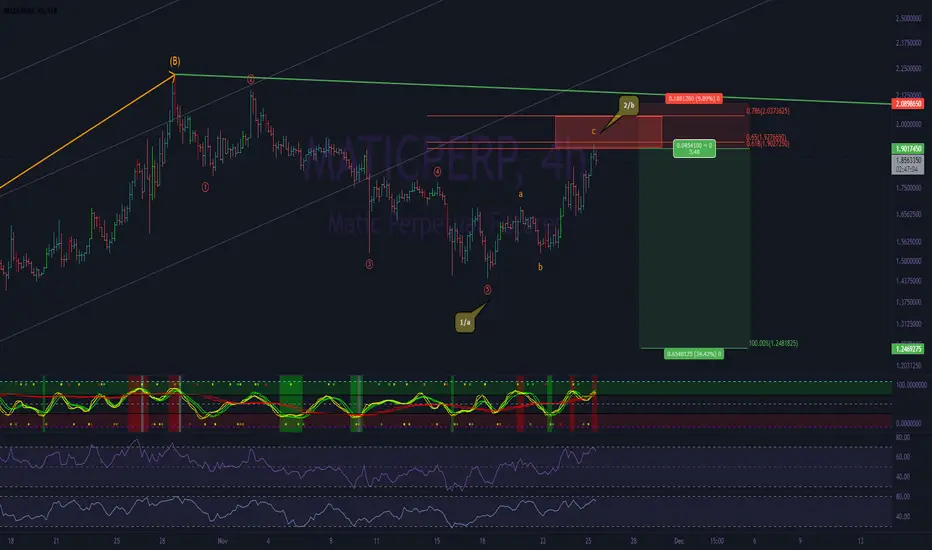
Matic short swing ~matic recently came down in 5 wave, and has seen a mean retracement into the local inversed golden zone.
not sure yet weather it was a wave A or a wave 1, but i'm swinging this in the same style as the last few setups i shared today.
100% extension target = $1.25
POLYGON “MATIC” LOADING UP
This is my prediction of MATIC….Chart looks extremely bullish to me. I also see increased volume following that upwards trend into a nice wedge “triangle”. Let me know what you guys think… I posted yesterday and nothing but upwards from where I posted.

Matic Chart SIGNAL by Sajjat Hossen #MATIC Usdt 1D Chart SIGNAL by Sajjat Hossen
⚠️ Buy Sell At Your Own Risk ⚠️
Entry ✅ Buy Between $1.55 - $1.75
Stop-loss ❌ If Day Candle Close Below The $1.44
Old Analysis...

POLYGON/MATIC 1DPOLYGON/MATIC USD
from bottom to top.
MACD- bullish crossover.
- oscillators going bullish
RSI - dipped under, then broke above, and
retested the 50 RSI level successfully.
Fibs - From the move that made the ATH it
retraced to the 0.786 fib and then bounced.
This rally created a swing high from the low.
That swing high then retraced to Golden Pocket
of the 0.618 - 0.65 fib. creating a higher low.
The next rally continued to the 0.236 fib and
retraced and bounced well from the AVwap of
the ATH.
Trade Frosty.
*This is not trading advice I just like to draw lines and color.
