POLUSDT 1D AnalysisPOL ~ 1D Analysis
#POL This coin is currently at its lowest support. Buy if you still have confidence in this coin with a short term target of at least 15%+ from this support.
Polygonanalysis

Polygon: More (short-term) Upward PotentialFor Polygon’s POL, we primarily expect further corrective rises during the blue wave (iv), but below the $0.51 mark, renewed sell-offs should take over. These declines should then drive the price down below the support at $0.15, allowing the large wave to reach its conclusion there. Our alternative scenario – where the low of wave alt. in green would be already behind us (probability: 33%) – is still relevant. This scenario would be reinforced with a jump above the resistance at $0.51 but only finally confirmed with increases above the next higher level at $0.76.
📈 Over 190 precise analyses, clear entry points, and defined Target Zones - that's what we do.

POLUSDT 1D Analysis POL ~ 1D Analysis
#POL Buy gradually from here if you still have confidence in this coin with a short term target of at least 15%++ from here.

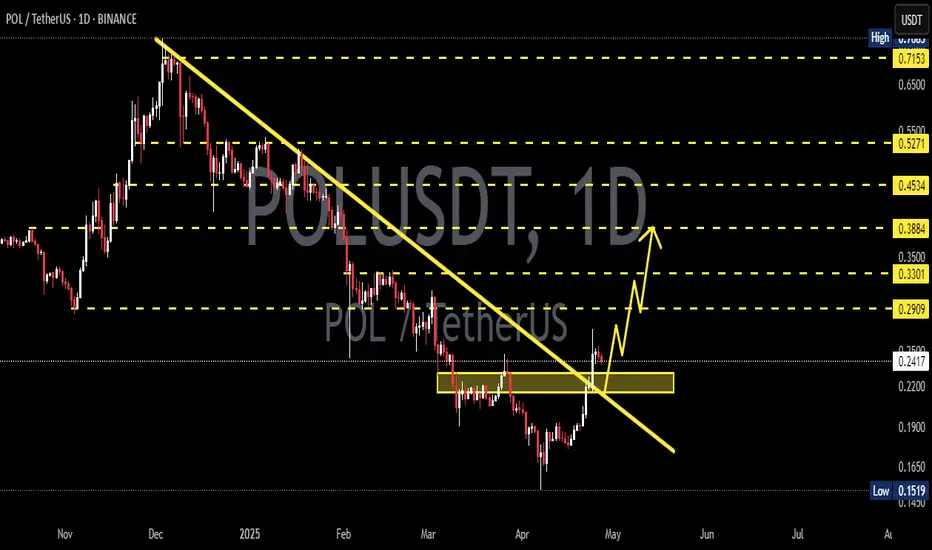
POLUSDT 1D AnalysisPOL ~ 1D Analysis
#POL Buy gradually from here if you still have a Conviction on this coin with a short -term target of at least 15%+ from here.
Polygon is ready to take off!Hi fellow traders, POLUSDT is ready to make a move higher after completing the complex correction in WXY formation. Target the 0.8414 level. Good luck and trade safe!

MATIC looks tired
MATIC looks tired.
- Distinct Wave 5 could be ending
- Overbought Stoch RSI 8h
- Broken down from long-term ascending parallel channel
Decreased Network Activity:
Despite an increase in active addresses, MATIC's price has declined, indicating that heightened network activity isn't translating into price support.
Increased Selling Pressure:
A rise in open interest indicates that traders are increasing exposure to MATIC, but if this is driven by short positions, it could lead to increased selling pressure and a subsequent price decline.
A good strategy is repetitive, and even boring.
Keep it simple and efficient.

Polygon: Shaken UpFollowing an impressive 60% rally from the low of the green wave on November 5, POL has seen a sharp pullback since Tuesday, shedding about 20% of its value. The price remains stuck within our blue Target Zone between $0.30 and $0.47. However, it should exit this range during the ongoing blue upward wave (i) to surpass the August 21 high at $0.60. However, if the price instead falls below the support at $0.28, the green wave alt. will mark a new low. This would delay the development of the blue five-wave upward structure – a scenario we rate with a 37% probability.

MATIC → Polygon Pullback to $0.35 then $0.70? Let's Answer.Since my February 3rd update, MATIC has remained in a trading range, as expected. We found resistance at $1.25 and then pulled back in two strong legs. Should we be bearish or bullish on MATIC?
How do we trade this? 🤔
As expected, MATIC found resistance at the Resistance Zone of $1.25 after two pushes up in the trading range followed by two legs down, leaving us below the Support Zone at a low of $0.50. We now see the price finding support in this area, and it has yet to show signs of strength.
It's not reasonable to enter a long here given that we lack a strong bullish candle close. We need to wait for a strong candle at this support area, but I believe it's more likely we will fall to the triangle low of around $0.31. Look for a signal and confirmation candle in this area then enter a long. Once that target is hit, take half profits at 1:1 Risk/Reward, moving the stop loss up to the entry price, then swinging the latter half of the position to 1:2 Risk/Reward.
We also need to watch Bitcoin's sentiment as the price action plays out. I expect Bitcoin will fall into a two-legged pullback to around $40,000-$45,000, which should take the alt market down with it, either keeping it in a trading range or bringing it to lower lows. Until Bitcoin's sentiment shows a clear bull signal after a likely pullback, it's one more indicator we should allow to play out before getting long in MATIC.
A final point of data is the RSI low and above the moving average of around 37.00. This indicates we are into the swing high and a long entry at this stage is warranted.
💡 Trade Idea 💡
Long Entry: $0.40
🟥 Stop Loss: $0.27
✅ Take Profit #1: $0.53
✅ Take Profit #2: $0.66
⚖️ Risk/Reward Ratio: 1:2
🔑 Key Takeaways 🔑
1. Two legs up toward a resistance zone in a triangle
2. Resistance met at $1.25, two legs back toward the triangle low
3. Look for a break below the triangle to the triangle low
4. Long entry justified after strong bull candle close near triangle low
5. RSI at 37.00 and below the moving average. Supports a long entry
💰 Trading Tip 💰
The longer a trend continues after 3 legs, the probability of that trend continuing lessens. Because of this decreased probability, we ought to reduce our risk when entering trades.
⚠️ Risk Warning! ⚠️
Past performance is not necessarily indicative of future results. You are solely responsible for your trades. Trade at your own risk!
Like 👍 and Follow to learn more about:
1. Reading Price Action
2. Chart Analysis
3. Trade Management
4. Trading Psychology

Polygon Matic price is at the bottom of global consolidationDuring the recent correction of the crypto market, the price of #MATICUSDT fell quite a bit, as for an altcoin from the top 20
However, the aggressive buyback of CRYPTOCAP:MATIC started from the critical zone, and this is good. Perhaps it was around $0.60 that big money was ready to buy.
Whether this is true or not, we will soon find out, because if the price of the #Polygon token is to start its upward trend, it should not more allowed to fall below $0.60
_____________________
Did you like our analysis? Leave a comment, like, and follow to get more

Cryptolean Chainlink MATIC Update Polygon MATIC declined sharply to $1.01, the key daily support.
A bullish reversal from $1.01 is likely and will result in a bullish move to re-test $1.07 and the key daily resistance zone of $1.14-$1.20.
A bearish break-out of $1.01 will push #MATIC price in the daily range zone and will increase probability of a deeper correction towards the next support at $0.89.
Intraday Chart
The MATICUSDT 4-Hour chart is bearish and teasing the resistance at $1.07.
A bearish rejection of $1.07 will lead to $1.01 and lower to the key support zone of $0.86-$0.92, where I will be closely watching the MATIC price action, as the bullish rejection of this zone is possible.
A bullish break-out of $1.07 will lead to a re-test of $1.13 and, possibly, $1.19, however the price action may be slow and choppy.
Support once read!
Thank you.

MATIC → Polygon Pullback then Bounce to New Highs? Let's Answer.MATIC has been caught between a trading zone since November but has finally touched the Support Zone and bounced back above the Daily 200EMA. Should we long here?
How do we trade this? 🤔
The Support Zone was touched and a strong bounce led the price back above the 200EMA. We are currently hovering between the Daily 30EMA and 200EMA with no clear signals to buy or sell. The RSI is around 46.00 and above the Moving Average, another sign for a long position. The only thing we're missing is a solid Risk/Reward Ratio and a buy signal, which requires the price pullback a bit more before we can enter the market.
We ought to target at least a 1:2 Risk/Reward, but I believe we have the runway for a 1:3 Risk/Reward given the distance to the previous high of $1.092. Target the $0.735 price area for an entry and place a stop loss below the previous low in the Support Zone around $0.655, the first Take Profit at $0.815, and the final Take Profit around $0.975 or until you see a sell signal. Move the stop loss up to the entry price when Take Profit #1 is hit to lock in profits.
The first take profit is placed around the 30EMA zone since it may act as resistance. The second take profit is placed just before $1.00 where there has been a few failed attempts to break it since November.
💡 Trade Idea 💡
Long Entry: $0.735
🟥 Stop Loss: $0.655
✅ Take Profit #1: $0.815
✅ Take Profit #2: $0.975
⚖️ Risk/Reward Ratio: 1:3
🔑 Key Takeaways 🔑
1. Trading range after a bull run justified long bias.
2. Contact with the Support Zone followed by a bounce.
3. Price hovering between 30EMA and 200EMA, wait for pullback.
4. Look for long entry around $0.735 for a 1:3 Risk/Reward ratio.
5. RSI at 46.00 and above the moving average, supports long bias.
💰 Trading Tip 💰
It's reasonable to take half profits at the first resistance target in a long trade, or the first support target in a short trade. Using a 1:1 Risk/Reward Ratio for your first target, you can move your stop loss up to your entry price, locking in profits. This allows you to watch the rest of the trade execute without worry of losing money. This helps improve trading psychology and the equity in your account.
⚠️ Risk Warning! ⚠️
Past performance is not necessarily indicative of future results. You are solely responsible for your trades. Trade at your own risk!
Like 👍 and Follow to learn more about:
1. Reading Price Action
2. Chart Analysis
3. Trade Management
4. Trading Psychology

MATIC → Polygon Showing Reversal Signals? A Short Scalp is Near!MATIC (Polygon) is holding above the Daily 200EMA support and has yet to break it after making contact 5 times since breaking it. So why is a short scalp reasonable?
How do we trade this? 🤔
We have a few good reasons to be looking for a counter-trend trade; There have been several sell-offs in the $0.95-$1.10 range, a very strong sell-off at $1.10, the 200EMA support has been tested 5 times which adds to the probability it will be broken, and the RSI is at 50.00 and below the moving average.
These data points tell us it's time to start looking for counter-trend setups, but we cannot enter a trade until we see confirmation to enter. What we need is a final test of the $0.98 area to get a good entry around $0.93-$0.95. From there, we can short half of our position to the 200EMA ($0.79), take profits, move our stop loss up to our entry price, and then swing the rest of the position down to the Support Zone at $0.665.
Taking profits at the 200EMA is about a 1:1 Risk/Reward if our stop is placed just above the previous high at $1.11. That is a reasonable scalp, and the rest, being a bit lower probability of success, allows us to swing the second half of our position without the worry of losing money. We could repeat this approach until either the 200EMA Support breaks or the $1.10 high breaks and stops us out, which lets us know the upward momentum isn't done yet.
💡 Trade Idea 💡
Short Entry: $0.95
🟥 Stop Loss: $1.11
✅ Take Profit #1: $0.79
✅ Take Profit #2: $0.67
⚖️ Risk/Reward Ratio: 1:1.75
🔑 Key Takeaways 🔑
1. Several Sell Signals at Key Resistance area of $0.95 to $1.10
2. Strong Sell Signal After Hitting $1.10
3. Wait for One More Failed Attempt to break $0.95
4. Short a Sell Signal off of $0.95-$1.00 Price Area, Stop Loss above Previous High of
5. RSI at 50.00 and below Moving Average.
💰 Trading Tip 💰
It's reasonable to take half profits at the first support target in a short trade, or the first resistance target in a long trade. You can then move your stop loss up to your entry price and watch the rest of the trade execute without worry of losing money. This helps improve trading psychology and the equity in your account.
⚠️ Risk Warning! ⚠️
Past performance is not necessarily indicative of future results. You are solely responsible for your trades. Trade at your own risk!
Like 👍 and Follow to learn more about:
1. Reading price action
2. Chart analysis
3. Trade management
4. Trade psychology

MATIC → Polygon Breaks Resistance! Should we Long or Short? MATIC has broken above the Previous Resistance Zone and is currently re-testing it as support. Is this a scenario where we enter a long? Or are we at the top ready to short?
How do we trade this? 🤔
We can play either scenario, but we need confirmation in one of the directions to have enough justifications to enter a trade. If the price comes back up and successfully tests the Support Zone, then it's reasonable to long scalp to the next Resistance Zone at $1.19. If we break below and re-test the Support Zone as resistance, it's reasonable to short scalp near the Support Line. Bitcoin is also at a crucial point in the market cycle, we need to see if it falls or breaks out to and above $46,000. Bitcoins direction could (and probably will) drag the alt market with it.
We need that confirmation to have enough probability to enter a trade. We're stuck in limbo without a clear direction at this point and should remain on the sidelines until more price actions prints on the screen.
💡 Trade Ideas 💡
Short Entry: $0.93
🟥 Stop Loss: $1.00
✅ Take Profit: $0.86
⚖️ Risk/Reward Ratio: 1:1
Long Entry: $1.065
🟥 Stop Loss: $0.970
✅ Take Profit: $1.160
⚖️ Risk/Reward Ratio: 1:1
🔑 Key Takeaways 🔑
1. Broke Above Previous High, Testing for Support.
2. If Price Falls Below Support Zone and Fails Re-test, Short.
3. If Price Rises Tests Support Zone and Closes, Long.
4. RSI around 61.00 and above Moving Average, Short-term Bias to Long.
5. Keep an eye on Bitcoins Price Movement as a leading indicator.
💰 Trading Tip 💰
Don't trade without clarity. If the price action isn't giving you favorable probability or optimal entries, don't trade it. You will be far wealthier by waiting on the sidelines.
⚠️ Risk Warning! ⚠️
Past performance is not necessarily indicative of future results. You are solely responsible for your trades. Trade at your own risk!
Like 👍 and comment if you found this analysis useful!

MATIC → Ascending Triangle Breakout? Or Rejection to $0.60?MATIC (Polygon) is at a pivotal moment on the chart; follow-through with the Ascending Triangle and breakout to the upside? Or get rejected a third time and fall back toward the $0.60 level?
How do we trade this? 🤔
To justify a long, we need to break the Resistance Zone and test it for support. We're too close to Resistance to long now, the probability of profit is far too low and the stop loss would have to be placed too far away (bad Risk/Reward). After breaking the Resistance Zone, a protective stop should be placed just below it and a Take Profit at 1:2 Risk/Reward is reasonable.
A short position could be available much sooner if the price is rejected a third time at the resistance zone and falls beneath the Daily 30EMA. What we need is a sell signal bar and confirmation closing on or near their lows, below the 30EMA, and the RSI below the Moving Average.
Until either scenario presents itself, we should remain on the sidelines and watch the price action unfold.
💡 Trade Ideas 💡
Short Entry: $0.885
🟥 Stop Loss: $0.955
✅ Take Profit: $0.755
⚖️ Risk/Reward Ratio: 1:2
Long Entry: $1.017
🟥 Stop Loss: $0.937
✅ Take Profit: $1.177
⚖️ Risk/Reward Ratio: 1:2
🔑 Key Takeaways 🔑
1. Ascending Triangle, Bullish Pattern!
2. Strong Support on Daily 30EMA.
3. At Resistance Zone, Do Not Long Here!
4. RSI at 53.00 and Below Moving Average. Bias to Short.
5. Wait for break of resistance zone to Long. Short if Rejected.
⚠️ Risk Warning! ⚠️
Past performance is not necessarily indicative of future results. You are solely responsible for your trades. Trade at your own risk!
Like 👍 and comment if you found this analysis useful!

MATIC → Clear Shot to $1.00!? This Chart Answers that Question.Polygon broke out of the 200EMA resistance and ran to the upside to flirt with the $1.00 price point in mid-November. We've now seen a two-legged pullback from that price and a double bottom seems to have formed. Does that mean we're ready to try for $1.00 again?
How do we trade this?
We do have many of the required conditions to get long! But we do need to wait on one more condition to give us the optimal probability for our long trade. A bull candle closing on or near its high is the final step and it looks like the current Daily candle could deliver! Once you see that close, it's reasonable to get long and go for a standard 1:2 Risk/Reward ratio, protective stop below the Daily 200EMA and set a profit target around the previous high of $0.95.
Also, be prepared for the bullish scenario to fail. Keep an eye on Bitcoin as a leading market indicator to see if it succeeds in breaking the Weekly Resistance. If Bitcoin reverses at the $39,000 - $40,000 level, watch MATIC's response closely and be prepared to get out of your long. Look for a strong bear bar closing on or near its low with followthrough.
Trade Idea
Long Entry : $0.77
Stop Loss: $0.70
Take Profit: $0.91
Risk/Reward Ratio: 1:2
Key Takeaways
1. Bull breakout of the 200EMA, Trending Bull!
2. Followed by Two-Legged Pullback, Ended Nov 23rd.
3. Double-Bottom Reversal, waiting for close of Strong Bull Candle.
4. RSI above Moving Average and around 55.00. Bias to Long.
5. Watch MATIC and Bitcoin for reversal signals, use caution.
You are solely responsible for your trades, trade at your own risk!
If you found this analysis helpful, click the Boost button and let us know what you think in the comment section below!

MATIC STRONG BEARISH Falling KnifeTrend stron bearish
RSI Momentum below 50 strong bearish
Nearish Volume rising
Support will break soon
Matic will fall deeper
ADA, MATIC, SOL face the music as Robinhood delists tokens
Hours after Robinhood delisted ADA, MATIC, and SOL, the price action of the tokens was not what participants would have hoped for.
The decision to end support for the tokens caused a $387 million wipeout from the crypto market.
Several indicators revealed that ADA, SOL, and MATIC’s momentum were bearish.
The prices of Cardano , Polygon , and Solana tumbled in double-digit figures after Robinhood confirmed that it was delisting the tokens from its platform.
While the U.S. trading platform did not give cogent reasons for its decision, speculation went around that it was linked to the recent SEC “unregistered securities” tag.
Unlike recently targeted exchanges like Binance and Coinbase, Robinhood is duly regulated by the SEC. Hence, it could have been necessary to take such action.
Regulatory fear leads traders to liquidation
In its statement, Robinhood noted that no other coins were affected. But holders of the ADA, SOL, and MATIC had until 27 June to stop transacting the tokens.
As the sudden move sent shockwaves through the crypto market, the implication of the decision revealed itself.
According to CoinMarketCap, SOL’s value decreased by 22.47% in the last 24 hours. ADA could not escape the heat, registering a 23.06% decrease. As for MATIC, it was down by 26.12% within the same period.
Because of the significant decline in the prices of these tokens, liquidations in the past 24 hours surged to $387 million, with longs suffering the most.
Based on the liquidation heatmap from Coinglass above, SOL accounted for $15.15 million out of the total wipeout. MATIC’S liquidation went up to $8.54 million, while ADA was $15.87 million.
Red season for the cohort
Meanwhile, an evaluation of the ADA/USD daily chart showed that the token’s momentum had breached the oversold region, as indicated by the Relative Strength Index (RSI).
At 17.21, the RSI showed that selling pressure was tremendous. Thus, the momentum was bearish, and slight buying power might do almost nothing to save the price action from the press time state.
The daily timeframe of MATIC was not any better. This was because the Awesome Oscillator (AO) was down to -0.1139. Thus, AO crossing into the negative territory indicated a bearish signal.

Polygon: Exemplary 🤓Quite commendably, Polygon has advanced into our magenta-colored target zone between $0.78 and $1.02 and has touched at the lower edge of the pink trend channel to finish wave (iv) in blue. Now, we expect the altcoin to gain strong upwards momentum to haul itself up, leaving the magenta-colored zone on the northern side and developing wave (v) in blue, which should end in the top of wave (i) in magenta. Wave (ii) in magenta should then make for a distinct counter movement before wave (iii) in magenta should take Polygon further upwards.

#Polygon Tanks 30% in Less Than 3 Weeks, Support at $1.10Past Performance of Polygon
Polygon prices more than double from January to February. MATIC rose 108% from December lows and remains within a bullish formation despite recent losses. From the daily chart, MATIC is down 30% from February peaks and likely to post even more losses in sessions ahead.
#Polygon Technical Analysis
Polygon prices fell over the weekend, continuing their retracement from February highs. The token now has support at the 61.8% retracement level though the uptrend remains valid. As it is, traders can find support at $1.10 with resistance at $1.30, coinciding with the 38.2% Fibonacci retracement of the December to February 2023 trade range. Any loss below $1.10, confirming losses of March 3 and 4, might see MATIC slide to $0.95, a reaction line flashing with December highs. Meanwhile, optimistic traders can wait for an expansion above $1.30 before loading, targeting February highs at $1.58.
What to Expect from #MATIC?
The uptrend remains bullish, but bears are pressing on. With MATIC down roughly 30% from February peaks, retesting a critical Fibonacci retracement level, traders can wait for a definitive breakout. Gains above $1.30 or losses below $1.10 will shape the short-term trend.
Resistance level to watch out for: $1.30
Support level to watch out for: $1.10
Disclaimer: Opinions expressed are not investment advice. Do your research.

#Polygon Finds Support at $1.30, Is The Bull Run Over?Past Performance of Polygon
Despite the contraction of the past few days, Polygon is trading above November highs, and looks firm. The coin is up roughly 80 percent from December lows, and trading above the middle BB, signaling strength. Per the current setup, support lies at $1.30.
#Polygon Technical Analysis
The overvaluation of February 18 is being corrected in a move that has seen bears wipe out gains of February 17. Despite the cool-off, the primary trend remains bullish. This will hold especially if MATIC prices are still above $1.30 by the close of this week. After an impressive surge from December 2022 lows, the retracement was expected. The trend will continue if there are fresh gains above $1.60, with expanding volumes. Meanwhile, losses below $1.30 may spark a sell-off, forcing MATIC towards $1.15 and later $0.95, which are critical support lines of the December to February trade range.
What to Expect from #MATIC?
Traders should watch out for the middle BB, the flexible support line. A breakout below this level may set the base for a leg down in an inevitable correction. Specifically, how MATIC reacts at November 2022 high at $1.30 is important in the near term.
Resistance level to watch out for: $1.60
Support level to watch out for: $1.30
Disclaimer: Opinions expressed are not investment advice. Do your research.

Polygon Long TermJudging by the moving averages on the weekly timeframe, closing the week below $0.75 will pull us to the level of $0.62. Conversely, staying above the $0.90 resistance is essential for a sustained rise to start. Closing this week with a green candle could target the $0.90 resistance.

#Polygon is bullish, but MATIC Has Support at $0.76Past Performance of Polygon
Like the rest of the markets, MATIC is in range, moving horizontally without a defined short-term trend. From a top-down preview, buyers have the upper charge if the H2 2022 price action leads. The immediate support line is around $0.76, while resistance is at $0.93 and $1, respectively.
#Polygon Technical Analysis
Presently, MATIC prices are in a tight consolidation. Although prices are below the middle BB, trending lower, there have been higher highs relative to the lower BB, with support at $0.76. MATIC is currently inside the bear bar of December 19, influenced by sellers of December 16, as a bear flag prints. Traders can stay neutral if prices are above $0.76 but below $0.83. A break out above December 19 bar may see MATIC float to $0.93 in a welcomed bullish formation. Conversely, losses below $0.76 could see MATIC fall to September lows of $0.70.
What to Expect from #MATIC?
MATIC is bullish at spot rates, but there must be a definitive close above $0.83 for prices to recover, ideally to November highs. However, if there are losses below $0.76, the coin could tumble to September lows as bears press on.
Resistance level to watch out for: $0.83
Support level to watch out for: $0.76
Disclaimer: Opinions expressed are not investment advice. Do your research.

MATIC/USDT WEEKLYHello traders, a new week is upon us!
#MATIC update with a look at the weekly candles.
We have formed a bearish engulfing candle formation after which a move down is very likely.
I will definitely look for short entries on the smaller time frames after the confirmation of the trend down to levels around 0.59.
Dollar Index in today London session lifted and currently goes up, if it breaks the current recent last low and maintains this level, this prediction could be confirmed

#Polygon Soars 28% From Q3 Lows, Will MATIC Breach $1?Past Performance of Polygon
Polygon could be up 28 percent from September lows, but bears are still in a commanding position. Overly, MATIC is bearish from a top-down preview and consolidating below $1. As long as the coin is trending below this psychological liquidation level and trading volumes are suppressed, traders can search for entries to liquidate. This preview can only shift once there are gains above $0.95, with traders confirming gains of late November 2022.
#Polygon Technical Analysis
At present, MATIC is consolidating. The path of least resistance in the short term appears northwards. The immediate resistance level is at $0.95, while support remains at $0.88. The optimism stems from the fact that prices are inside the November 30 bullish engulfing bar. From an effort-versus-result perspective, this is bullish, especially now that the recent bars driving MATIC lower are with low volumes. A close above $0.95 may see prices rise, roaring towards $1 in continuation of late November surges. Conversely, if MATIC sellers force prices lower, the coin could crumble, sinking to $0.80 or worse.
What to Expect from #MATIC?
Polygon is propped by solid fundamentals, looking at the performance in the daily chart. All the same, like the rest of the crypto assets, MATIC is under pressure. Ideally, a close above $1 will trigger demand. But before then, the main resistance level lies at $0.95.
Resistance level to watch out for: $0.95
Support level to watch out for: $0.88
Disclaimer: Opinions expressed are not investment advice. Do your research.
