Polygon Matic price don't give up and trying growthLet's start the idea of MATICUSDT by thinking about why we should draw medium-term estimates of possible price movements.
Here is our medium-term idea for MATICUSDT, which we published 6 months ago.
Back then, we clearly described two scenarios and under what conditions to stick to one or the other. There is an action plan, there are critical points of activation of one of the scenarios, and it remains to trade in the right direction. And then, like everyone else, we had no idea that someone would think of classifying MATIC as a "security" and that this would cause the price to crash.
You can easily test the idea)
In the short term, the MATICUSD price is approaching a strong liquidity zone around $0.73, which has been acting as support for a long time, so probably it will not be possible to break it up at the first attempt.
A slight correction will follow, and the second time around, you can try to break through to the top of the channel at $0.83
_____________________
Did you like our analysis? Leave a comment, like, and follow to get more
Polygonmatic

Polygon (MATIC) Bull ScenarioDo you think Altcoins will stall when Bitcoin starts running? If you think the alts will walk too, I can talk to you about MATIC.
In my opinion, I think we are in the days when we have the last opportunity to buy MATIC, which will be the star of the next bull season.
As you can see on the black lines, MATIC, which made the symmetrical triangle it made in the past, entered short-term downtrends 2 times within this symmetrical triangle (Orange line) and after the second break, the bull run started. We are on the eve of this process.
In the two symmetrical triangle patterns, we can see that MATIC is spending a lot of time inside the 0.382 and 0.618 levels of Fibonacci retracement. (Purple Boxes)
In addition, the bottoms and tops that form the symmetrical triangle in both patterns are made at the same Fibonacci levels. This is another indication that the two patterns are very similar. (Red arrow and circles)
Therefore, when we look at the Fibonacci levels again, we can see that when the bull season is entered, the targets will be $10 and $87, respectively. This means 1672% when the first target arrives; In the second target, a profit of 14000% will be obtained.
Since the risk/reward ratio in this scenario fits my trading style and strategy, I made my first purchase at this level. I will add when the orange resistance is broken and retested, and I will add my position at the retest after the triangle break (black) and wait for the $87 level.

MATIC STRONG BEARISH Falling KnifeTrend stron bearish
RSI Momentum below 50 strong bearish
Nearish Volume rising
Support will break soon
Matic will fall deeper
ADA, MATIC, SOL face the music as Robinhood delists tokens
Hours after Robinhood delisted ADA, MATIC, and SOL, the price action of the tokens was not what participants would have hoped for.
The decision to end support for the tokens caused a $387 million wipeout from the crypto market.
Several indicators revealed that ADA, SOL, and MATIC’s momentum were bearish.
The prices of Cardano , Polygon , and Solana tumbled in double-digit figures after Robinhood confirmed that it was delisting the tokens from its platform.
While the U.S. trading platform did not give cogent reasons for its decision, speculation went around that it was linked to the recent SEC “unregistered securities” tag.
Unlike recently targeted exchanges like Binance and Coinbase, Robinhood is duly regulated by the SEC. Hence, it could have been necessary to take such action.
Regulatory fear leads traders to liquidation
In its statement, Robinhood noted that no other coins were affected. But holders of the ADA, SOL, and MATIC had until 27 June to stop transacting the tokens.
As the sudden move sent shockwaves through the crypto market, the implication of the decision revealed itself.
According to CoinMarketCap, SOL’s value decreased by 22.47% in the last 24 hours. ADA could not escape the heat, registering a 23.06% decrease. As for MATIC, it was down by 26.12% within the same period.
Because of the significant decline in the prices of these tokens, liquidations in the past 24 hours surged to $387 million, with longs suffering the most.
Based on the liquidation heatmap from Coinglass above, SOL accounted for $15.15 million out of the total wipeout. MATIC’S liquidation went up to $8.54 million, while ADA was $15.87 million.
Red season for the cohort
Meanwhile, an evaluation of the ADA/USD daily chart showed that the token’s momentum had breached the oversold region, as indicated by the Relative Strength Index (RSI).
At 17.21, the RSI showed that selling pressure was tremendous. Thus, the momentum was bearish, and slight buying power might do almost nothing to save the price action from the press time state.
The daily timeframe of MATIC was not any better. This was because the Awesome Oscillator (AO) was down to -0.1139. Thus, AO crossing into the negative territory indicated a bearish signal.

💥MATICUSDT 4H-TIMEFRAME ANALYSIS💥MATICUSDT 4H-TIMEFRAME ANALYSIS
💗Hello ladies and gentlemen
This is my new idea for 💥MATIC Polygon
I hope my idea is clear
Support me by like and share thank you
Stay Safe💯💲💲💲
Good luck💰😍

Robinhood will delist Polygon MATICIf you haven`t sold MATIC here:
Then you should know that Robinhood, the well-known trading platform, will discontinue its support for three cryptocurrencies implicated in SEC lawsuits against Binance and Coinbase.
Effective from June 27, 2023, Robinhood will no longer provide support for Cardano (ADA), Polygon (MATIC), and Solana (SOL).
In My opinion MATIC will test the support of $0.50.
Looking forward to read your opinion about it.

MATIC - Are we Going to DOUBLE BOTTOM!!KUCOIN:MATICUSDT
CRYPTOCAP:BTC sitting in the huge Head & Shoulders provides ideas for possible downside.
You can see my idea here: tinyurl.com
Price action is lurking around below the neckline after breaking it. Possibly a build up.
Once it moves we activate our plan.
CRYPTOCAP:MATIC looks interesting sitting in a Falling Wedge and could we get a Double Botton for upside break or
would we need to wait for this at the Possible Pullback level should CRYPTOCAP:BTC breakdown.
My regular followers know I like to have a Plan for my Long and Short but with clear Action and Trigger points so that I can execute like a bot and play my edge.
Always having Plan A and Plan B scenarios so we can react once the markets provide an opportunity to execute our edge.
If you liked this idea or if you have your own opinion about it, write in the comments.
The information and publications are not meant to be, and do not constitute, financial, investment, trading, or other types of advice or recommendations

Polygon Falling Wedge FormationIn MATIC, a very clear falling wedge formation can be seen in the daily timeframe.
At the same time, MATIC, which is based on 0.75 support, can break the falling wedge if it is rejected from this support.
Once the wedge is broken up, the first target will be $1.19 and the main target will be $1.60.

Polygon MATIC price beckons to buy, but where?)Exactly 3 months have passed since the publication of the idea with our global vision of possible movements of the MATICUSDT price.
The first part of the idea has clearly worked out the $1.50 target, and the second part of the idea with a correction to $0.5 now looks unlikely.
It is more realistic to assume that the "buyer" who did not allow the MATICUSD price to fall below $0.70-0.80 during the second half of 2022 will not allow this to happen in the near future.
Therefore, we consider the $0.70-0.80 zone to be ideal for buying MATIC into the medium- and long-term portfolios with the first take profit not earlier than $2.50
_____________________
Did you like our analysis? Leave a comment, like, and follow to get more

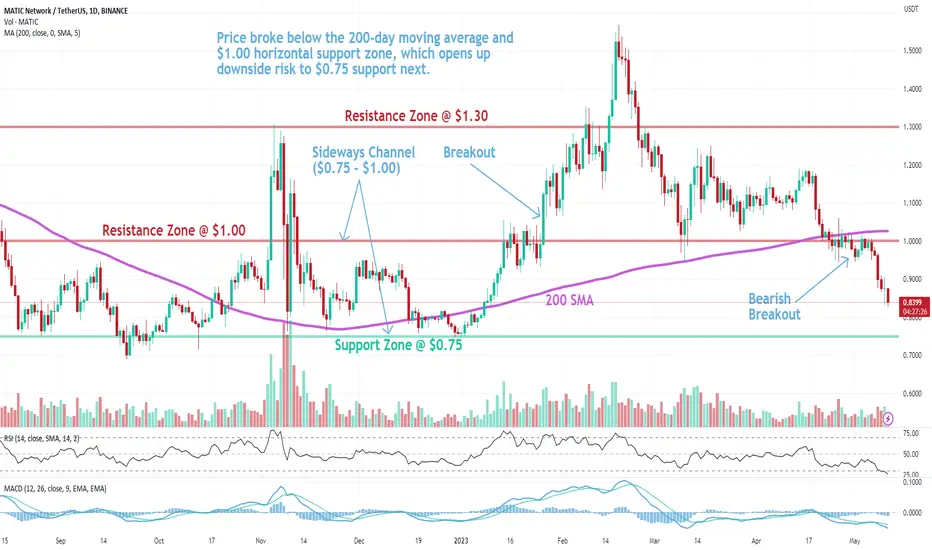
MATIC: Support BreakoutPolygon (MATIC) technical analysis:
Trade setup : Price broke below the 200-day moving average and $1.00 horizontal support zone, which opens up downside risk to $0.75 support next.
Trend : Downtrend across all time horizons (Short- Medium- and Long-Term).
Momentum is Bearish (MACD Line is below MACD Signal Line, and RSI is below 45).
Support and Resistance : Nearest Support Zone is $0.75. The nearest Resistance Zone is $1.00 (previous support), then $1.30.
Polygon (MATIC) formed bullish Gartley for upto 91% rallyHi dear friends hope you are well and welcome to the new trade setup of Polygon (MATIC) with US Dollar pair.
Previously I shared a long-term trade setup for MATIC which produced more than 246% rally as below:
Now on a weekly time frame, MATIC has formed a bullish Gartley pattern for the next price reversal.
Note: Above idea is for educational purpose only. It is advised to diversify and strictly follow the stop loss, and don't get stuck with trade

Polygon [MATIC] will see more sell pressure below $0.9780Price action faced rejection at the bearish OB on the 2-hour chart at $1.0140 and dropped to bullish OB at $0.9854 (cyan).
A close below the support (cyan) and confirmed downtrend could push MATIC to $0.9515 ( a bullish OB on the daily timeframe).
The RSI and OBV dipped - buying pressure eased. But RSI was in a neutral position.
Entry: $0.9780 (below bullish OB)
Exit/target: $0.9515 (lower support)
Stop-loss: $0.9865 (above the bullish OB)
R:R - 3

MATICUSDT, key zones to watch and next move. UpdateHello guys, This is an update of previous analysis (blow link). Everything is explained on the chart for you like always. The price is currently moving as we expected and finally broke its major resistance and retesting that to change it to a support base band then continue to reach the second target. The targets will be 1.6 and 1.7 .
Good luck.
If you like the idea, do not forget to support with a like and follow me for next analysis :)
Write your comment and opinion below to me

$Matic - End of PUMP Era - Retest $0.3Matic printing BEAR FLAG pattern just like $BTC did Jan-Apr 2022 (TERRA LUNA COLLAPSE)
POLYGON had already gone through big announcements and finally Sell the HYPE?
And ARBITRUM taking the edge over POLYGON
Complacency Phase. Expecting New All Time Low

Polygon MATIC price will double or halve its value in few monthFinally, altcoins have started their upward movement, most of the ideas we have published on different coins over the past 2–3 weeks are in the process of working out the targets.
But the MATICUSDT price did not grow much on the crypto market in the last few days. In fact, the MATIC price was one of the first to break out of the downward trend in the summer of 2022 and has been in a protracted consolidation since then.
The way out of such consolidation will be a powerful impulse movement that will double the value of the Polygon token or halve it.
Therefore, it is very important to monitor the behavior of the MATICUSDT price around $0.75.
Another holding of the price above this level will increase the chance of starting growth to $1.50 per MATIC
However, if sellers can easily push and fix the price below $0.70-0.75, then this will be a signal that keeping MATIC in your portfolio may be unprofitable. After all, because of such conditions, an almost unobstructed path will open for the price to fall to 0.44
_____________________
Did you like our analysis? Leave a comment, like, and follow to get more


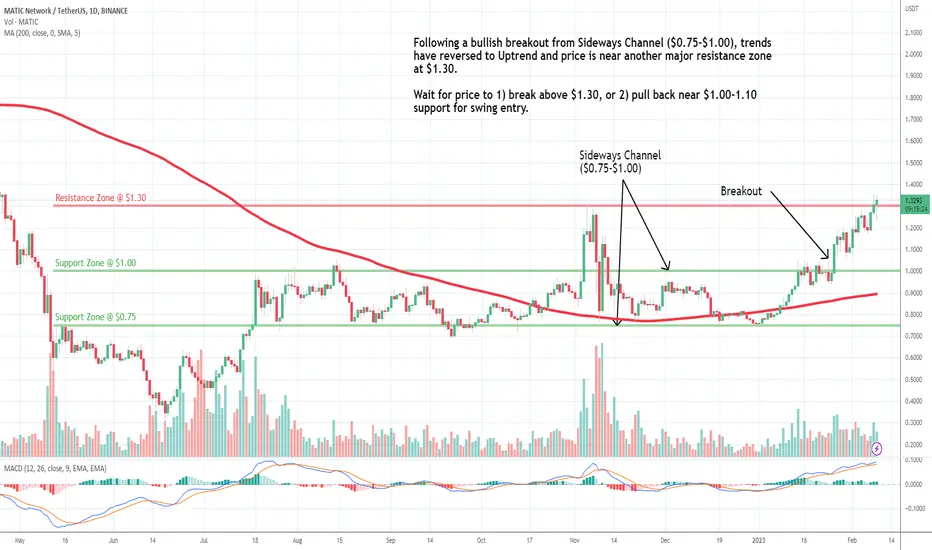
MATIC: Approaching ResistancePolygon (MATIC) technical analysis:
Trade setup : Following a bullish breakout from Sideways Channel ($0.75-$1.00), trends have reversed to Uptrend and price is near another major resistance zone at $1.30. wait for price to 1) break above $1.30, or 2) pull back near $1.00-1.10 support for swing entry.
Trend : Uptrend across all time horizons (Short- Medium- and Long-Term).
Momentum is Bullish but inflecting. MACD Line is above MACD Signal Line and RSI is above 55 but momentum may have peaked since MACD Histogram bars are declining, which suggests that momentum is weakening.
Support and Resistance : Nearest Support Zone is $1.00 (previous resistance), then $0.75. The nearest Resistance Zone is $1.30.
MATICUSDT, key zones to watch and next move. UpdateHello guys, This is an update of previous analysis (blow link). Everything is explained on the chart for you like always. The price is currently moving as we expected and reached first target with 48%. So you can manage your positions and it's better to save profits because of major resistance, divergence in RSI and market's sentiment. Then continue to reach the second target. The targets will be 1.6 and 1.7 .
Good luck.
If you like the idea, do not forget to support with a like and follow me for next analysis :)
Write your comment and opinion below to me

POLYGON MATIC SHORT TRADE Heres a Quick SHORT SETUP
entry - 1.1718
stop-loss 1.922
Take profit 1.112

MATICUSDT, key zones to watch and next move. UpdateHello guys, This is an update of previous analysis (blow link). Everything is explained on the chart for you like always. The price is currently moving as we expected, So you can manage your positions and profits until you reach the first target. Consider that the market is dispose to small correction. The targets will be 1.3 and 1.7 .
Good luck.
If you like the idea, do not forget to support with a like and follow me for next analysis :)
Write your comment and opinion below to me

Thanks for all the trades $MATIC! Was great last few monthsI like $MATIC, A LOT
It should keep pumping BUT we moved the funds elsewhere
Wasn't done today. This was done close to $1 about a week ago, posted elsewhere
While #MATICUSDT has done well, 10%, the money has performed better elsewhere
You were great old friend, the best during the bear and last few months but looking for more BETA
#metaverse #crypto #NFT

MATICUSDT, key zones to watch and next move. UpdateHello guys, This is an update of previous analysis (blow link). Everything is explained on the chart for you like always. We said that the price has the potential to break its resistance and now the resistance is broken and IF the pullback is confirmed, it will continue to reach the target. The targets will be 1.3 and 1.7 .
Good luck.
If you like the idea, do not forget to support with a like and follow me for next analysis :)
Write your comment and opinion below to me

MATICUSDT, key zones to watch and next moveHello guys, Everything is explained on the chart for you like always. Matic is below a strong resistance zone for now but has the potential to break it. Possible and expected next move and targets are explained to you. The targets will be 1.3 and 1.7 .
Good luck.
If you like the idea, do not forget to support with a like and follow me for next analysis :)
Write your comment and opinion below to me

$ADA looks good, not crazy of project but should pump with $BTCSold 1/2 $MATIC close highs, was going to rebuy
Just saying, we go back to highs
It's 3x, not bad but NOT what I'm looking for in Bull
$ADA = 10x, still NOT what I want but better
However, which has likelihood getting to highs?
Feel dirty buying this😄
#crypto #ADA #MATIC
