POLUSDT Bullish🔍 BINANCE:POLUSDT Technical Outlook – May 16 🔍
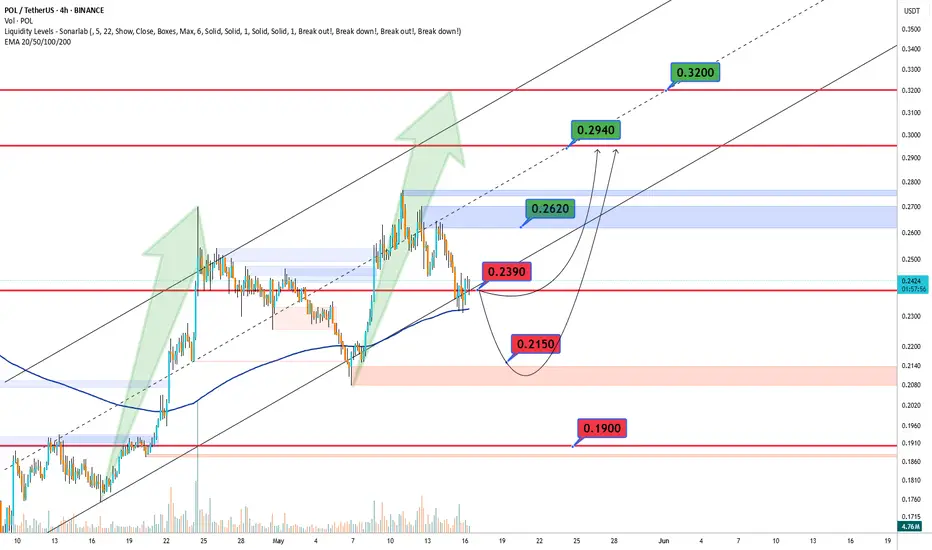
Bulls are watching the key $0.2390 level! 🔼
If broken, we could see a rally towards $0.2620, then $0.2940, and even $0.3200 if momentum stays strong 🚀
But if price gets rejected... 👀
Watch support at $0.2150 – and if that fails, $0.1900 could be next 🛑
📊 Current zones to watch:
🔴 Resistance: $0.2620 | $0.2940 | $0.3200
🟢 Support: $0.2390 | $0.2150 | $0.1900
Polymetal
Polymath (POLY) formed big bullish Gartley for upto 966% rallyHi dear friends, hope you are well and welcome to the new trade setup of Polymath (POLY).
After the previous major drop of 2020, I shared the below harmonic move with you and Poly surged more than 750%
Now after the current major drop, on a weekly time frame, Poly has formed a bullish Gartley pattern:
Note: Above idea is for educational purpose only. It is advised to diversify and strictly follow the stop loss, and don't get stuck with trade

POLY DOWN1. Diagonal Fibbonachi
2. Downward price movement
3. RSI > 80%
4. Economic recovery
5. Bitcoin is in demand

#POLY short signal on break of EMA200.Wave C of A-B-C formation is likely in development.
200EMA worked well as a support during the past 4 weeks.
Short #POLY if 1620 level doesn't hold on daily (and subsequently RSI upward trend is broken) with targets:
1490 (100% Fibo and a descending chanel low boundary) - most likely.
1207 (161.8% Fibo and a long time support trend line going through Oct'18, May'19 and Mar'20 lows).

POLY Trading AdviceBuy Price: Yellow Line
TP: Green Lines
Moon: White Line
Support: Blue Line
SL: Red Line (I don't recommend you to sell in loss.)
Invest Suggestion: 5-10 Percent
Profit Expectations: 5, 10 or >20 Percent
Just hold and watch. Sell when you get some profit. Good Luck!
Looks Good? Leave a like, share and tell me in comments if my trading advices are working for you.
Thanks for visiting.
