Review and plan for 7th July 2025 Nifty future and banknifty future analysis and intraday plan.
Swing ideas.
This video is for information/education purpose only. you are 100% responsible for any actions you take by reading/viewing this post.
please consult your financial advisor before taking any action.
----Vinaykumar hiremath, CMT
Positional

Review and plan for 11th June 2025 Nifty future and banknifty future analysis and intraday plan.
Positional ideas.
This video is for information/education purpose only. you are 100% responsible for any actions you take by reading/viewing this post.
please consult your financial advisor before taking any action.
----Vinaykumar hiremath, CMT

Review and plan for 10th June 2025 Nifty future and banknifty future analysis and intraday plan.
Positional ideas.
This video is for information/education purpose only. you are 100% responsible for any actions you take by reading/viewing this post.
please consult your financial advisor before taking any action.
----Vinaykumar hiremath, CMT

SAMHIi Observed these Levels based on Price Action and Demand & Supply which is my own Concept "PENDAM CONCEPTS"... Please don't take any trades based on this chart/post... Because this chart is for educational purpose only not for Buy or Sell Recommendation... Thank Q

BSOFTi Observed these Levels based on Price Action and Demand & Supply which is my own Concept "PENDAM CONCEPTS"... Please don't take any trades based on this chart/post... Because this chart is for educational purpose only not for Buy or Sell Recommendation... Thank Q

TEXRAILi Observed these Levels based on Price Action and Demand & Supply which is my own Concept "PENDAM CONCEPTS"... Please don't take any trades based on this chart/post... Because this chart is for educational purpose only not for Buy or Sell Recommendation... Thank Q

MARUTIi Observed these Levels based on Price Action and Demand & Supply which is my own Concept "PENDAM CONCEPTS"... Please don't take any trades based on this chart/post... Because this chart is for educational purpose only not for Buy or Sell Recommendation... Thank Q

Delhivery seems to be at a good bargain Price Delhivery seems to be at a good bargain Price. This is a long term positional opportunity.
Note: This is not a recommendation. Markets are falling, do consult an investment advisor before making any investments.

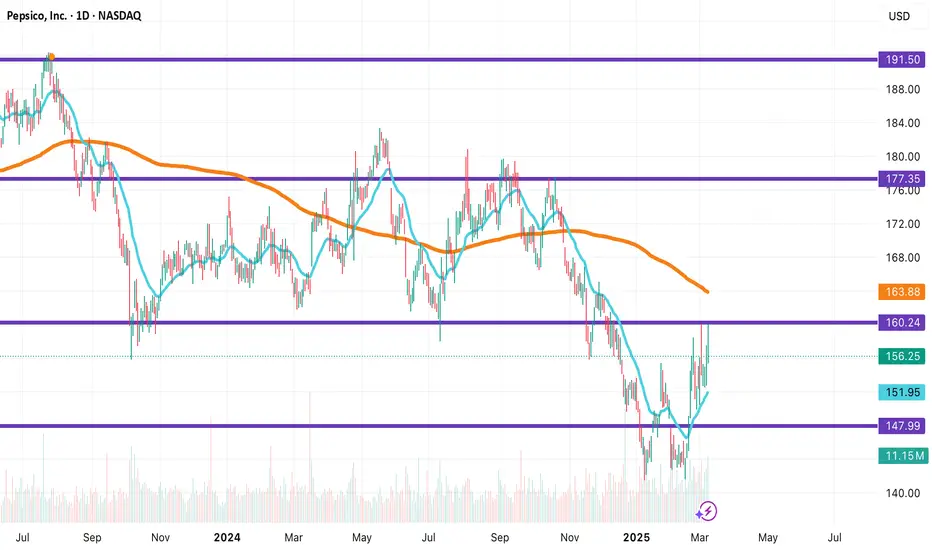
PepsiCo (PEP) – A Strong Long Setup for 2025📈 Ticker: PEP
📊 Timeframe: Swing trade (3-6 months)
🎯 Target Price: $190 - $200
⏳ Entry Zone: $160 - $165
🛑 Stop Loss: $148
🔹 Thesis for the Long Trade
PepsiCo (PEP) is a defensive consumer staple stock with strong brand power, consistent revenue growth, and a resilient business model. As market volatility increases due to macroeconomic concerns, investors tend to rotate into high-quality dividend-paying stocks like PEP.
Despite some near-term pressure from inflation and shifting consumer preferences, PepsiCo’s diversified portfolio (beverages & snacks) and global expansion efforts continue to support long-term growth.
Probabilistic thinking. Using Technical logic to get odds.Markets are simple if you think about it.
moderate and long range resistance -- is the best odds for rally.
"horizontal" or 50-50 supports -- risky.
steep supports mean high demand, strong trends. Buying at such supports, at worst it bounces to the upside. (High market with strong trend can mean reversals)
rule: break outs always must coincide with 200dma rallies.
Bonus.
High market, strong trend -- best odds for reversal .
50-50 resistance, with weak support --> trickster market. (trap)
strong trend but no flying 200dma --> trap.
50-50 resistance with strong trend, high market, but weak 200dma ---> good odds for reversal.
keeping it simple.
P.S. this method shows why odds favor BTC reversal . Or why 110/120k had to be peak point. for now.

RENUKAi Observed these Levels based on Price Action and Demand & Supply which is my own Concept "PENDAM CONCEPTS"... Please don't take any trades based on this chart/post... Because this chart is for educational purpose only not for Buy or Sell Recommendation... Thank Q

LTFi Observed these Levels based on Price Action and Demand & Supply which is my own Concept "PENDAM CONCEPTS"... Please don't take any trades based on this chart/post... Because this chart is for educational purpose only not for Buy or Sell Recommendation... Thank Q

BALRAMCHINi Observed these Levels based on Price Action and Demand & Supply which is my own Concept "PENDAM CONCEPTS"... Please don't take any trades based on this chart/post... Because this chart is for educational purpose only not for Buy or Sell Recommendation... Thank Q

RELIANCEHi guys,
In this chart i Found a Demand Zone in RELIANCE CHART for Positional entry,
Observed these Levels based on price action and Demand & Supply.
*Don't Take any trades based on this Picture.
... because this chart is for educational purpose only not for Buy or Sell Recommendation..
Thank you

UJJIVANSFBHi guys,
In this chart i Found a Demand Zone in UJJIVANSFB CHART for Positional entry,
Observed these Levels based on price action and Demand & Supply.
*Don't Take any trades based on this Picture.
... because this chart is for educational purpose only not for Buy or Sell Recommendation..
Thank you

Review and plan for 11th December 2024 Nifty future and banknifty future analysis and intraday plan.
Stock- swing trading.
This video is for information/education purpose only. you are 100% responsible for any actions you take by reading/viewing this post.
please consult your financial advisor before taking any action.
----Vinaykumar hiremath, CMT


MIDHANIHi guys,
In this chart i Found a Demand Zone in MIDHANI CHART for Positional entry,
Observed these Levels based on price action and Demand & Supply.
*Don't Take any trades based on this Picture.
... because this chart is for educational purpose only not for Buy or Sell Recommendation..
Thank you

SOLANA BIG BREAKOUT
SOLANA breaking out cup and handle pattern long consolidation currently retesting breakout level good tym to buy some
Targets- 300 350 400
hold for few months

BANKNIFTYHi guys,
In this chart i Found a Demand Zone in BANKNIFTY CHART for Positional entry,
Observed these Levels based on price action and Demand & Supply.
*Don't Take any trades based on this Picture.
... because this chart is for educational purpose only not for Buy or Sell Recommendation..
Thank you

NIFTYHi guys,
In this chart i Found a Demand Zone in NIFTY CHART for Positional entry,
Observed these Levels based on price action and Demand & Supply.
*Don't Take any trades based on this Picture.
... because this chart is for educational purpose only not for Buy or Sell Recommendation..
Thank you

SWING TRADE HFCL
HFCL looks good above 152 breaking out with volumes creating higher and higher low moving in a uptrend momentum consolidating just before breakout can be good swing trade.
