EUR/JPY LONGFollowing positive consumer and industrial confidence reports , business climate and industrial sentiment gives us a strong fundamental positive outlook on EUR. On the technical line we have multiple confirmations
1-Daily and 1H MA match
2-RSI 6 below 20
3-Price rejecting 3rd touch trend line plus previous high test in/between MA`s
4-Price rejecting 0.5 Fib retracement from last significant low
5-Good risk-reward probability 2:1
Positive

Bitcoin BTCUSD Still positive above 15485Bitcoin Update
So far today Bitcoin has rallied to the next restistance line at
16447 after a high at 16487 but has since fallen away again,
coming back close to important support at at 15574-15485
(amended to cover yesterday's price action better). It's a buy
in this range with stops below 15450. Above here the trend is
still positive but any break below 15450 will tip Bitcoin back
into negative territory and should force it back to the two
parallels below and potentially back to 14844 before it rallies
again. If we see this price action will look to get long again
from lower levels. Overall Bitcoin looks positive still and so
long as 15450 continues to hold it should rally through the
blue lines above it to 17229 and higher as the day progresses.
Look to get long on dips from as close to 15485 as possible
over the next couple of hours, most likely.

BCHUSD: Next Trade set-ups ahead of weekendBCHUSD Next Trade Set-ups ahead of Weekend
This was left as a short backk to 1180-1100 range and with a subsequent low at 1152 it did ok. Obviously the slick trader
will not just close out if the last trade has gone to plan, he (and increasingly frequently, she) will naturally seek to
reverse, with stops underneath and see what comes. If you managed this here you are a star trader in the making (good
traders close out when targets are reached, great ones reverse: who said that?) Anway those who managed the trick
or just got long somewhere around the lows have already seen over 20% gains since yesterday. This market is just
unbelievable. You can compound money faster than ever before in history 24/7. Still find it astounding that the biggest
crap shoot in history is still playing very time we get up, just a button away.
BCH is trading in a little wave from the lows, good green showing, bear engulfing those hours of backing and filling in
minutes...but it's reached close to the limits of its neat term upside potential and meets a crossroads at 1415 where 3 lines
converge, so it's understandable that BCH is shying away from here, being sold off at the natural spot, or just under in fact
so far. If long here it'sthe obvious spot to close out and bank gains and then look to buy from lower and/or add once 1415
is broken to the upside. This will free up the space above and let BCH have a damn good weekend in prospect, opening the
way for a move up to 1516-1539 initially and way above here in medium term, most likely.
In near term whilst BCH continues to track within the impulse wave (loosely defined, so far, early days) it's trend will remain
positive. Buy any dips towards the lower parallel if seen - if not it's strong, isn't it? - so buy again on the break above 1415
with stops 50 below

Bitcoin: BTCUSD Overall Still Still Positive at higher levelsOverall dull right now but with a positive undertone, still,
at these levels. We look to buy from lower, closer to 7531 if
touched or, if very lucky, on any sharp fast test of the lower
parallel which would also be viewed as an excellent buying
opportunity, should we be lucky enough to see it later in
China/London on Monday. Unlikely, but it's Bitcoin.
If unsuccesful from lower levels the next buy point will come
on a break above that upper parallel with stops under 7700.

Bitcoin: BTCUSD Key levels today -7717 the likely pivot for dayBitcoin: BTCUSD Update Range trading for now but overall positive above 7717
A good space for day traders, trading between the lines of support and resistance, which continue to work quite well, so
far, just as they have done over the last couple of weeks now. But for swing traders Bitcoin gave the first unreliable
technical signal for quite a while - that break below 7531 was the first heart-breaker, the first time this beautiful creature
has let us down, technically speaking, for a long time...and it's looking more and more false as each minute ticks away now.
Day traders at least had the next support line at 7426 to close out shorts, but swing traders looking to short off the next
rally back to 7531 (with stops 50 points above) - a technically sound trade - will have been swept away. Apologies.
Even more annoying, with all this price action overnight there was no guidance to get long again and buys at 7531 had
already likely been stopped out - so many have missed a large part of this move up from 7531 now, me too, and it's extremely
frustrating and annoying. Occasionally Bitcoin can mess with the best laid plans for the weekend.
We are where we are. Back on the trail.
Looks like it will grind away to the top at 7990-8000 again. Thankfully it's trading back above 7717, the freezer lid level
which will continue to play an important role this weekend. Whilst above here Bitcoin is still wanted, but under that line
not so much. As bears won the day in the end yesterday and China did indeed drive the price lower through the first
couple of hours of their session, but that break below 7531 screwed up a perfect entry for this next challenge on the
highs. Damn. Move on. Play the range on low volumes or await a possible break above 8000, which will need high
volume to make it happen. Probably only Chinese buying power can achieve this over a weekend, so the first couple
of hours of their seession could pay dividends, maybe...
Bitcoin is positive above 7717 and whilst above here will try to grind towards the highs where it becomes
a sell again for day traders playing the range. And if at some point we see 8000 broken, it should be followed, as per
weekend breakout (last comment). The space between 7717 and 8000 belongs to day traders. As is the space below 7717
down to 7531. So 7717 is now the likely pivot for the day - should this fail at any point later it turns negative again in
near term back to 7531 - where it becomes a buy again with stops 50 points below. Because of that signal break below
7531 it makes 7717 even more important for Bitcoin from here. It really is the freezer lid today by look of things.
All good above, potentially turning over into bad below.

NAS100: NASDAQ 100 Looking positive for week aheadNasdaq 100 Index NAS100
Nasdaq throws a lot of similar shapes to Bitcoin whose
consolidation periods tend to last a few hours and no
longer than 2 days maximum, but here the continuation
patterns last a minimum of 2 days (last one) and more
usually 8 days and up to a month. But the shapes are almost identical.
Fast, sharp declines over 2 days, followed by an immediate
rally into new high ground are a sign of a very strong
market, usually a confirmation signal of further strength ahead.
In addition, the pattern carved out on the chart over the
past week is a clear flag formation with a minimum upside
measurement target at 6472, and could easily extend
further to 6515. Look to get long for the early part of this
week at least:
Initial support begins at the recent high at 6282-0. Whilst
it can hold up here this index is extremely positive...so
long as this level holds tomorrow Nasdaq is expected to
have a stellar week ahead. It's a buy with stops under 6275
for a 20 point loss if wrong. Or wait for the open on
Monday to see that 6275 holds up first...but it may have
gapped up by then. If so follow it, though with stops still
below 6275. And if this trade goes wrong and 6275 fails to
hold at any point between now and the open it's likely to
drift further and then perhaps come off on the open to
6246 (at lowest a spike to the upper parallel just below
here) before rallying strongly again.
That looks to be worst case scenario, which looks less
likely than a gap up as things stand right now.
One other way to enter the trade is to put a buy order in
at 6283 and hope it gets struck overnight with a tight stop
11-15 points under for small loss if wrong but 200 to 300 -
points upside if right. If it gets stopped out look to re-
enter again around the open on any further weakness in
the first 5 to 30 minutes, ideally towards 6246 and a tad
lower - but this is only likely if 6282-6275 gives way.
Don't think it will for what it's worth...let's see
For more on Positive 16 Year Cycle:
Dow-and-S-P-500-DOWI-SPX500-Super-long-term-Chart-and-
analysis/

DOWG: Dow Global: All major markets positive whilst above 2950DOWG: Dow Global This index is extremely useful as confirmation/back-up for all other major market trades as it's so free of false signals compared to Nasdaq for example. It's just tested and bounced from near term support at 2950 today. Whilst above here major markets across the world will remain positive. It's that simple on this index. That's why it's so damn useful. Hope you find it helpful!

Something has to die in order for something new to be born...BTC"And the fact that bitcoin is consistently growing in its use and its value has to say something — Sure it will rise and fall as all new technologies are. But at the same time, it is certainly not a fraud." – John McAfee
"Guys like Dimon believe they own the system — They are the great intermediaries. The masters of the monetary universe. No one gets in the system or out of the system without their knowledge and permission. So it has been for thousands of years — Bitcoin changes all that." - Jeffrey Tucker
"The bank CEO (Jamie Dimon) who had to pay $13 billion for causing the housing crisis just called Bitcoin a fraud
I've literally seen it all" twitter.com

$I Intelstat Bearish TrendNYSE:I
Expecting uptrend to continue to challenge previous neck resistance of 4.46. If it breaks resistance, look for positive uptrend to continue.

AUD / USD Bullish My bias for aud/usd is bullish.
I was shorting this pair 2 times this week with small positive outcome. But bears have difficulties to push down, and we are entering bull area which means that there is better chance to go long than short. Enter at lows and take profit at last highs as showed in the chart.


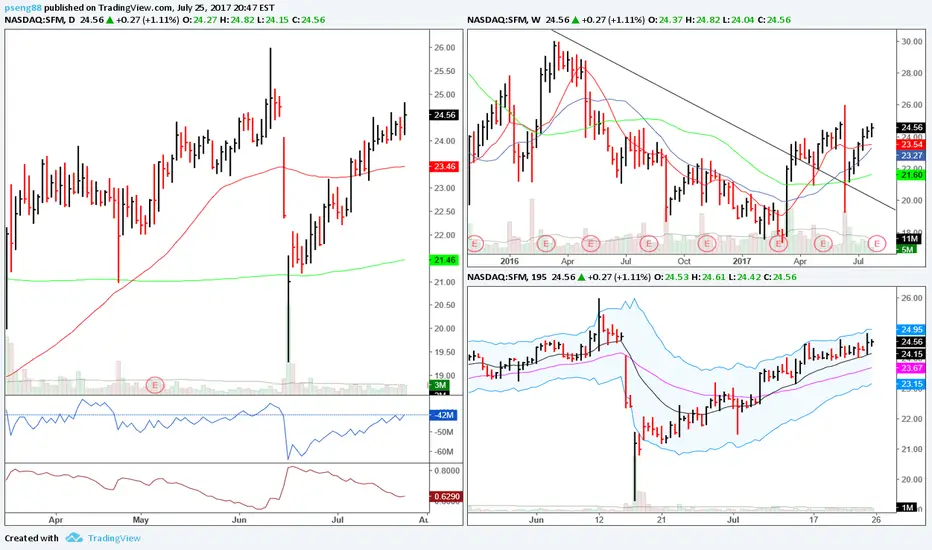
$SFM Long Term HoldWeekly breaking out of downtrend line and holding
Daily timeframe showing positive price action with increasing buying pressure
new 50 day highs with above average volume!
AUDUSD : Positive SignalsAUDUSD is trading above all short term moving averages on 4 hourly charts. RSI and ADX are also showing upwards direction.
One can go long around 0.7570 levels with stop loss of 0.75350 for Target of 0.7625

$ADSK trend continuationhigher time frame is in defined uptrend with healthy pullback
mid time frame is showing a rising ma after minor accumulation and weakening downtrend breaking out of downtrend line with positive momentum and volume pressure
lower time frame is showing positive strength after price was overextended and pullback to intermediate moving average and working it way back up
looking for price to break through the 106.1x resistance area and first target to 106.7x for a break of that resistance higher

$baba falling wedge breakout higher time frame in defined uptrend with positive trend strength
mid time frame showing continuation pattern in form of falling wedge=potential to breakout or breakdown continuing en route to apex
lower time frame showing bullish price action making higher highs and lows as it test resistance area of 135.3x area
first target 136.6x area and if broken next target to 138.4x

14/06/2017 AUD/USD AnalysisA high positive change in the number of people employed in Australia, push the AUD upwards, keeping a continuation in the upward trend that maintains for several days. www.investing.com

rai inverse head and shoulder breakouthigher timeframe showing strong uptrend and excellent trend strength
intermediate timeframe showing trend alignment and showed the breakout of resistance area 67.0x area after completing inverse h and s pattern with strong positive volume pressure
measured move from head of pattern to neckline is a .55 move which should give projected target of 67.55 and extension level .618 at 67.8x area
consolidation in this previous range should provide enough momentum and relative strength has room to run
setting stop underneath breakout candle in case of a false breakout move

$vod breakout lookout-long term trend- uptrend and showing strength
-intermediate timeframe shows trend is in an uptrend but slightly flattening
-volatility is contracting.. pressing up on resistance area of 29.9x
-not paying too much attention to rsi here because of stock showing strong trend strength.
-positive volume pressure being applied
-shorter timeframe is showing price action in a symmetrical triangle with a .20 measured move- which would lead to the break of resistance area up to 30.0x
-cautious to the possibility of a false breakout- entry at 30.05 and setting stop at 29.71 gap low
-once resistance is broken extension level/profit target set at the .618 level of 31.67

BITCOIN: BTCUSD Must break above 2350 to stay positive nowBITCOIN: BTCUSD Approaching major resistance at 2340- 2350 again. It has to break above 2350 now to remain positive and to re-open the way for 400 point rally back to the high

BITCOIN: BTCUSD New parallel forming- positive whilst above itBitcoin: Now forming a new better, cleaner pair pair of parallels and whilst above here medium term is positive - nearer term resistance above and needs to retest parallel one more time probably...but remains good whilst above that line

S&P 500: Positive whilst above 2409: Target 2449S&P 500: Positive whilst above 2409 with near term upside target at 2449-2450.

ALPHABET: GOOG: BREAKOUT SUPER BULLISH NEAR TERMALPHABET: GOOG This stock broke out above its restraining long term resistance line yesterday by gapping up through the problem area. With one bound Alphabet is now free. This is super positive price action, no question. It should also be positive for stock markets worldwide. What's good for Google is good for pretty much every bull - wherever they may trade
