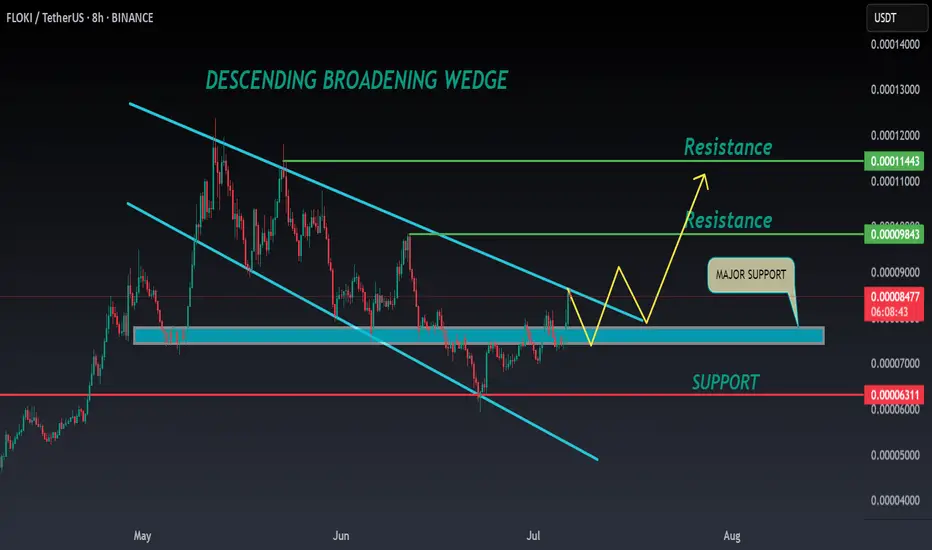
FLOKI ANALYSIS🔮 #FLOKI Analysis 🚀🚀
💲💲 #FLOKI was trading in a Descending Broadening Wedge Pattern, and trying to breakout the pattern. Also there is a instant support zone and after the breakout of resistance zone we will see a bullish move. 📈📈
💸Current Price -- $0.00008540
📈Target Price -- $0.00009840
⁉️ What to do?
- We have marked crucial levels in the chart . We can trade according to the chart and make some profits. 🚀💸
#FLOKI #Cryptocurrency #Breakout #DYOR
Potentialbreakout
Tata Power is showing strengthTata Power's technical indicators suggest a strong buy signal based on moving averages and oscillators. Here’s a quick breakdown:
- Relative Strength Index (RSI): 65.04 (indicating bullish momentum)
- MACD: 3.38 (positive crossover, signaling upward trend)
- Moving Averages: All major SMAs and EMAs indicate a buy
- Pivot Points: Key support at ₹388.64, resistance at ₹398.69
Close Above 400 mark will be positive
- Short-Term Forecast: Technical analysis suggests support around ₹390 and resistance near ₹626, with a potential price target of ₹417.23 in the next two weeks.

DEXE ANALYSIS📊 #DEXE Analysis
✅There is a formation of Descending triangle pattern on daily chart 🧐
Pattern signals potential bullish movement incoming after a breakout.
👀Current Price: $14.68
🚀 Target Price: $18.50
⚡️What to do ?
👀Keep an eye on #DEXE price action and volume. We can trade according to the chart and make some profits⚡️⚡️
#DEXE #Cryptocurrency #TechnicalAnalysis #DYOR

BTC ANALYSIS 🔮 #BTC Analysis 🚀🚀
💲💲 #BTC is trading between support and resistance area. There is a potential rejection again from its resistance zone and pullback from its major support area. If #BTC breaks resistance zone $88500 then there will a chance of bullish movement
💸Current Price -- $84470
⁉️ What to do?
- We have marked crucial levels in the chart . We can trade according to the chart and make some profits. 🚀💸
#BTC #Cryptocurrency #DYOR

OM ANALYSIS🔴 #OM Analysis :
🔮There is a formation of "Bullish Pennant Pattern" in #OM in 4hr time frame. #OM is trading around its all time high level. We may see a little retest before a bullish move
⚡️What to do ?
👀Keep an eye on #OM price action. We can trade according to the chart and make some profits. ⚡️⚡️
#OM #Cryptocurrency #Breakout #DYOR

PHB ANALYSIS🚀#PHB Analysis :
🔮As we can see in the chart of #PHB that there is a formation of "Descending Channel Pattern". Expecting a bullish move after the breakout of major resistance zone in few days.📈
🔰Current Price: $2.010
🎯 Target Price: $2.815
⚡️What to do ?
👀Keep an eye on #PHB price action. We can trade according to the chart and make some profits⚡️⚡️
#PHB #Cryptocurrency #TechnicalAnalysis #DYOR

ETH ANALYSIS🔮 #ETH Analysis 🚀🚀
💲💲 #ETH is trading in a Descending Broadening Wedge Pattern. And the price pullbacks from support zone.
There is an instant resistance area and if it sustain here then we will see a bullish move
💸Current Price -- $2678
📈Target Price -- $3310
⁉️ What to do?
- We have marked crucial levels in the chart . We can trade according to the chart and make some profits. 🚀💸
#ETH #Cryptocurrency #DYOR

INJ ANALYSIS🚀#INJ Analysis :
🔮#INJ is trading in a symmetrical triangle pattern on the daily timeframe. 💁♂️
We could expect a breakout and reach towards resistance 1 zone and could expect a potential bullish move📈
Expect a bullish wave of around 20-25% in the coming days
🔰Current Price: $20.20
🎯 Target Price: $27.35
⚡️What to do ?
👀Keep an eye on #INJ price action. We can trade according to the chart and make some profits⚡️⚡️
#INJ #Cryptocurrency #TechnicalAnalysis #DYOR

SOL ANALYSIS🔮 #SOL Analysis 💰💰
🌟🚀 There is a complete formation of Cup and Handle Pattern in #SOL in weekly timeframe. We are just waiting for a perfect breakout. If #SOL breakout with good volume then we will see a very good bullish move.🚀🚀
🔖 Current Price: $168
⏳ Target Price: $250
⁉️ What to do?
- We have marked some crucial levels in the chart. We can trade according to the chart and make some profits in #SOL. 🚀💸
#SOL #Cryptocurrency #DYOR

RAY ANAlYSIS🔮 #RAY Analysis 💰💰
📊 #RAY is making perfect and huge rounding bottom pattern in daily time frame, indicating a potential bullish move. If #RAY breakout the pattern with high volume then we will get a bullish move📈
🔖 Current Price: $2.375
⏳ Target Price: $2.990
⁉️ What to do?
- We have marked crucial levels in the chart . We can trade according to the chart and make some profits. 🚀💸
#RAY #Cryptocurrency #Pump #DYOR

ONDO ANALYSIS📊 #ONDO Analysis
✅There is a formation of Descending Channel Pattern and Cup and Handle in daily chart with a breakout of Descending Channel 🧐
Pattern signals potential bullish movement incoming after the confirmation of breakout of Cup and Handle.
👀Current Price: $0.81600
🚀 Target Price: $1.02090
⚡️What to do ?
👀Keep an eye on #ONDO price action and volume. We can trade according to the chart and make some profits⚡️⚡️
#ONDO #Cryptocurrency #TechnicalAnalysis #DYOR

IMX ANALYSIS📊 #IMX Analysis
✅There is a formation of Descending Channel Pattern in daily chart with a breakout🧐
Pattern signals potential bullish movement incoming after the confirmation of breakout and a small retest📉
👀Current Price: $1.640
🚀 Target Price: $2.560
⚡️What to do ?
👀Keep an eye on #IMX price action and volume. We can trade according to the chart and make some profits⚡️⚡️
#IMX #Cryptocurrency #TechnicalAnalysis #DYOR

AMBER ENTERPRISES-Weekly Breakout with Strong MomentumBreakout Confirmation: Amber Enterprises has given a decisive breakout above the crucial Fibonacci 23.6% level (₹5,206), with a significant price surge. This breakout was accompanied by heavy volume , indicating strong bullish momentum and participation.
Fibonacci Levels:
The stock retraced from its highs at ₹6,256.7, respecting the Fibonacci levels:
38.2% retracement at ₹4,557.35.
50% retracement at ₹4,032.40.
61.8% retracement at ₹3,507.50, which acted as a strong support before the stock resumed its upward movement.
The breakout above ₹5,206 now opens the path towards the previous highs around ₹6,256.7.
Bullish Trendline Support: The stock has been respecting an ascending triangle pattern, marked by higher lows, which reflects accumulation and strengthening of the uptrend. The recent breakout from this triangle pattern gives further bullish confirmation.
Targets Ahead:
Near-term target : Based on the breakout and the height of the triangle, the immediate target is around ₹6,256, which aligns with the 0% Fibonacci level.
Potential upside projection : Using the measured move from the breakout, the stock has a potential to reach ₹6,900-7,000 levels, reflecting a 30-40% upside from the breakout point.
RSI Momentum : The RSI has broken above the 70-mark, entering the overbought zone, which confirms strong bullish momentum. However, the overbought condition may suggest some consolidation in the short term before the next leg up.
Support Levels : On any pullback, strong support lies around the Fibonacci 38.2% level at ₹4,557.35, followed by ₹4,032.40 (50% level). As long as these supports hold, the overall trend remains bullish.
Conclusion : Amber Enterprises is showing a powerful breakout with high volume, indicating a potential bullish rally in the coming weeks. Traders can look for opportunities on pullbacks or momentum continuation above ₹5,500, with a near-term target of ₹6,256 and a possible extension towards ₹6,900.

JASMY ANALYSIS📊 #JASMY Analysis
✅There is a formation of Descending triangle pattern on daily chart 🧐
Pattern signals potential bullish movement incoming after a breakout
👀Current Price: $0.01950
🚀 Target Price: $0.03150
⚡️What to do ?
👀Keep an eye on #JASMY price action and volume. We can trade according to the chart and make some profits⚡️⚡️
#JASMY #Cryptocurrency #TechnicalAnalysis #DYOR

NQ Power Range Report with FIB Ext - 10/1/2024 SessionCME_MINI:NQZ2024
- PR High: 20245.75
- PR Low: 20213.25
- NZ Spread: 72.5
Key scheduled economic events
09:45 | S&P Global US Manufacturing PMI
10:00 | ISM Manufacturing PMI
- ISM Manufacturing Prices
- JOLTs Job Openings
Inventory dip to ~20060 before retracing back into week range
Session Open Stats (As of 12:25 AM 10/1)
- Weekend Gap: N/A
- Session Gap 7/24: -0.32% (open > 19946)
- Gap 10/30/23 +0.47% (open < 14272)
- Session Open ATR: 322.66
- Volume: 23K
- Open Int: 237K
- Trend Grade: Bull
- From BA ATH: -3.1% (Rounded)
Key Levels (Rounded - Think of these as ranges)
- Long: 20954
- Mid: 19814
- Short: 17533
Keep in mind this is not speculation or a prediction. Only a report of the Power Range with Fib extensions for target hunting. Do your DD! You determine your risk tolerance. You are fully capable of making your own decisions.
BA: Back Adjusted
BuZ/BeZ: Bull Zone / Bear Zone
NZ: Neutral Zone

FTM ANALYSIS🚀#FTM Analysis : Pattern Formation
🔮As we can see in the chart of #FTM that there is a formation Inverse Head And Shoulder Pattern and it's a bullish pattern. If the candle closes above the neckline then a bullish move could be confirmed✅️
🔰Current Price: $0.5160
🎯 Target Price: $0.7140
⚡️What to do ?
👀Keep an eye on #FTM price action. We can trade according to the chart and make some profits⚡️⚡️
#FTM #Cryptocurrency #TechnicalAnalysis #DYOR

ROSE ANALYSIS🚀#ROSE Analysis : What Next ??💲
✅As we can see that there was a formation of "FALLING WEDGE PATTERN" in #ROSE. We are expecting a bullish move in #ROSE after a breakout of falling wedge pattern
🔰Current Price: $0.06235
🎯 Target Price: $0.09755
⚡️What to do ?
👀Keep an eye on #ROSE price action. We can trade according to the chart and make some profits. Stay tuned for further analysis and stay updated with market sentiments and news.⚡️⚡️
#ROSE #Cryptocurrency #TechnicalAnalysis #DYOR

PEPE ANALYSIS🚀#PEPE Analysis :
🔮#PEPE is trading in a symmetrical triangle pattern on the daily timeframe💁♂️
We could expext a breakout of the symmetrical triangle pattern and could expect a potential bullish move📈
Expect a bullish wave of around 50% in the coming weeks
🔰Current Price: $0.00000780
🎯 Target Price: $0.00001200
⚡️What to do ?
👀Keep an eye on #PEPE price action. We can trade according to the chart and make some profits⚡️⚡️
#PEPE #Cryptocurrency #TechnicalAnalysis #DYOR

BTC ANALYSIS🔮 #BTC Analysis
🌟🚀 #BTC is trading in an Ascending Triangle Pattern and here we can see that #BTC test the resistance zone too many time. Now we can expect a breakout and a long rally in #BTC .💲💲
🔖 Current Price: $61150
⏳ Target Price: $65600
⁉️ What to do?
- We have marked crucial levels in the chart . We can trade according to the chart and make some profits. 🚀
#BTC #Cryptocurrency #Breakout #DYOR

QNT ANALYSIS🔮 #QNT Analysis - Breakout 🚀🚀
💲💲 In daily time-frame,Falling Wedge Pattern is forming✅
But right now we can see that #QNT is testing its major resistance zone if #QNT breaks the pattern and also breaks the resistance zone with high volume then we would see a bullish move 💯🚀
💸Current Price -- $66.8
📈Target Price -- $122.7
⁉️ What to do?
- We have marked crucial levels in the chart . We can trade according to the chart and make some profits. 🚀💸
#QNT #Cryptocurrency #Breakout #DYOR

SAGA ANALYSIS🔮 #SAGA Analysis 🚀🚀
As we can see that #SAGA is trading in a Descending Channel Pattern in daily time frame. Also there is a formation of double bottom pattern which indicates a bullish momentum. A perfect breakout of both pattern will make a bullish movement in #SAGA 💸 💯🚀
💸Current Price -- $1.2490
📈Target Price -- $3.1470
⁉️ What to do?
- We have marked crucial levels in the chart . We can trade according to the chart and make some profits. 🚀💸
#SAGA #Cryptocurrency #DYOR

AKRO ANALYSIS🔮 #AKRO Analysis 🚀🚀
As we can see that #AKRO is trading in a Descending Triangle Pattern in daily time frame. Also it is trading in a parallel channel. A breakout of both pattern will make a bullish movement in 💸 💯🚀
💸Current Price -- $0.004835
📈Target Price -- $0.014000
⁉️ What to do?
- We have marked crucial levels in the chart . We can trade according to the chart and make some profits. 🚀💸
#AKRO #Cryptocurrency #DYOR

OMNI ANALYSIS🔮#OMNI Analysis :
📈📈 #OMNI is making perfect Double Bottom Pattern. We can see a good pump if #OMNI breakout the trendline with good volume and sustains the higher price after breakout 🚀🚀
📊 Current Price: $18.40
⏳ Target Price: $28.85
⁉️ What to do?
- We can trade according to the chart and make some profits in #OMNI. Keep your eyes on the chart, observe trading volume and stay accustom to market moves.💲💲
#OMNI #Cryptocurrency #Pump #DYOR #Breakout
