GOLD D1 Analysis - BullishPair Name = Gold
Timeframe = D1
Analysis = technical + fundamentals
Trend = Bullish
Pattern = Bullish Flag
Explanation :-
Gold is bullish over all and getting a good volume. we can see price around 2550 or more. In Daily Timeframe Gold is making Bullish Flag Pattern. Here we are looking for breakout. After breakout We see big entries that will pump the market.
Pound

GBP/JPY H1 | Potential bearish breakoutGBP/JPY is falling toward a potential breakout level and could drop lower from here.
Sell entry is at 184.78 which is a potential breakout level.
Stop loss is at 186.60 which is a level that sits above an overlap resistance.
Take profit is at 182.97 which is a multi-swing-low support.
High Risk Investment Warning
Trading Forex/CFDs on margin carries a high level of risk and may not be suitable for all investors. Leverage can work against you.
Stratos Markets Limited (www.fxcm.com):
CFDs are complex instruments and come with a high risk of losing money rapidly due to leverage. 62% of retail investor accounts lose money when trading CFDs with this provider. You should consider whether you understand how CFDs work and whether you can afford to take the high risk of losing your money.
Stratos Europe Ltd (www.fxcm.com):
CFDs are complex instruments and come with a high risk of losing money rapidly due to leverage. 59% of retail investor accounts lose money when trading CFDs with this provider. You should consider whether you understand how CFDs work and whether you can afford to take the high risk of losing your money.
Stratos Trading Pty. Limited (www.fxcm.com):
Trading FX/CFDs carries significant risks. FXCM AU (AFSL 309763), please read the Financial Services Guide, Product Disclosure Statement, Target Market Determination and Terms of Business at www.fxcm.com
Stratos Global LLC (www.fxcm.com):
Losses can exceed deposits.
Please be advised that the information presented on TradingView is provided to FXCM (‘Company’, ‘we’) by a third-party provider (‘TFA Global Pte Ltd’). Please be reminded that you are solely responsible for the trading decisions on your account. There is a very high degree of risk involved in trading. Any information and/or content is intended entirely for research, educational and informational purposes only and does not constitute investment or consultation advice or investment strategy. The information is not tailored to the investment needs of any specific person and therefore does not involve a consideration of any of the investment objectives, financial situation or needs of any viewer that may receive it. Kindly also note that past performance is not a reliable indicator of future results. Actual results may differ materially from those anticipated in forward-looking or past performance statements. We assume no liability as to the accuracy or completeness of any of the information and/or content provided herein and the Company cannot be held responsible for any omission, mistake nor for any loss or damage including without limitation to any loss of profit which may arise from reliance on any information supplied by TFA Global Pte Ltd.
The speaker(s) is neither an employee, agent nor representative of FXCM and is therefore acting independently. The opinions given are their own, constitute general market commentary, and do not constitute the opinion or advice of FXCM or any form of personal or investment advice. FXCM neither endorses nor guarantees offerings of third-party speakers, nor is FXCM responsible for the content, veracity or opinions of third-party speakers, presenters or participants.

GBP/USD : Possible Fall Ahead ? (READ THE CAPTION)By analyzing the GBP/USD chart on the 4-hour timeframe, we can see that the price has reached a demand zone and has also created a Fair Value Gap (FVG) near its current level, which I expect to be filled in the short term. After that, I anticipate further decline in GBP/USD. The potential targets for this drop are 1.31060, 1.30870, and 1.30330.
Please support me with your likes and comments to motivate me to share more analysis with you and share your opinion about the possible trend of this chart with me !
Best Regards , Arman Shaban

GBP NZDTHIS IS MY SETUP FOR GBP NZD
I use Fibonacci to get these extreme points and my preferred one is 80% retracement, with a risk-reward of 1:4.
Trade carefully
This is not financial advice, DYOR.

GBP/USD Struggles as Dollar Strengthens Following Economic DataThe Pound Sterling has continued to underperform against the US Dollar, following a series of key economic events. Initially, on Friday, the USD experienced a brief weakening after the release of the ADP Non-Farm Employment Change and Unemployment Claims, which pointed to weaker-than-expected economic signals. U.S. employment growth for August came in below forecasts, casting doubt on the overall health of the labor market. However, the dollar quickly regained its strength, in line with last week’s price action, after market participants absorbed these figures and focused on other economic data points.
Our previous forecast for GBP/USD, as outlined last week, highlighted a key supply area that would likely serve as a turning point for the pair, and indeed this has played out. The price action during the London session shows continued weakness in the British pound, confirming a bearish continuation as the USD maintains its momentum. The GBP remains under pressure as the pair seems unable to sustain any recovery attempts, particularly as the USD continues to recover its losses from earlier in the month.
Previous Analysis:
Looking ahead, tomorrow’s U.S. economic releases, including Core PPI m/m, PPI m/m, and Unemployment Claims, will be crucial in determining whether the dollar can extend its bullish momentum. Additionally, the upcoming U.S. pre-election debate could add further volatility to the market, making this a key event for traders to watch.
In conclusion, GBP/USD remains on a bearish trajectory, and further downside pressure could emerge if the upcoming U.S. data continues to support the case for dollar strength. Traders should stay alert to these key data points as they will likely set the tone for the pair’s movement in the coming days.

Bearish BO ...After a bearish weekly candlestick, GBPUSD firmed a endless pullback and tried to BO above last high that was unsuccessful and pushed price lower. Endless pullback, lower high, double top and now bearish BO are signs that Pound sterling can weak against US Dollar.
Trade safe.
Good luck.

Watch out as EURGBP net short positioning is reversing quicklyLeveraged money net positioning is reversing from extreme short levels in EURGBP futures.
We do acknowledge the UK's recent positive political momentum amid political turbulence in the EU, however we believe the effect is in the price.
On top of that, our fundamental macro model is slightly bullish EURGBP, certainly not indicating a further drop from these levels.
This might indicate a rally in EURGBP towards 0.86 after a recent 2 standard deviation selloff.

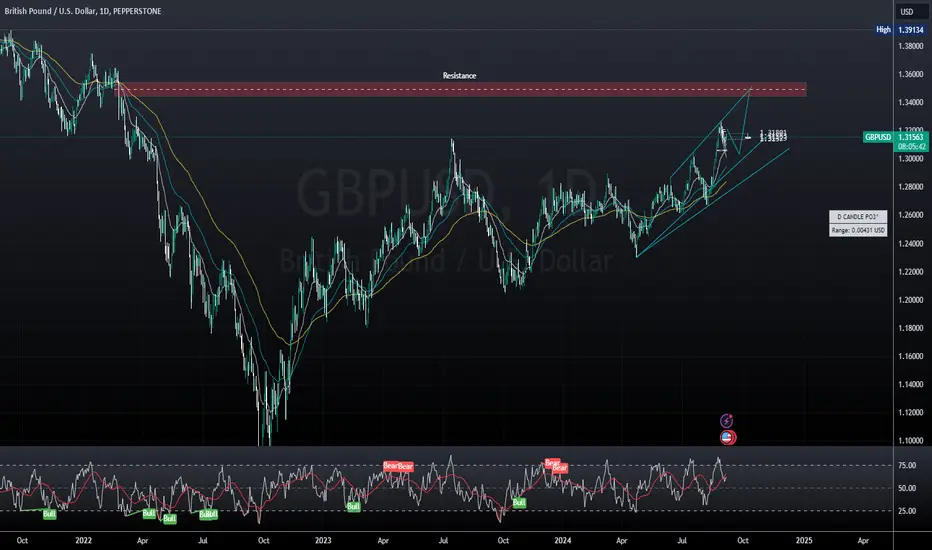
GBPUSD Daily Chart Analysis: Key Resistance and Bullish Channel The daily chart for GBP/USD reveals a clear uptrend with price action forming a bullish channel. The pair is currently trading around 1.31621, approaching a critical resistance zone.
Key Levels:
Resistance Zone:
The price is heading towards a major resistance around 1.39, a level which has historically acted as a strong ceiling. This resistance could halt the upward movement unless a significant breakout occurs.
Support Levels:
The lower trendline of the channel is acting as dynamic support. If the price retraces, the 1.30 level should provide a cushion for potential buying pressure, maintaining the bullish trend.
Trading Strategy:
Buying Strategy:
Traders can look for a pullback to the lower boundary of the channel around 1.30 for a potential buying opportunity. A stop loss can be placed just below the trendline, targeting the resistance at 1.39.
Breakout Strategy:
A breakout above the 1.39 resistance would signal a continuation of the long-term bullish trend, opening up the possibility for further gains toward higher resistance levels.
RSI Confirmation:
The RSI indicator is approaching overbought territory but still has room to push higher. This suggests that the bullish momentum could continue until resistance is tested.
Conclusion:
With GBP/USD trading within a rising channel, the focus remains on how the price interacts with the 1.39 resistance level. A pullback to the lower trendline offers buying opportunities, while a breakout above resistance would signal further bullish potential.
GBPUSD - high placed? What's next??#GBPUSD.. pound placed a reasonable high in last couple of days and specially last month closing is good favor of sellers.
And the area for daily chart is 1.3170 around so if market hold it now then drop expected.
Stay sharp guys.
Good luck
Trade wisely

ascending broadening wedge in GBPUSDThe weekly candles on GBPUSD point to a clear ascending broadening wedge pattern. The last wave reached the price of 1.3220, which corresponds to the upper boundary of the wedge pattern. I expect another bearish wave to start soon and reach at least the 1.28 area.

Pullback after climactic reversal...On my view, GBPCAD now pullback to the channel line after his climactic reversal.
Canadian dollar can strong again after some rate cut and Pound sterling can weak in this levels against other currencies.

Its look like bear taking control...Big bull channel, endless pullback, bear break out, pullback to sell climax and now, time to sell pound sterling against US dollar.
Good luck.

GBP/JPY H1 | Falling to ascending trendlineGBP/JPY is falling towards an ascending trendline support and could potentially bounce off this level to climb higher.
Buy entry is at 188.63 which is an ascending trendline support.
Stop loss is at 187.42 which is a level that lies underneath a pullback support and the ascending trendline.
Take profit is at 190.51 which is a pullback resistance that sits above the 50.0% Fibonacci retracement level.
High Risk Investment Warning
Trading Forex/CFDs on margin carries a high level of risk and may not be suitable for all investors. Leverage can work against you.
Stratos Markets Limited (www.fxcm.com):
CFDs are complex instruments and come with a high risk of losing money rapidly due to leverage. 68% of retail investor accounts lose money when trading CFDs with this provider. You should consider whether you understand how CFDs work and whether you can afford to take the high risk of losing your money.
Stratos Europe Ltd, previously FXCM EU Ltd (www.fxcm.com):
CFDs are complex instruments and come with a high risk of losing money rapidly due to leverage. 73% of retail investor accounts lose money when trading CFDs with this provider. You should consider whether you understand how CFDs work and whether you can afford to take the high risk of losing your money.
Stratos Trading Pty. Limited (www.fxcm.com):
Trading FX/CFDs carries significant risks. FXCM AU (AFSL 309763), please read the Financial Services Guide, Product Disclosure Statement, Target Market Determination and Terms of Business at www.fxcm.com
Stratos Global LLC (www.fxcm.com):
Losses can exceed deposits.
Please be advised that the information presented on TradingView is provided to FXCM (‘Company’, ‘we’) by a third-party provider (‘TFA Global Pte Ltd’). Please be reminded that you are solely responsible for the trading decisions on your account. There is a very high degree of risk involved in trading. Any information and/or content is intended entirely for research, educational and informational purposes only and does not constitute investment or consultation advice or investment strategy. The information is not tailored to the investment needs of any specific person and therefore does not involve a consideration of any of the investment objectives, financial situation or needs of any viewer that may receive it. Kindly also note that past performance is not a reliable indicator of future results. Actual results may differ materially from those anticipated in forward-looking or past performance statements. We assume no liability as to the accuracy or completeness of any of the information and/or content provided herein and the Company cannot be held responsible for any omission, mistake nor for any loss or damage including without limitation to any loss of profit which may arise from reliance on any information supplied by TFA Global Pte Ltd.
The speaker(s) is neither an employee, agent nor representative of FXCM and is therefore acting independently. The opinions given are their own, constitute general market commentary, and do not constitute the opinion or advice of FXCM or any form of personal or investment advice. FXCM neither endorses nor guarantees offerings of third-party speakers, nor is FXCM responsible for the content, veracity or opinions of third-party speakers, presenters or participants.

UK Housing Market Lifts GBP/USD Amid Social UnrestGBPUSD – technical overview
Signs have emerged of the market wanting to put in a longer-term base after collapsing to a record low in September 2022. The door is now open for the next major upside extension towards the 2023 high at 1.3143. Any setbacks should be well supported ahead of 1.2500.
R2 1.2861 – 12 June high – Strong
R1 1.2800 – Figure – Medium
S1 1.2673 – 6 August low – Medium
S2 1.2613 – 27 June low – Strong
GBPUSD – fundamental overview
The Pound was still struggling on Wednesday from all the social unrest in the UK. However, we did see some demand on the back of UK house prices rising the most since January. Key standouts on Thursday’s calendar come from US initial jobless claims, wholesale inventories, and some Fed speak.
Exclusive FX research from LMAX Group Market Strategist, Joel Kruger

Time to short GBPUSD...After breaking broad bull channel, Pound sterling is ready to goes down again.
Yesterdays daily candle will push it lower against dollar and other currencies.
Trade safe.
Good luck.

$GBP - What shall we do now?$GBP - What shall we do now?
GBP - Since we hit below 1.14 - 1.10 it's really been a one way for this pair and it could continue...However, we have options!
1 Emergency rate hike
2 Intervention
3 IMF
4 Fiscal spending
5 Swap Lines
Now these are the options technically speaking we filled gap around 1.09 this morning, I expected 1.06 on table during open we hit lows of 1.03... Now, if we can hold the levels of these levels and perhaps go above 1.09 then no worries. However, if we carry on with these moves then things will get very interesting and keep an eye on the Gilt & FTSE!
Now it all looks very dismal when it comes towards headlines but actually there are coming amazing investment opportunities the prices we are getting and of course if you're in USA, what a great time for you to visit! For Candle stick traders - dragon fly!
Keep alert of what happens next, this week we have a lot speakers out of CB's and most importantly trade your plan!
Best,
TJ

GBP/USD Continues Downtrend, Aligns with Supply ForecastGBP/USD has extended its decline after reaching our predicted supply area, as outlined in our previous analysis. (Link below.)
Prolonged Downtrend Expected
The current trend suggests that the price may continue to fall over the next few months, potentially reaching the demand area around 1.24 before experiencing a new bullish impulse. This aligns with our forecast, anticipating a bearish phase until October.
Anticipation of Monetary Policy Announcements
Traders are awaiting key monetary policy announcements from the Federal Reserve on Wednesday and the Bank of England on Thursday. These events are expected to inject fresh volatility into the market, possibly pushing GBP/USD even lower.
Market Sentiment and Indices
Meanwhile, the UK's FTSE 100 Index has dipped by 0.3%, while US stock index futures are trading marginally higher, reflecting a cautious market stance.
Strategy and Outlook
Given these conditions, we maintain our bearish outlook and continue to hold our short position, anticipating further downward movement in GBP/USD.
Previous Forecast:
✅ Please share your thoughts about GBP/USD in the comments section below and HIT LIKE if you appreciate my analysis. Don't forget to FOLLOW ME; you will help us a lot with this small contribution.

Hedge Funds' Sterling Bet: A Risky Gamble?A surge in bullish bets on the British pound sterling by hedge funds and other asset managers has ignited concerns about a potential market upheaval. Aggressive positioning on the currency has reached a 10-year high, leaving it vulnerable to a sharp correction should the Bank of England (BoE) decide to cut interest rates this week.
The data, sourced from the Commodity Futures Trading Commission, reveals a dramatic increase in net-long positions on sterling over the past month. This bullish sentiment has been fueled by a combination of factors, including relatively high interest rates, signs of economic improvement, and the perceived stability of the UK government. As a result, the pound has gained nearly 1% against the US dollar since the start of the year and reached a one-year high earlier this month.
However, the market's optimism may be misplaced. The BoE's monetary policy decision on Thursday remains a significant uncertainty, with market pricing indicating an equal chance of a rate hike or a cut. If the central bank opts to lower interest rates to stimulate economic growth, it could have a severe impact on the pound.
The heightened bullish sentiment among investors has created a scenario where even a hint of dovishness from the BoE could trigger a rapid unwinding of positions and a sharp decline in sterling.
The potential for a significant market correction has prompted concerns among analysts and investors. Some argue that the current level of bullishness is excessive and that the market is underpricing the risk of a rate cut. They caution that a sudden shift in sentiment could lead to significant losses for those holding long positions on the pound.
As the market awaits the BoE's decision, volatility is expected to remain high. The outcome of the meeting will undoubtedly have far-reaching consequences for the pound and the broader global financial markets. If the central bank surprises the market with a rate cut, it could be a wake-up call for investors who have become overly complacent about the currency's prospects.
Ultimately, the recent surge in bullish sterling bets highlights the inherent risks of relying on market consensus. While past performance is not indicative of future results, the current level of optimism surrounding the pound raises questions about the sustainability of the currency's strength. As the old adage goes, "buy low, sell high," but in this case, investors may be finding themselves on the wrong side of the trade.

Never look good enough ...Broad bull channel, climactic reversal on top, bear breakout on top and major trend reversal can be cause of bearish movement in GBPUSD.
Trade safe.

GBPUSD ( 1H time frame ) hello dear trader
With today's news, in my personal opinion, the upper and lower liquidity areas will be filled... After the Engulf of each area
then correction, I am waiting to take a position
stop loss need for any position
good luck

GBP/USD to Track 100-MA Slope? GBP/USD to Track 100-MA Slope?
On Wednesday, GBP/USD traders will focus on the UK's July Manufacturing and Services PMI, expected to show slight increases.
Although, more significant events will come from the U.S., including the annualized Q2 2024 GDP and the PCE Price Index.
The Fed's preferred inflation gauge likely cooled in June, suggesting its efforts to curb prices are working, potentially paving the way for rate cuts in September.
Markets expect the Fed to maintain the federal funds rate next week but anticipate a cut in September, according to the CME Group's FedWatch tool.
GBP/USD extends the decline from the monthly high (1.3045), pulling the Relative Strength Index (RSI) back from overbought territory. It found support after briefly easing below 1.29 and may track the positive slope in the 100-period SMA.

CABLE #GBPUSD Can push into 1.40 zone on Risk off moveExpect continued #DXY weakness and corresponding risk on moves across the board
The Pound is a good example that has already triggered a Bullish upside move.
Yet still has decent room to move on up.
#GOLD #BTC #STOCKS can continue ripping with the tailwinds of #Dollar softness.

GBPNZD - The Correction Is ImminentGBPNZD has shown an impressive rally in recent weeks.
Bearish divergences are now all too obvious, and retailer sentiment is also very bullish - a combination that warns bulls to be cautious.
We are trying to position ourselves in the market with a short and benefit from a very attractive RRR of around 2.6:1.
