$eurgbp small long going long here after the acceleration
expecting another low since we are not diverging so starting with a small position
Pound

GBPUSD: Upwing nearing an end?It was a big leg down from July - Sept -
so some attempt at selling a retracement makes sense
- probably in the pocket between the 50% and 61.8% Fib levels.
Trade: Sell a bounce into 1.27 down towards 1.24, cut losses above the 61.8% Fib

✅GBP_NZD MOVE DOWN AHEAD|SHORT🔥
✅GBP_NZD broke the key
Horizontal level of 2.052
While trading in a downtrend
So I will be expecting
A further bearish move down
SHORT🔥
✅Like and subscribe to never miss a new idea!✅

GBPUSDThe hourly chart is also strictly bullish, with the target being the Previous Weekly High (PWH). The bullish Order Flow is favorable. It would be ideal to see a short setup during the Asian session with the aim of covering imbalances and furthering the bullish movement.

GBPUSD
4h - The four-hour chart looks as good as the daily, with excellent price action around liquidity. It's a strictly bullish context, and reversing such a movement seems highly doubtful. The Previous Weekly High (PWH) is the logical target.

GBPUSD 1D1D - Daily timeframe, extremely bullish context, confirmed by Friday's price movement. Any short movements are excluded. We might see something similar next week, as indicated on the chart.

✅EUR_GBP BREAKOUT|SHORT🔥
✅EUR_GBP was trading in a
Rising wedge but now we
Are seeing a bearish breakout
From the wedge so I think
That the pair will go down
SHORT🔥
✅Like and subscribe to never miss a new idea!✅

EURGBP: One More Breakout 🇪🇺🇬🇧
As I predicted earlier, EURGBP dropped nicely after a key structure breakout.
It turned out that the price managed to violate one more support.
The pair closed below 0.8650 - 0.8665 area.
The broken structure turned into a key resistance.
We may anticipate a bearish continuation to 0.8625
❤️Please, support my work with like, thank you!❤️

EUR-GBP Will Go Down! Sell!
Hello,Traders!
EUR-GBP broke the
Rising support line
And the breakout is
Confirmed so I think that
We will see a further move down
Sell!
Like, comment and subscribe to help us grow!
Check out other forecasts below too!

GBPUSDuntil the price is above the marked fractal, we are still in a long context, only when the price fixes below will I consider short positions

Short Term Bearish Before Going Bullish...?On this 4 hour, this market has maintained its bullishness, printing higher highs and higher lows from over a week now. Prices are currently in a Bullish PB that is forming a high at the moment. Because the market never moves in a straight line, the market is expected to experience some bearish retracement back into our PB, from where it would be expected to experience some reversal before the continuation of the up move.
We have refined our PB to a rather smaller zone. It is expected that prices will come right into our zone, and begin to reverse from there. When that happens, prices will be expected to resume the bullish push and go all the way to the 4 hour liquidity target above.

Only one area 1.2730, keep close it.#GBPUSD... So now we have 1.2730 as a major level.
Keep close it, it's market pattern area in month and week chart.
Kneely watch it and consider it.
It will be disaster area of the week and month .
Any aggressive move will start from here.
Trade wisely
Good luck

GBP/USD looks set to extend its gainsA potentially nice setup is forming on #GBPUSD.
High trading activity around 1.2718 during its prior decline could act as a magnet for prices on the daily.
The 200-day MA has flipped from resistance to support and no immediate signs of a top on price and OBV is confirming the rally.
A strong trend has formed on the 1-hour chart with a potential bull flag. The monthly R3 pivot is capping as resistance, but a break above last week's high assumes bullish continuation.
Even if prices retrace first to invalidate the bull flag, it looks like a decent candidate for bulls to seek dips to my eyes and a move towards 12.7.

GBP/USD -28/11/2023-∙ British Pound is also benefitting from weakening USD and falling yields
∙ Bullish trend intact as long as above the ascending trend line
∙ Bulls and bears are battling through the 1.2660-70 level (September 2020 low and August 2018 low)
∙ The above level needs to be cleared for further gains through 1.2850 (200 SMA) followed by the psychological level at 1.30 and 1.31 yearly high

EURGBP: Important Bearish Breakout 🇪🇺🇬🇧
EURGBP broke and closed below a solid intraday horizontal support.
We see a positive bearish reaction to that after its retest.
The pair may drop lower to 0.8664 support.
❤️Please, support my work with like, thank you!❤️

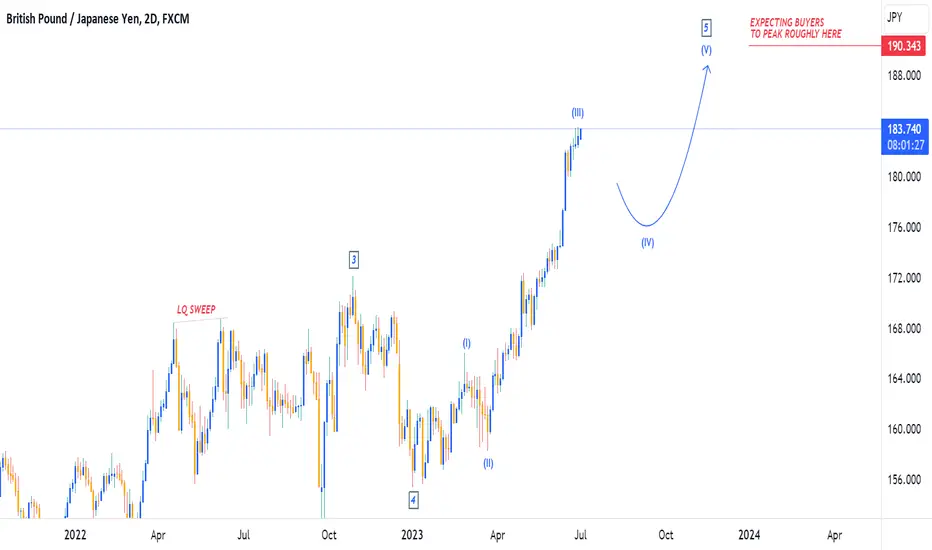
GBPJPY SELL OVERVIEW (2D TF)📈Expecting 1 more downside correction on GBPJPY, before we see the FINAL impulse move to the upside. Expecting buyers to peak around $190-$194, before downtrend begins.
⭕️3 Sub-Wave Impulse Complete for Wave 5.
⭕️2 Sub-Waves (IV, V) Still Pending.
⭕️Selling Momentum Slowing Down.
✅GBP_USD WAIT FOR BREAKOUT|LONG🚀
✅GBP_USD has reached a
Horizontal resistance of 1.2555
And is now trying to break it
So IF the breakout is confirmed
Then I will be expecting
A further move up
LONG🚀
✅Like and subscribe to never miss a new idea!✅

GBPUSD: Technical Outlook & Forecast For Next Week 🇬🇧🇺🇸
GBPUSD is trading in a minor bullish trend within a rising parallel channel on a daily.
The price set a new higher high on Friday, violating a solid horizontal resistance.
It is an important sign of strength of the buyers.
We may anticipate a further growth next week.
Next resistance - 1.272
❤️Please, support my work with like, thank you!❤️

GBPJPY: Expecting further strengthPound has been in a long term downtrend, however breaking weekly highs and general sterling strength I believe we will see momentum continue to build an push this pair up to monthly highs.
I think the Yen will start to improve against the dollar due to dollar weakness, this generally means that other crosses perform well against it, and we're seeing this with the likes of the Aussie.
I'm seeing a rising dynamic trendline on the 4HR that I believe will be tested and respected, so I'll likely be going in on a LTF confirmation around the rising trendline.

GBPUSD 4hThe 4-hour timeframe continues to move without the slightest hint of a context change. The price elegantly clears any weak liquidity beneath it and then updates the highs. Going forward, we would like to see a pullback to cover imbalances below, followed by a subsequent high update.

GBP-USD Potential Long! Buy!
Hello,Traders!
GBP-USD is trading in an
Uptrend in a rising wedge
And the pair is now trying to
Break the horizontal resistance
Level of 1.257 and IF the
Breakout succeeds then
We will see a move up
Buy!
Like, comment and subscribe to help us grow!
Check out other forecasts below too!

GBPJPY SELL OVERVIEWGBPJPY played out exactly how we outlined on our analysis. We called the top, followed by a bearish retracement towards $176.500. If you caught the top, you would have caught 730 PIPS towards our Wave IV target.
Now towards the next target of $190 (Wave V)!

GBPJPY SELL OVERVIEW (2D TF UPDATE)📈First update of the week - GBPJPY! Bullish momentum is slowing down, as we get near to the top. Institutional money managers are opening their sellers order, making GBPJPY go into a redistribution phase. We should see more & more sell orders being opened & the official downtrend start very soon, around January 2024. Which is just over a month & a half away😉
