GBPNZD: Important Breakout 🇬🇧🇳🇿
Update for GBPNZD.
The price successfully broke and closed above the neckline of a cup & handle pattern
on a daily time frame.
It is a very important bullish signal.
Taking into consideration that the market is trading in a long-term bullish trend,
probabilities are high that the pair will keep growing soon.
Next goal - 2.096
❤️Please, support my work with like, thank you!❤️
Pound

✅GBP_NZD BULLISH BIAS|LONG🚀
✅GBP_NZD broke the key
Horizontal level of 2.07
While trading in an uptrend
And the breakout is confimed
So I am now expecing
A bullish continuation
LONG🚀
✅Like and subscribe to never miss a new idea!✅

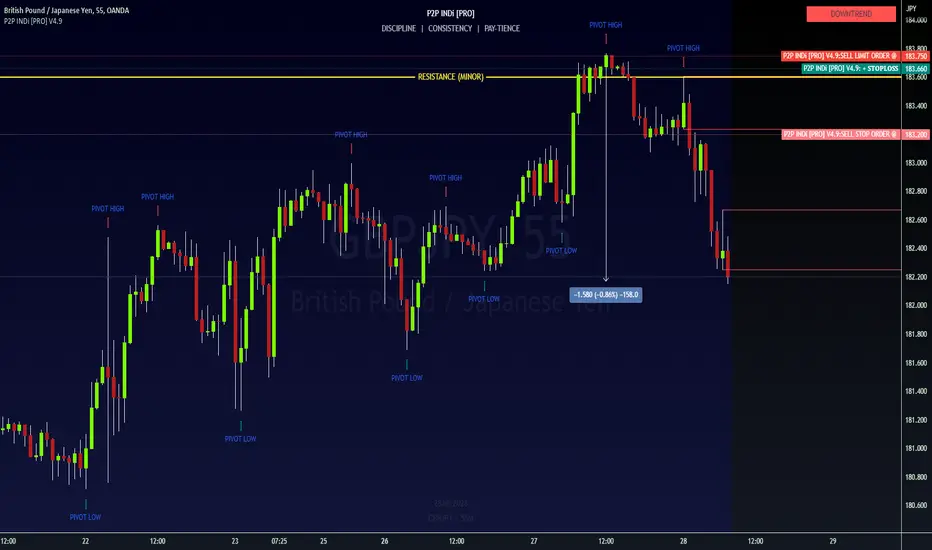
🔥 NEW: GBPJPY...DT 🔥 SWING TRADE 🔥-SL @ 195.00 🚫
SLO2 @ 191.25 ⏳
SLO1 @ 183.75 ⏳
TP1 @ 169.66 (shaving 25%)
TP2 @ 157.50 (shaving 25%)
TP3 @ 148.66 (shaving 25%)
TP4 @ 135.00 (closing ALL Sell Orders)
BLO1 @ 131.75 ⏳
BLO2 @ 123.75 ⏳
-SL @ 120.00 🚫

🔥 MODIFICATIONS & ADD-ONs: GBPJPY...DT 🔥 POSITION TRADE 🔥🙌🏾 NO RISK TRADE
MODIFICATIONS
SLO3 @ 191.25 ⏳
SLO1 @ 183.75 📉 +41 pips
+SL @ 183.66 🚫 +9 pips
SLO2 @ 183.20 (1m) ⏳
TP1 @ 169.66 (shaving 25%)
TP2 @ 157.50 (shaving 25%)
TP3 @ 148.66 (shaving 25%)
TP4 @ 135.00 (closing ALL Sell Orders)
BLO1 @ 131.75 ⏳
BLO2 @ 123.75 ⏳
-SL @ 120.00 🚫
🤑 Our Net Equity is @ +158 pips
🚫 +SL modified to preserve capital (see above)
✍️ After Multi-timeframe analysis, on noticed a newly created Supply Zone on the 55m and the 1m chart.
📉 If Price Action (PA) pulls back (PB) up to that Supply Zone, I placed a new Sell Limit Order at the proximal of the range (see above) — the range for an entry is from 183.20 to 183.60 (55D)
GJNice sharpening
- test of our level
- trigger our buy limit
- candlestick formation, indicating bull trend coming
- straight up and no retest

🔥 NEW: GBPNZD ✨ AGGRESSIVE TRADE 🔥-SL @ 2.0930 🚫
SSO1 @ 2.0795 ⏳
SSO2 @ 2.0525 ⏳
TP1 @ 2.0000 (shaving 25%)
TP2 @ 1.9566 (shaving 25%)
TP3 @ 1.9250 (shaving 25%)
TP4 @ 1.8750 (closing ALL Sell Orders)
Let's try this AGAIN, now that momentum is indicating price action is in overbought territory. That's great news for shorting this pair.

🔥 NEW: GBPNZD 🔥 SWING TRADE 🔥-SL @ 1.1395 🚫
SLO @ 1.1380 ⏳
SSO @ 1.1366 ⏳
TP1 @ 1.1340 (shaving 25%)
TP2 @ 1.1315 (shaving 25%)
TP3 @ 1.1300 (shaving 25%)
TP4 @ 1.1275 (closing ALL Sell Orders)
SUPPORT @ 1.1266
IBR @ 1.1250

🔥 UPDATE: GBPNZD 🔥 SWING TRADE 🔥-SL @ 2.0750 🚫
SLO @ 2.0560 ⏳
SSO @ 2.0190 ⏳
TP1 @ 1.9485 (shaving 25%)
TP2 @ 1.8875 (shaving 25%)
TP3 @ 1.8433 (shaving 25%)
TP4 @ 1.7755 (closing ALL Sell Orders)
SLO1 @ 1.7590 ⏳ (preferred)
SLO2 @ 1.7190 ⏳ (secondary)
-SL @ 1.7000 🚫

GBPUSD: Top-Down Analysis & Trading Plan 🇬🇧🇺🇸
GBPUSD is trading in a long-term bullish trend.
After the price set a new higher high on a daily, the market retraced.
The pair is currently approaching a horizontal key support.
To buy the market with a confirmation, watch a double bottom pattern on 4H.
1.2753 is its neckline.
If the price breaks and closes above that on a 4H, it will confirm the initiation of a bullish movement.
A bullish continuation will be expected then.
Goal will be 1.2826
If the price sets a new lower low, the setup will become invalid.
❤️Please, support my work with like, thank you!❤️

GBP/USD -27/6/2023-• The pair broke below the ascending trend line in May, one that has been intact since Oct 2022
• Bulls managed to break above the line in mid June but failed to sustain the move
• Bulls and bears are now fighting around the trend line from above and below
• Either of the two needs consecutive big bars above or below the line to get the upper hand
• Immediate support comes at 1.2690-1.27 ( previous resistance that became support ) followed by 1.245 (previous resistance became support)
• Markets are assessing the economic situation in the UK as the central bank keeps raising interest rates to fight the sticky inflation might eventually hurt the economy
• Trend remains bullish as long as above the 1.2690-1.27 and bears need a break below that level to get back in control

GJI don't know what I am doing wrong but I keep getting it wrong as moderators keep flagging my posts. The impulse upwards was an indication that the demand and the supply met each other at the right time.
The blue rectangle was an indication of a area of sensitivity, the market turned just before our entry point. Therefore we missed the initial target but that's okay because they'll always be another trade. I am trying to write this as long as possible because maybe then it won't get flagged. My work and analysis is straight forward and easy to understand but clearly I need to make it complicated and full of things that are not needed.
We see rejection and continuation from both sides, lots of candles, wicks left & right, up & down, sensitive zones, bear candles, bull candles, candlestick formations, channels and movements.

GBPUSDHello traders ,what do you think about GBPUSD? After reaching the ceiling of the channel and the resistance zone, this pair failed to cross it and fell, now we expect it to fall to the bottom of the channel with some fluctuation in this area.
If this post was useful to you, do not forget to like and comment.❤️

GBPUSD: Your Trading Plan For Next Week 🇬🇧🇺🇸
GBPUSD is testing a key daily structure support.
Analyzing the reaction of the price to that, I spotted a double bottom formation on 1H time frame.
To buy the pair with a confirmation, wait for a bullish breakout of its neckline.
Hourly candle close above 1.2737 will confirm the violation.
A bullish continuation will be expected to 1.2787.
Alternatively, if the price sets a new lower low on 1H, the setup will become invalid.
❤️Please, support my work with like, thank you!❤️

GBPNZD: Trend-Following Trading Setup
GBPNZD formed a classic cup & handle formation.
The market is trading in a long-term bullish trend.
The neckline of the pattern is the only obstacle for the buyers now.
Its breakout will initiate a trend-following movement to new highs.
Daily candle close above 2.075 will confirm the violation.
A bullish continuation will be expected then to 2.085
❤️Please, support my work with like, thank you!❤️

GBPUSD: Key Levels to Watch 🇬🇧🇺🇸
Here is my latest structure analysis for GBPUSD.
Horizontal Key Levels
Resistance 1: 1.2820 - 1.2850 area
Support 1: 1.2630 - 1.2680 area
Support 2: 1.2485 - 1.2515 area
Vertical Key Levels
Vertical Support 1: Rising trend line
Consider these structures for pullback / breakout trading.
❤️Please, support my work with like, thank you!❤️

Looks explosiveGBP is trending higher against almost al pairs, in this case is forming a bullish flag. You can open a small position now, if it drops open another. I very unlikely that the pair breaks down the support. I don't have a TP, I would let it rip. My SL would be if a daily candle closes below the support breaking it.

EUR-GBP Bearish Breakout! Sell!
Hello,Traders!
EUR-GBP broke the key
Horizontal level of 0.8566
Which makes us bearish
Biased and we will be
Expecting a bearish continuation
Sell!
Like, comment and subscribe to help us grow!
Check out other forecasts below too!

GBPUSD: Important Breakout 🇬🇧🇺🇸
Fundamentals support GBPUSD this week.
The pair managed to violate a key weekly resistance cluster.
The next goal for buyers now is most likely 1.297 resistance.
For buying, consider a confluence zone based on a rising trend line and a broken resistance.
❤️Please, support my work with like, thank you!❤️

✅GBP_CAD SHORT FROM RESISTANCE🔥
✅GBP_CAD is about to retest a key structure level of 1.692
Which implies a high likelihood of a move down
As some market participants will be taking profit from long positions
While others will find this price level to be good for selling
So as usual we will have a chance to ride the wave of a bearish correction
SHORT🔥
✅Like and subscribe to never miss a new idea!✅

EURGBP: Detailed Plan Ahead of FOMC & FED 🇪🇺🇬🇧
Multiple time frame analysis on EURGBP.
Price action & key levels.
Directional bias & thoughts.
❤️Please, support my work with like, thank you!❤️

🔥 NEW: GBPUSD 🔥 DAY TRADE 🔥SLO2 @ 1.2650 ⏳
SLO1 @ 1.2615 ⏳
TP1 @ 1.2600 (closing)
BSO @ 1.2550 ⏳
BLO @ 1.2525 ⏳

🔥 NEW: GBPCHF 🔥 DAY TRADE 🔥-SL @ 1.1395 🚫
SLO @ 1.1380 ⏳
SSO @ 1.1366 ⏳
TP1 @ 1.1340 (shaving 25%)
TP2 @ 1.1315 (shaving 25%)
TP3 @ 1.1300 (shaving 25%)
TP4 @ 1.1275 (closing ALL Sell Orders)
SUPPORT @ 1.1266
IBR @ 1.1250

EURGBP: Oversold Market & Pullback 🇪🇺🇬🇧
EURGBP looks very oversold after a selloff last week.
The price was consolidating within a narrow horizontal range
and violated its upper boundary early in the morning.
It signifies that a correctional movement is coming.
Goals will be 0.8565 / 0.8576
❤️Please, support my work with like, thank you!❤️
