GBPAUD: Important Breakout 🇬🇧🇦🇺
GBPAUD broke a key daily demand zone last week.
This week, we saw its retest.
The market was nicely rejected from that, confirming its strength.
I expect a bearish move to 1.7317 / 1.7255
❤️Please, support my work with like, thank you!❤️
Pound

GBPUSD - Navigating the current price actionHi traders,
GBPUSD is in a multi-scenario area, as the chart is not very clear right now.
One scenario is a continuation to the upside from here, another one is a retracement to the bullish area marked on the chart and then a continuation to the upside, and the third one is a deeper correction to the 4h-D trendline. All the scenarios are marked on the chart.
Trade with care.
Disclaimer: The analysis provided is purely informative and it should not be used as financial advice. We do not recommend making hurried trading decisions. You should always understand the risk that trading implies and that PAST PERFORMANCE IS NOT NECESSARILY INDICATIVE OF FUTURE RESULTS.

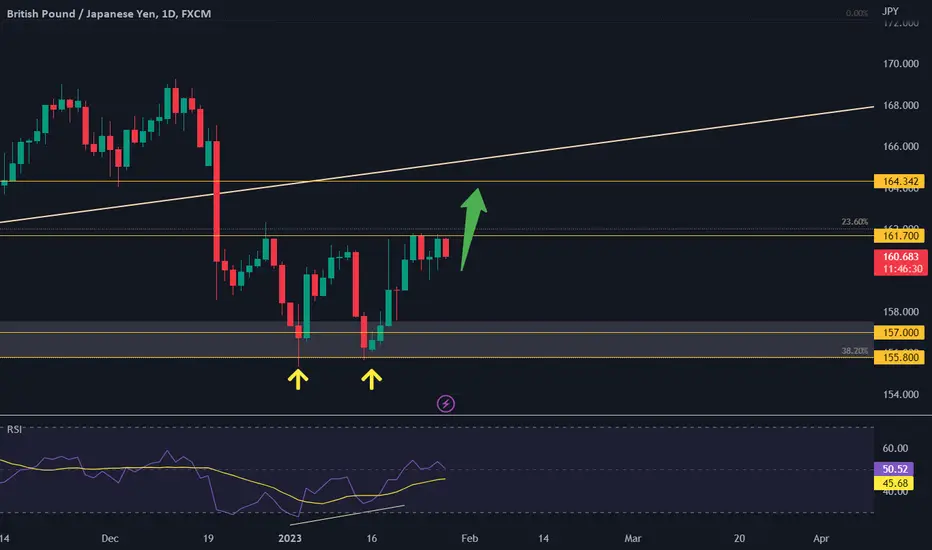
j.Hejazi | GBPJPY seems to be on the riseThe GBPJPY on the daily chart has formed a double bottom pattern, with a divergence on the RSI. A break of the neckline could indicate a move towards higher prices, potentially targeting 163.888.
----------------------
Let me know your thoughts in the comments, and show your support by liking the idea.
Please follow if you're interested in more ideas like this.
Your support is greatly appreciated!
GBPCAD LONGThis is GBPCAD and I expect it to go bullish, why?
1. The support zone at 1.64300 is a four hour support zone
2. I need price to come back to this support zone which supported price as of yesterday to come for a second leg buys.
This is one of the three pairs I've decided to be on till the rest of the year for psychological reasons, and I will try my best to drop daily update about these pairs.

GBP/USD Massive selloff 170 pipsGBP/USD is ready for a disastrous meltdown to downside price respecting the supply zone nice rejection and break of structure indicating shift of momentum to downside, and currently price is respecting the 61.8%fib level in confluence with broken support now act as resistance,
Nice risk to reward
Goodluck
Follow me and comment below on your ideas
Thank you!!!!

GJLooking at it on 15 min and it looks like a sell will prevail but ZZOOOOMM OOUUTT and you will see that is not the full picture. As part of it, the 1 hour there is an inverse H&S which has started forming. Just waiting for the break of the shoulder line before going forward and taking the trade. Till then stay watching and waiting.


GBP/CHF massive Buy opportunity 100pipsBasically the market structure is still in upward trend, we see a nice pull back to 38.2% fib level and nice triple bottom, we already got a nice confirmation on H4 candlestick (engulfing candle ) that indicate a nice bullish momentum, which is in confluence the the triple bottom,
So we need price to break the neckline to continue to our target 1 of 100pips
we have a nice risk to reward
Follow me for more breakdown like this
Thank you so much

EURUSD BUYEURUSD is in a strong bullish, there were 2 fakeouts, but the price continued up.
The structure at the price of 1.0871 has been broken,
which shows that the price continues its way up to the key resistance.

Buying Aussie against PoundThe pair just broke its strong support zone by formation of a huge bearish candlestick, indicating bears' control

GBPCHF: Time For Pullback 🇬🇧🇨🇭
GBPCHF is approaching a key level.
The price formed a double top pattern approaching that.
Its neckline was broken this morning.
I expect a pullback to 1.138 / 1.1364
❤️If you have any questions, please, ask me in the comment section.
Please, support my work with like, thank you!❤️

GBPUSD SHORTGbpUsd is in our suppply zone and we can also note that it is a double top. Should the bulls fail to close above our supply we will look for shorting opportunities.

GBPUSDHello traders ,what do you think about GBPUSD?This pair is moving in an upward channel. We expect it will grow to the midline of the channel and the 707 Fibo zone, then fall to the specified zone.
If this post was useful to you, do not forget to like and comment.❤️

RLinda ! GBPUSD-> Price in the correction start zoneGBPUSD is in a strong uptrend. The price is again trading in the price channel and again confirms its boundaries
The chart shows the key element, the price channel and the level of 1.23442. Previously, the price made a false break-through of the channel resistance, returned to the range and could not break through it on the retest, now the level 1.2344 takes up all the pressure, should it break-down, correction stage may start and we might see the price fall to 1.2153 area.
I assume that the price may slightly retreat from the correction zone to the area of 1.215-1.210. I expect consolidation under 1.234 and formation of the entry point for the sale.
Regards R.Linda!

GBPUSD in Upward Trend Channel, Target at 1.365Overview
The main view of this trade idea is on the Daily Chart.
The FX Cross GBPUSD is in an upward trend channel after making a historical low of 1.03595 on 26th September, 2022, it proceeded to make higher lows and higher highs. Higher lows within the trend channel can be observed around the 1.11519 and 1.18413 price levels which were made on 3rd November, 2022 and 6th January 2023 respectively. The higher highs of 1.14902 and 1.24468 were made on 4th October 2022 and 14th December 2022 respectively. The expectations are for the FX Cross to rally to 1.365. A negation of this view will be a decline to 1.155.
Technical Indicators
Several technical indicators support this uptrend. The Supertrend indicator turned to buy mode on 17th January while the Awesome Oscillator is above 0 and green. The RSI for GBPUSD is also above 50 and trending higher.
The intra-day trend following indicators of GBPUSD also show uptrends in the 15-Min, 2-Hr, 4-Hr and Daily timeframes. Short term support is observed around the 1.17 price level.
Recommendation
The recommendation will be to go long at market, with a stop loss at 1.155 and a target of 1.365. This produces a risk/reward ratio of 1.54.
Disclaimer
The views expressed are mine and do not represent the views of my employers and business partners. Persons acting on these recommendations are doing so at their own risk. These recommendations are not a solicitation to buy or to sell but are for purely discussion purposes.
At the time of writing, I have exposure to GBPUSD.

GBPAUD short triggered EOD stratA trend-following strategy that only takes a few minutes at the end of the day to set up and forget.
On the GBPAUD the shorts have been triggered and now we wait to see if we get to TP1 and a trend continuation.
Due to the initial stop being very wide, the risk per trade means the nominal lot size is very small.

EURGBPHello traders ,what do you think about EURGBP ? After reaching the resistance range, this pair could not cross it and fell. Now we expect it to fall to the specified zone with an upward correction
If this post was useful to you, do not forget to like and comment.❤️

GBPUSDSubscribe and get a free trading strategy for Bitcoin and other instruments every day!
Happy New Year and Merry Christmas my dear friends!🤑
The long idea at the 2H timeframe.
You can see the discount zone I showed and the double-bottom pattern.
P.S
I do not adhere to a time frame in my analysis of the instrument, a reaction in the instrument may occur earlier or later. It is important to understand the price movement when reacting to the level, as well as the buyer and seller reactions. Well, and a few more secrets, this material is not a trading recommendation )))

GBPUSD Daily: 15/01/2023: Short opportunity!
Well, there are two zones that if we have a low time frame confirmation we can sell.
First zone:
1.23417- 1.24462
Second zone:
1.253- 1.2667
Targets:
1.185
1.165
1.153
💥Important note: It's not a buy or sell signal, I just share a market opportunity with you. So do your own research.💥
💡Wait for the update!
🗓️15/01/2023
🔎 DYOR
💌It is my honor to share your comments with me💌

LONG ON GBP/CADPrice has created the perfect break and retest to the upside on this pair.
Here is the play I will be taking.
ENTRY - 1.64550
STOP LOSS - 1.63840
TAKE PROFIT - 1.66302

GBPJPY - Trend-Following Buy Setup!Hello TradingView Family / Fellow Traders. This is Richard, as known as theSignalyst.
🗒 GBPJPY has been overall bullish trading inside the orange rising wedge pattern, and it is currently approaching the lower orange trendline acting as a non-horizontal support.
Moreover, the zone 155 - 156.5 is a strong support zone .
📌 So the highlighted purple circle is a strong area to look for buy setups as it is the intersection of the green support zone and lower trendline in orange acting as an oversold area. What I call a TRIO retest!
📉 As per my trading style:
As GBPJPY approaches the lower purple circle zone, I will be looking for bullish reversal setups (like a double bottom pattern, trendline break , and so on...)
Always follow your trading plan regarding entry, risk management, and trade management.
Good luck!
All Strategies Are Good; If Managed Properly!
~Rich

GJTP smashed and even after closing us out, we still see more opportunity so I'm going to wait and watch so I stay ready.

GBPUSD Outlook 1/8Looking to see continuation of bullish price action on GU. NFP potentially could be the low of month, or at the very least a short term low that will be taken out in a late month reversal. annotations on chart.
