Pound swing tradeThe pound seems to be in a very large flag pattern, but a mini triangle pattern, so this brings about the perfect swing trade,the 200 MA will provide resistance and so thats the stop-loss, but the short is when the Pound drops below the 100 MA till the lower support trendline.
Pounddollar


4H GBP/USD Short OutlookWhen looking at the 4H GBP/USD, as the week gets kicked off look for the 01:00:00 candle to close bullish, as that would be the third requirement for a Morning Star set-up (look it up if you're not sure what I'm talking about), it is that verification that we need in order for the pullback to be valid. But that is all that it is, a pullback, and from the looks of proximity resistance levels, the 38.2% fibo retracement at 1.24182 coincides as a recent support level turned resistance. At that point you may wish to enter a short position with a SL above the 61.8% level. Another option is to scale in; enter half of a short position at the 38.2% level and the second half between the 50 and 61.8% levels IF and ONLY IF your personal analysis shows it pulling back beyond the 38.2. Regardless of your entry, long for a bearish expansion to the 1.22630 area, the next major support area.
Let's start the week off right and collect us some pips! And don't forget to take a look at my recent ideas, which have played out in a favorabe direction. And ultimately if you believe in my analyses, give me a follow and get notified of my future ideas.

GBPUSD SHORTShort trade opened on FX:GBPUSD .
- Trendline
Upward trend line has broken. Price is now stalling around a previous daily demand zone.
- Pin bar
Price has printed a 4hr pin bar suggesting a potential reversal.
- Bearish Flag
Bearish flag pattern on the 4hr suggesting a short continuation.
The 1hr is still bullish so entry could be really early here but the 4hr pin bar is a strong enough signal for me.

GU Rejection of trend line to trigger nice 5.4 risk/reward5.4 RR - Rejection @ 1.253 trend line level with an aim to TP1 @ 1.229 key level. TP2 1.223.
Lets see how this setup plays out. Could be a longer term hold across a couple of weeks potentially.

GBPUSD shortMA + EMA cross
Trendline break + retest structure
Expecting to see 1,24231
Don't forget to trade with proper RM/MM and caution.
Good luck guys

GBPUSD Thoughts A little bit late with my idea. I wanted to post it earlier but forgot.I expected price to rich yellow rectangles. It has not happened yet, but in 1-2 days it probably will happen.
Price made a very weak projection. And could not even reach 1.27 Fibo Level. And bears are more agressive. I can see 2 possible scenarios:
1. Trend change ( breaks yellow rectangle).
2. Price spends some time in a range between 1.2423-1.2528 ( complex correction) and then breaks the lower rectangle.
Remember: you should confirm my expectations with your own analysis.

GBPUSD Medium Risk Short & Long Reversal Potential Short Entry to 1.2280 level and reversal on previous key resistant level.

GBPUSD(4Hr) a bit more to the downside before up moveGBPUSD 4 hour chart still gives us some more momentum to the downside before the up move it is believed that price will eventually reach the 1.24000-1.24500 area if the area breaks the market structure we could see it go all the way to 1.2650 if it fails to break market structure we can see a further downside of 1.1990-1.1850
PS: This is not a trading signal just a market idea, please use a valid strategy to enter this trade, if you are not educated enough do not trade it! wait for clarity and correct signs before entering the trade! there is no 100% guarantee in trades! know how to risk manage your trades!
AceTeam FX #Forex #forextrader #forextraders #forexmarket


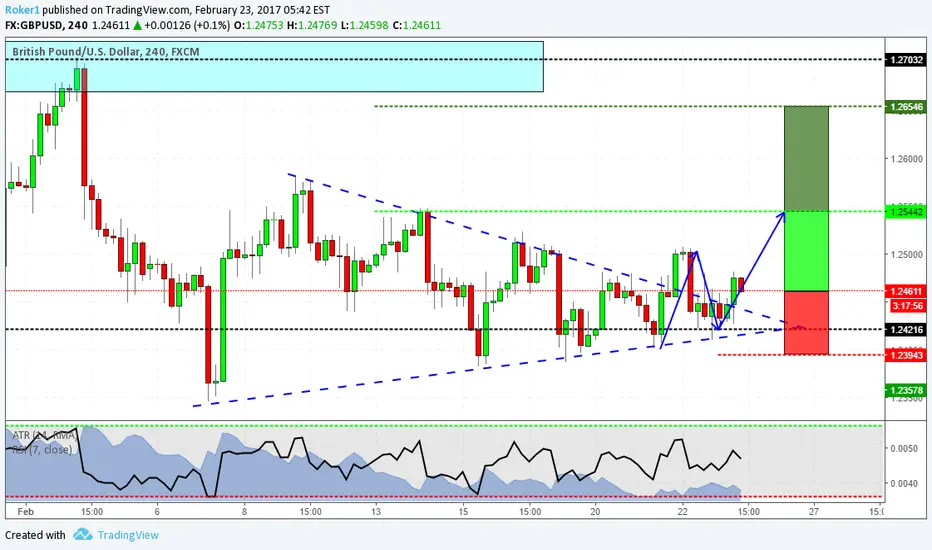
The triangle has been broken to the upside on GBPUSDHey guys,
just wanted to share my view on gbpusd; as you can see price has recently broken to the upside this simple pattern called triangle. It's basically made of two converging trendlines that encompass price action. You can take advantage of this pattern by simply buy at the first candle close above/below one of the trendlines, or you can wait for a retracement and then enter the market.
The bigger retracement has already happened, but as of now price level is nice in order to have a positive risk to reward ratio at the retest of the daily resistance near 1,2550, so it's appealing to me.
Entry at market, stops below 1,2400 even handle, target1 near 1,2550, target2 to be determined (approximately near the dark green line).
Let's see.
If you have any question, feel free to type it in below.
Otherwise, see you in the next chart!
GBPUSD short trade 18GBPUD short trade
MA200 Rejection
Daily momentum down
1H momentum down
Pin bar rejection of strong support resitance level
Trend line
1:1 risk reward

short Pound 1.22500 downside target follow me want to learn how to trade? go to www.goldsnipersacademy.com

Short GBP/USD March 2017Hi Traders, check out this H&S move. Could result up to 6500 pips. Limit unknown as never been this level before. The next price move -March 2017 - could be as far as the head level but in the opposite direction (down) - triggering of Art 50 could be the catalyst. As you can see already broken the neck line. Best to be prepared.

Bullish Cypher GBPUSDPossible bullish pattern, I expect it to hit the missed pivot. at 1.233. We may have one more impulse leg to the high creating the last leg of the elliot wave.

GBPUSD is supporting in 38.2% Fib retracement area.Now, Pound Sterling is supporting area in 38.2 Fib retracement zone. The start of downside Trend was 1.27240 since last year of Dec 5. Now, New government was came up. Everybody probably know that uncertainty make dollar falling sharply.
Good Luck to you!

$GBPUSD Advances to Retest Structure before Advancing HigherThe Pound will rally to previous structure lows before retesting last weeks close for a potential 38.2% Retracement downwards. No Significant bias on this move, the aim is to simply catch this retest for profit and trail as it progresses. My outlook is nothing less than 50 pips profit with a 15 pip stop loss. Almost 1:4 RW%.

A possible upcoming short on GBPUSD?GBPUSD has broken out of the daily trend line. now its looking to go back up and hit one of the fib retracement levels. most likely it'll show some sign of reversal at the 0.38 fib level or 0.5.
entry -1.25555
SL -1.26310
TP - 1.23761
risking 75 pips for 170!


GBPUSDHere i have gu. prices seem to be respecting that line on daily timeframe. i am looking for a possible long if i see that line is still being respected. if we see a break of that line i could possibly look for a short entry. i really want you guys to comment what you think and help me out on what i should do and dont.
thanks!!

GBP/USD: HOPPING ON THE TREND WITH PRICE ACTIONThe cable is making harmonic trend moves to the upside, respecting the channel, son now it is time to start surfing the next wave.
At the zone we have a major level of fibonacci,
a H4 support
a potential oversold scenario
and the cherry: lower band of the ascending channel
"You control how you trade, the market controls how and when you'll get paid"
CortesTeam
Twitter: twitter.com

Pound to Dollar forecast 1H to DailyPound to Dollar forecast for December 2016.
The exchange rate for beginning of December 1.23. Maximum rate 1.24, while minimum 1.20. Averaged rate for month 1.22. The forecast for pound exchange rate at the end 1.22, change for December -0.81%.
GBP to USD forecast for January 2017.
The exchange rate for beginning of January 1.22. Maximum rate 1.23, while minimum 1.19. Averaged rate for month 1.21. The forecast for pound exchange rate at the end 1.21, change for January -0.82%.
Pound to Dollar forecast for February 2017.
The exchange rate for beginning of February 1.21. Maximum rate 1.21, while minimum 1.16. Averaged rate for month 1.19. The forecast for pound exchange rate at the end 1.18, change for February -2.48%.
1H/4H Range looking for breakout
Daily Small UP Channel from 2016-10-06

GBPUSD SELL IDEA INVESTMENTGIVEN THE UPCOMING NEGATIVE BREXIT NEWS, I BELIEVE WE ARE SEEING THE 'BIRTH' OF A LON SHORT TREND.
'JUMP ON THE BOAT' FROM THE PREVIOUS MARKET LOW OF 1.23500.
