GBPUSD - Correction and then continuation to the downside?Hello traders,
Today we will do an analysis for GBPUSD. This pair is in a down trend on the daily timeframe that started on the 23th of January. Now, it is doing a corrective move from the last big impulse to the downside. The most probable scenario for this one is a pullback to the blue rectangle marked on the chart that coincides also with 70,5% retracement and then a continuation to the downside. However because the last impulse was sharp it can turn to the downside faster than anticipated and the price may not reach that area.
Another scenario that we are not considering as high probability right now is a reversal to the upside where the price must break the black trendline and the line marked as “high to break” on the chart, for us to wait for a retracement and then search for buy entries.
Please don't jump in, wait for your setups, no matter what, and don't risk more than 1% of your capital.
Pounddollar

GBPUSD - Correction and downHello traders,
The higher probability scenario for GBPUSD in the coming week is a correction to the upside and then a continuation to the downside. The area where the reversal is most possible is highlighted on the chart.
Trade with care.
Disclaimer: The analysis provided is purely informative and it should not be used as financial advice. We do not recommend making hurried trading decisions. You should always understand the risk that trading implies and that PAST PERFORMANCE IS NOT NECESSARILY INDICATIVE OF FUTURE RESULTS.

GBP/USD RANGE PLAYGBP/USD looks good to hit the target within this range it's currently in. Good bounce-off Demand/support. Cut trade and short below if the price starts to break down and fails to hold.

GBPUSD Daily: 15/01/2023: Short opportunity!
Well, there are two zones that if we have a low time frame confirmation we can sell.
First zone:
1.23417- 1.24462
Second zone:
1.253- 1.2667
Targets:
1.185
1.165
1.153
💥Important note: It's not a buy or sell signal, I just share a market opportunity with you. So do your own research.💥
💡Wait for the update!
🗓️15/01/2023
🔎 DYOR
💌It is my honor to share your comments with me💌

GBPUSD Outlook 1/8Looking to see continuation of bullish price action on GU. NFP potentially could be the low of month, or at the very least a short term low that will be taken out in a late month reversal. annotations on chart.

GBPUSD Bearish Impulse - Minor CGBPUSD is starting a Bearish Impulse in Minor C (orange).
Wave B (orange) is most likely a Running Flat.
However, based on Elliott Wave patterns, it could also reflect as an Expanding Flat.
But I don't think so.
I am going short on the Pound Dollar.
GBPUSD tech. Analysis:
* Elliott Wave: Ending Diagonal on Intermediate (C) (white).
* Running Flat in Minor B (orange)
* Sep '20 Bearish Fractal
* 38.2% Fibonacci Retracement of Minor A (orange)
* Up-Trend Breach
* Channel Consolidation
GBPUSD Trading Signal:
* Entry @ 1.2170
* SL @ 1.2500
* TP1 @ 1.1800 / TP2 @ 1.1600 / TP3 @ 1.2500
* BUY STOP @ 1.2050
* Aggressive Entry @ Market Price
* Moderate Entry @ 1.2320
*Safety Measure: when in the green, moving SL to BE.
Many pips ahead!
Richard, the Wave Jedi.

GBP/USD: Pound in a tough resistance zone. Pullback in sight?The British pound has staged an impressive 18% rebound since its September's lows and is now entering a pivotal week given the upcoming Fed's (Wednesday) and BoE's (Thursday) meetings.
Even though the latest signs of economic activity are mostly better or in line with expectations, they actually show that the economy is slowing down and that a recession is getting closer and closer. Following a 0.6% decline in September 2022, the UK GDP increased 0.5% in October, the largest growth in over a year and slightly above predictions of 0.4%. The service sector, which continues to be resilient, had the greatest expansion. Instead, industrial production in October 2022 was flat from the previous month, following a 0.2% decline in September, which also matched market expectations.
Continuing growth uncertainties and housing market jitters might have future dovish consequences for the BoE. On Thursday, it will be important to know if the differences between board members that have already come up are getting bigger. At the last BoE meeting, the vote to raise 75 basis points was divided (7-2).
Markets are pricing in 56 basis points, thereby fully expecting 50bps. As a result, anything less than 75bps will be a marginally negative outcome for the pound.
A hawkish Fed and a dovish BoE will have a negative impact on GBP/USD, which has recently re-established its correlation with the 2-year yield differential after decoupling from August to October.
How to tactically trade GBP/USD this week: Key technical levels to watch
The cable technically broke above the 200-day moving average (1.211) and has remained above it since the beginning of the month.
As we get closer to a crucial resistance area around 1.225-1.24, which corresponds to June highs and a 6-month 100% Fibonacci retracement level, the bullish wave is beginning to lose some of its momentum.
Following the solid rally since November, the upside potential for the pound looks to be rather stretched, and this week's rising risks of a hawkish Fed and USD bullish sentiment may lead to some pullbacks to 1.20 or lower.
1.196 is an intriguing initial line of support to keep an eye on, corresponding to the 78.6% Fibonacci level and the -1std of the 20dma Bollinger band. If cable fails to hold there, 1.161 (61.8% Fibonacci) might be a month-end target.

GBPCAD TREND CONTINUATION ENTRYFX:GBPCAD
we need to go more higher to take out te daily swing high liquidity

GBPJPY I Short-term plan before FOMCWelcome back! Let me know your thoughts in the comments!
**GBPJPY - Listen to video!
We recommend that you keep this pair on your watchlist and enter when the entry criteria of your strategy is met.
Please support this idea with a LIKE and COMMENT if you find it useful and Click "Follow" on our profile if you'd like these trade ideas delivered straight to your email in the future.
Thanks for your continued support!
Brian & Kenya Horton, BK Forex Academy

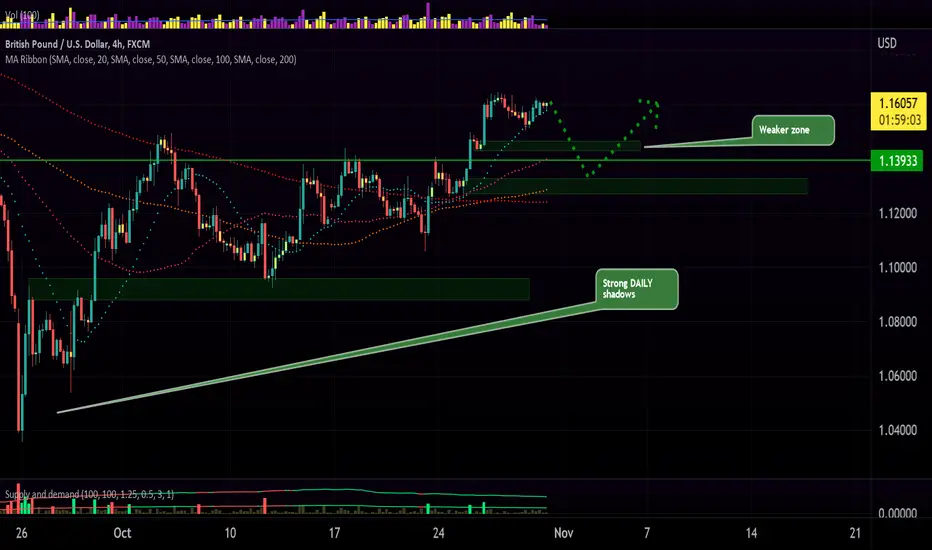
GBPUSD may reverse but continue rising for a while!I'll buy around the zones step by step. Long shadows in daily chart was a great sign of buyers power.
The pound is going to meet 1.00000Hello friends, I hope you are well
Reasons for the downward movement of the pound:
1. The triangle at the end of the trend is broken from the bottom side and it can be called as a trend continuation flag.
2. The dollar is strong at key support and buying expectations are rising, pushing the pound lower.
3. After breaking the chart, the price of the pound moved up and it can be called a rest and entry point.
4. The British economic situation shows almost no resistance to the fall of the pound.
SL (1.136)
TP1 (1.098)
TP2 (1.07)
TP3 (1.046)
Good luck.

GBP/USD analysis: Sterling is no longer supported by gilt yieldsFor most of 2022, currencies were helped by rising yields on short-term government bonds.
When looking at the UK bond market, rising gilt yields have reflected expectations of future interest rate hikes by the Bank of England, but ultimately they begin to incorporate more political and fiscal risks into their rate premium.
Given the turbulent political climate in the UK over the last two months, the volatility of UK gilts has been exceptionally high. Liz Truss announced her resignation as British Prime Minister on Thursday, following a hectic 45 days in office that included a gilt market crash and a U-turn on her budget proposals.
The most recent economic data, meanwhile, continue to paint a gloomy picture. September UK retail sales fell 6.9% year-on-year, a sixth consecutive monthly decline and worse than market expectations of a 5.0% drop. The GfK Consumer Confidence indicator went up a little bit to -47 in October, but it was still close to a record low of -49 in September.
The pound is now behaving differently than the yield on 2-year gilts. Rising gilt yields now reflect not only the inflation/interest rate environment, but also the higher investors' uncertainty about the stability of the UK bond market. Episodes of rising gilt yields over the past few weeks have been correlated with a weaker pound.
This playbook can be expected to continue in the coming months. If 2-year gilt yields were to surpass the 4% threshold once more, this would likely put downward pressure on the pound, which could eventually test and break below 1.10.

Idea for swing trade(short)Composite Indicator:
TrendSpotter:Sell
50 - 200 Day MACD Oscillator:
50 - Day Average Volume: 301,829
Average: 100% Sell

GBP/USD SELL IDEAStoryline: GU is currently in a bearish condition and has been that way for a minute.
Basically the whole year so far.
Last week price action initiated a sell for the continuation of the trend.
Price is currently moving off a weekly OB and headed for 1.03720
which is the -sell side liquidity that lies below the previous range swing low.
Follow for more...
Thanks for reading :)

GBP reversal pointAfter finished 5 Elliot waves, now it's time to a,b,c to finish his h&s
This is my idea for long time pound will go high

GBPSDThe pound has reached a major order block resistance, and the dolllar seems to be collecting momentum.

GBPUSD Shortterm LongAfter the crash on Friday, a rally towards 1.24 should start in the next few days.

The when, why, and how sterling reaches parity In just two trading days, the probability that the sterling will fall to parity against the US dollar increased to 60% on Sept. 26 from 32% on Sept. 23 after the UK government's announcement of new tax cuts elevated concerns for the country's economy.
Bloomberg estimates that the GBP/USD will have equal value before the end of 2022, based on sterling-dollar implied volatility. The value of the sterling was $1.0350 as of Sept. 26, marking a record low for the currency.
Economists believe that the slump in the pound could force UK's central bank to enact another interest rate increase in order to support the currency, The Guardian reported. Capital Economics UK Economist Paul Dales told the paper that the Bank of England could raise interest by 100 basis points or 150 basis points.
The weakness in the pound is being exacerbated by fears the UK economy is entering a recession after inflation breached the 10% mark in July, marking a record-high for the country. It elicited a promise from the Bank of England that it will "respond forcefully, as necessary" to curb the growth in the prices of goods and services.
The path to parity
The downward movement of the sterling follows the UK government's announcement of new tax cuts, fueling the concerns of investors and economists that the four-nation country's debt will reach unaffordable levels and further fuel inflation. It also comes after the Bank of England increased rates by 50 basis points, lower compared with the 75 basis-point hike of the US Federal Reserve.
The government intends to finance its tax cuts with debt worth tens of billions in sterling. The UK Debt Management Office is planning to raise an additional 72 billion pounds before next April, raising the financing remit in 2022-2023 to 234 billion pounds.
Deutsche Bank UK Economist Sanjay Raja said the tax cuts were adding to medium-term inflationary pressures and were "raising the risk of a near-term balance of payment crisis."
Vasileios Gkionakis, a Citi analyst, echoed sentiments that the move will bring the sterling to parity with the US dollar, noting that "the UK will find it increasingly difficult to finance this deficit amidst such a deteriorating economic backdrop; something has to give, and that something will eventually be a much lower exchange rate."
"Sterling is in the firing line as traders are turning their backs on all things British," said David Madden, a market analyst at Equiti Capital. "There is a creeping feeling the extra government borrowing that is in the pipeline will severely weigh on the UK economy."
If it comes to pass, what then?
The implications of the sterling being at parity with the US dollar boil down to how and where the money is being spent. When the euro was at parity with the dollar, there were winners and losers and the same could be expected if ever the sterling is at the same value as the dollar.
For trading and exporters, the change in the exchange rate will surely be noticeable. In the US, a stronger dollar would mean lower prices on imported goods, which could help cool down inflation. The opposite could be anticipated for the UK as previous payments would afford lesser products if the two currencies are at parity.
Accordingly, US companies doing business in the UK will see revenue from those businesses shrink if they bring back earnings in pounds to the US. However, if pound earnings are used in the UK, the exchange rate becomes less of an issue.

Can Pound pullback for the end Week of September ?
Due to Dollar Index (DXY) impulsive bullish opening on Monday Market (Asian Session) , can Pound evolved into bullish pullback at the end Week of September ?

GBPUSD longTP1 and move SL to BE FX:GBPUSD
It's possible that I'll use different entry points, take profits, stop losses and tactics, but my trades will respect the direction as shown on the chart.
Trade at your own risk, I'm not a financial advisor.

GBPUSD longterm viewThe pound should probably be on the verge of a correction to the 1.24 area after the crash of the past few months. However, the final low in the area between 0.90 and 0.94 is still on the agenda to follow this correction.
It would also be conceivable that the large correction of 1985 to 2007 represents an x at a higher level. This would intensify the downside potential significantly further and the target on the downside would be between 0.53 and 0.87. However, I am assuming the z scenario, as this is more consistent with the waves on shorter time frames.

GBPUSD Long Trade SetupA bullish opportunity recently presented itself on the pound-dollar trading chart. This follows from the bullish harami candlestick pattern which printed just above the 1.14000 psychological level. A stop loss below the same psychological level and a profit target anywhere between your entry and the swing high of 1.22956 could give you a reward-to-risk ratio as high as 5 or even higher. Be sure to size your position based on your trading account balance and apply other risk management measures before placing trades.
Rooting for you!
Your FX Plug
FX:GBPUSD

Has the news of the Queen affected the Pound? GBP/USD It was announced today that the Queen has passed away today after a 70 year reign. We look at whether this has affected the pound. For GBP/USD the market has not been affected as significantly as traders may have thought, considering the overall negative market sentiment.
The pound dollar continues to consolidate within the range indicated with the daily RSI beaten down into oversold territory.
Will there be breakouts in the coming days?
