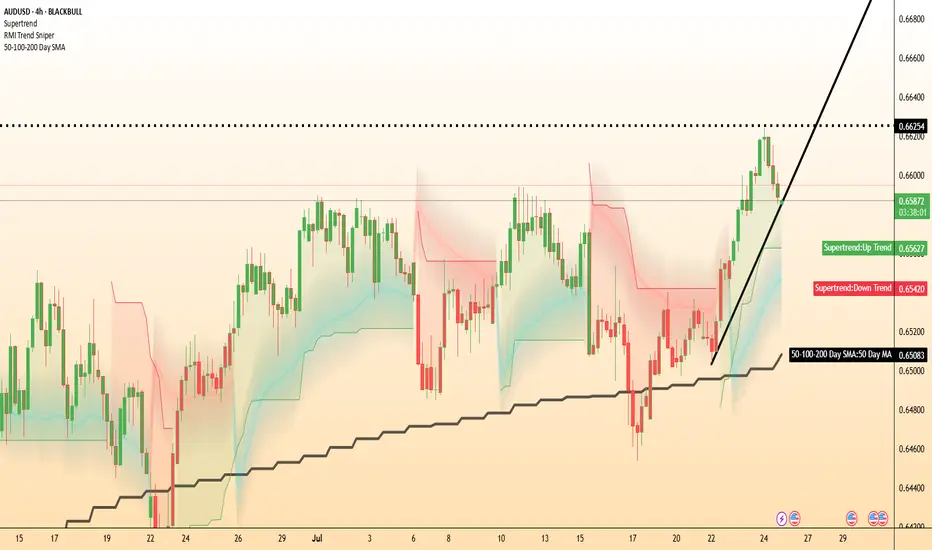
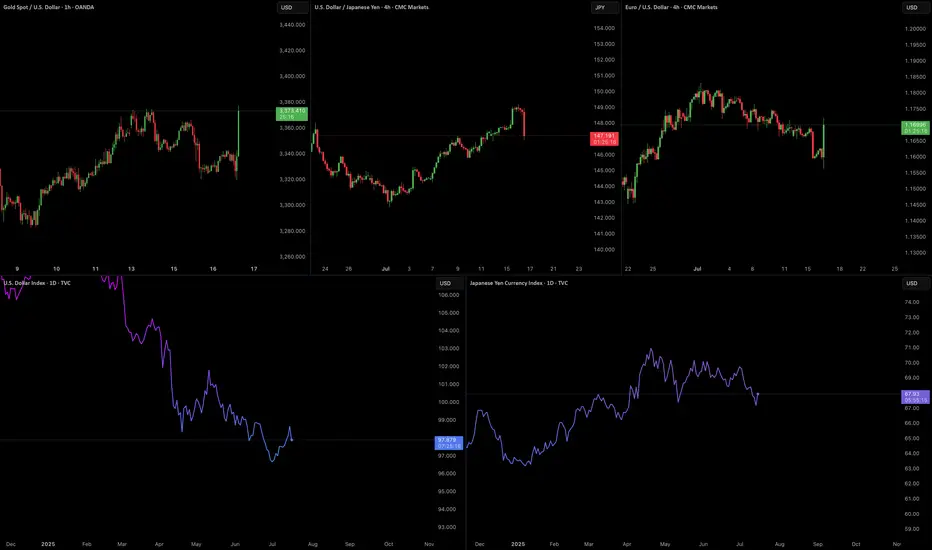
AUD/USD tests uptrend as Trump targets Powell at Fed siteThe US dollar is trading mixed after President Trump made a rare appearance at the Federal Reserve’s renovation site, in an attempt to distract from you know what.
While the visit had no formal policy announcements, Trump did try to further undermine Chair Jerome Powell by erroneously claiming the renovation cost had blown out to 3.1 billion by adding the cost of a building finished 5 years ago.
Meanwhile, AUD/USD could be of the most interest. Traders might like to watch to see if it can hold its uptrend after its downside breakout from yesterday. AUD/USD remains potentially supported above its 50-DMA, with momentum pointing to potential further upside beyond 0.6625.
Powell
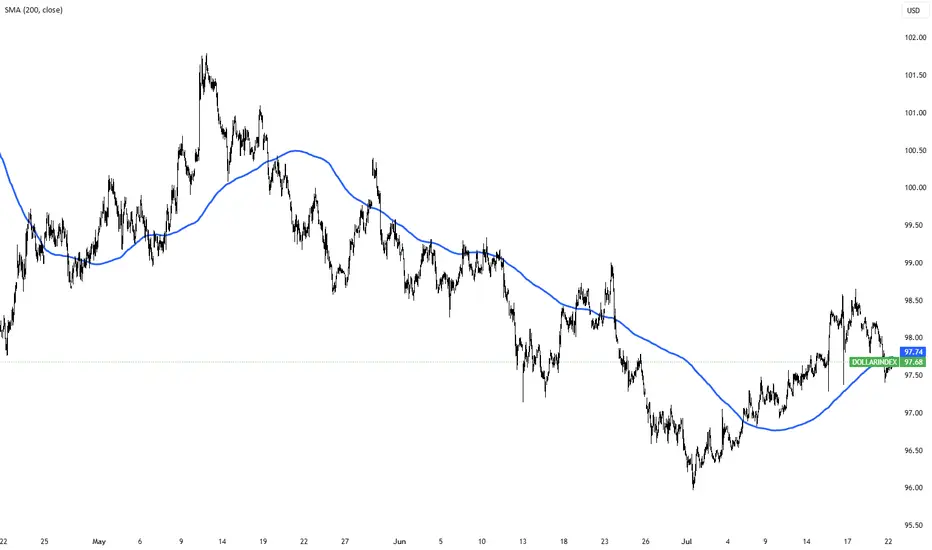
Dollar Index Holds Below 98 as Markets Await Trade Deal ProgressThe dollar index remained below 98 today, extending its two-day decline as investors watched trade negotiations ahead of the August 1 deadline. Treasury Secretary Scott Bessent said deal quality is the priority, suggesting Trump could grant extensions to countries showing real progress.
Markets are also focused on Fed Chair Powell’s speech for signals on interest rates. Despite Trump’s push for a cut, traders are not expecting action this month.
Weekly $SPY / $SPX Scenarios for July 21–25, 2025🔮 Weekly AMEX:SPY / SP:SPX Scenarios for July 21–25, 2025 🔮
🌍 Market-Moving News 🌍
🏦 Fed Chair Powell Speaks — Markets Key Into Tone
Federal Reserve Chair Jay Powell’s Jackson Hole speech is the week’s centerpiece. Markets will be closely listening for clues on inflation strategy, rate-cut timing, and sensitivity to geopolitical inflation drivers like tariffs.
📦 Tariff Deadlines Gain Spotlight
Multiple tariff deadlines are set this week for targeted trade partners including the EU, Mexico, Canada, Japan, South Korea, and Thailand. Any new announcements or extensions could trigger volatility in trade-exposed sectors.
🛢️ Oil Market Mixed Signals
Brent crude prices have stabilized near mid-$70s, but OPEC+ discussions regarding supply extensions and global growth concerns continue to inject uncertainty into energy-linked equities.
📈 Big Tech Earnings Kick Off
The “Magnificent Seven” tech giants begin reporting: Nvidia leads on Tuesday, followed by Microsoft, Amazon, Alphabet, and Meta later in the week. Expect significant sentiment swings based on forward commentary.
📊 Key Data Releases & Events 📊
📅 Monday, July 21
Quiet session ahead of a packed week of speeches and data.
📅 Tuesday, July 22
8:30 AM ET – Existing Home Sales (June):
Measures signed contracts on previously owned homes—a key housing indicator.
After Market Close – Nvidia Q2 Earnings:
Market will watch guidance and China commentary.
📅 Wednesday, July 23
8:30 AM ET – Leading Economic Indicators (June):
An early gauge of U.S. economic momentum.
📅 Thursday, July 24
8:30 AM ET – Initial & Continuing Jobless Claims:
Labor-market health indicator.
📅 Friday, July 25
8:30 AM ET – Durable Goods Orders (June):
Signals demand for long-lasting goods, often driven by business spending.
8:30 AM ET – New Home Sales (June):
Follows existing home data for housing sector insight.
4:00 PM ET – Fed Chair Powell Speech at Jackson Hole:
Expect commentary on inflation, growth, and rate-path clarity.
⚠️ Disclaimer:
This content is for educational and informational purposes only and should not be construed as financial advice. Consult a licensed financial advisor before making investment decisions.
📌 #trading #stockmarket #economy #Fed #earnings #housing #durablegoods #JacksonHole #technicalanalysis
Earnings Heat Up - 6300 and 6200 SPX Key Levels RemainMarket Update
SPX Key Levels
-SPX poked 6300 Tuesday, Thursday, and poked higher Friday (but settled back to 6300)
-6200 support remains a key level
-6050/6000/5800 next floor levels, I'll be looking for dips
I can see the market slowly (and I mean SLOWLY) grinding higher but preparing for a
reasonable seasonal selloff through end of July into end of September window
July 28-August 1 is a monster week in the markets
-Megacap Earnings (MAG7 Tue/Wed/Thu)
-Wed July 30 - FOMC (Pause expected but Powell's Press Conference is important)
-Friday August 1 - Non-Farm Payroll, Tariff Deadline
I'm hitting fresh YTD highs so I'm not complaining about this melt-up and grind, I'm simply wanting to allocate positions and add to my positions at better levels and with a slightly
higher VIX to help take advantage of the expected move being greater than the actual move
Have a great weekend and thank you watching!!!

NordKern - XAUUSD InsightNordKern | Simplified Insight OANDA:XAUUSD Short Opportunity Ahead
Gold saw a sharp surge in price today, primarily driven by political headlines that temporarily shook market sentiment. To be specific:
📅 Jul 16, 2025 – 16:56 CET
CBS Reports: Trump asked Republican lawmakers whether he should fire Fed Chair Jerome Powell. This headline alone triggered an intraday spike of +$52/oz in gold as markets priced in increased macro and institutional risk.
As previously stated "Context Matters."
While the President cannot remove the Fed Chair without cause, even the suggestion introduces uncertainty and undermines confidence in the Fed’s independence especially ahead of a high-stakes election cycle.
However, further developments quickly followed: 📅 Jul 16, 2025 – 17:58 CET
Trump: “Firing Powell is highly unlikely.” 📅 Jul 16, 2025 – 18:06 CET
Trump: “Reports on me firing Powell are not true.” With this clarification, the initial rally appears overstretched and sentiment-driven, leaving room for a corrective pullback as the market digests the full picture.
Trade Setup - Short Bias
Parameters:
Entry: 3356.40
Stop Loss: 3690.30
Take Profit: 3322.00
Key Notes:
- The spike was headline-driven and not supported by policy shift or macro data.
- Trump’s denial removes much of the political risk premium that had been briefly priced in.
- Watch for momentum fading near resistance and confirmation via intraday structure.
This remains a tactically driven setup. Manage risk appropriately and stay alert for any renewed political developments.
Market Outlook - Trump Questions Powell’s Job - Gold RalliesNordKern active market outlook, reacting to the latest news.
Market Alert | Trump Questions Powell’s Job - Gold Rallies, Dollar Slips
Jul 16 2025 16:56:19 CET: CBS CITING SOURCES:
TRUMP ASKED REPUBLICAN LAWMAKERS IF HE SHOULD FIRE FED'S POWELL
Market Reaction:
OANDA:XAUUSD +$45/oz intraday, currently trading near session highs.
Safe-haven demand and inflation hedge as Fed credibility is questioned.
TVC:DXY Weakens notably against both the TVC:EXY and the TVC:JXY
Markets pricing in higher political risk premium, potential dovish tilt under Trump.
Volatility: Spiking across FX and commodities. VIX and MOVE indexes also showing upward pressure.
Context Matters:
While the Fed Chair cannot be dismissed without cause, even the suggestion of removal injects significant uncertainty into the macro backdrop. Historically, markets react negatively to perceived threats to Fed autonomy (see: Nixon-Burns, Trump-Powell 2018). This development comes just months before the U.S. election, adding a new layer of complexity for macro traders.
What to Watch:
- Fed Speakers: Any defense of Powell or pushback could stabilize markets. Or not.
- Trump Campaign Statements: Will he double down or walk it back?
- Upcoming Data: A dovish-leaning CPI/Jobs print could supercharge gold and further weigh on the dollar.
- Volatility: Traders should adjust position sizing and risk accordingly.
Increased geopolitical and monetary risk are back on the table. Traders should remain nimble, reduce leverage where appropriate, and stay alert to headline risk. Gold and FX are likely to remain reactive into the US session.
NordKern
Breaking News - Trump vs. PowellJul 16 2025 16:56:19 CET: CBS CITING SOURCES:
TRUMP ASKED REPUBLICAN LAWMAKERS IF HE SHOULD FIRE FED'S POWELL
OANDA:XAUUSD sees upside +35$/oz after Trump has asked the republican lawmakers if he should fire Powell.
TVC:DXY weakens against TVC:EXY and TVC:JXY after Trumps question.
Volatility is increased.

What Happens the Day Jerome Powell Is Fired or Quits?A sudden exit by Fed Chair Jerome Powell would create both a political and monetary shock.
While the Chair is technically protected from arbitrary removal. Recent reports confirm that President Trump and his allies are scrutinising the Fed’s $2.5 billion renovation project—potentially laying the groundwork for a “for cause” dismissal.
A surprise departure would undermine confidence in the Fed’s independence. The U.S. dollar could fall sharply across major pairs.
USD/JPY could fall toward ¥145, with safe-haven demand favouring the yen. However, the reaction may be less severe than in pairs like Swiss franc which we have noted in the past is the potentially preferred safe haven. A panic selloff could extend to 142.20—a prior consolidation floor.
GBP/USD could surge as traders anticipate a more dovish Fed stance under the new Trump-stooge Fed Chair. From a technical perspective, GBP/USD is maybe already oversold and potentially poised for a potential rebound anyway—Powell’s resignation or firing could potentially exacerbate this. The first level to watch being a return to 1.3700, assuming the likely expectation of Fed rate cuts rise.

Sintra Signals: Central Banks Stay Cautious The ECB Forum in Sintra brought together the heads of the world’s most influential central banks—Lagarde (ECB), Powell (Fed), Bailey (BOE), Ueda (BOJ), and Rhee (BOK).
Across the board, central banks are remaining cautious and data-driven, with no firm commitments on timing for rate changes.
Fed Chair Powell said the U.S. economy is strong, with inflation manageable despite expected summer upticks. He noted tariffs have delayed potential rate cuts and confirmed the Fed is proceeding meeting by meeting.
BOE’s Bailey highlighted signs of softening in the UK economy and said policy remains restrictive but will ease over time. He sees the path of rates continuing downward.
BOJ’s Ueda noted headline inflation is above 2%. Any hikes will depend on underlying core inflation which remains below target.

PCEs & attacks on PowellWe are carefully monitoring the PCEs today, to see, "wins" this small battle in the rate-lowering war. Let's dig in.
Let us know what you think in the comments below.
Thank you.
77.3% of retail investor accounts lose money when trading CFDs with this provider. You should consider whether you understand how CFDs work and whether you can afford to take the high risk of losing your money. Past performance is not necessarily indicative of future results. The value of investments may fall as well as rise and the investor may not get back the amount initially invested. This content is not intended for nor applicable to residents of the UK. Cryptocurrency CFDs and spread bets are restricted in the UK for all retail clients.

Australia's CPI slows, raising rate cut expectationsThe Australian dollar is showing limited movement on Wednesday. In the European session, AUD/USD is trading at 0.6495, up 0.08% on the day.
Australia's inflation rate headed lower in May. Headline CPI rose 2.1%, after gains of 2.4% in the previous three months. This was below the market estimate of 2.3%. Monthly, CPI eased to 0.4%, driven by lower petrol and housing costs.
The key core CPI indicator, annual trimmed mean inflation, also dropped sharply, to 2.4% from 2.8%, its lowest level since Nov. 2021.
The soft inflation report has boosted the case for the Reserve Bank of Australia to lower rates at the July meeting. The markets have priced in a 90% probability of a quarter-point cut, up from 81% prior to the inflation release. The markets have priced in three more rate cuts this year, following rate cuts in February and May.
The markets are counting on the RBA to be dovish in the second half of 2025. With inflation not only within the RBA's target of 2-3% but also falling, the markets expect that the RBA will be keen to lower rates in order to preserve economic growth.
Federal Reserve Chair Powell testified before a House Committee on Tuesday and had a cautious message for lawmakers. Powell said that the Fed was committed to keeping inflation contained and that the Fed planned to maintain rates until the impact of tariffs on inflation was more clear and reiterated that inflation still remained above the Fed's 2% target.
Powell has faced blistering criticism from President Trump for not lowering rates. In his testimony, Powell said that Trump's attacks were "having no effects" on Fed policy.
AUD/USD pushed above resistance at 1.3726 and is testing resistance at 1.3727. Above, there is resistance at 1.3750
1.3713 and 1.3702 are the next support levels

Australian dollar jumps on Israel-Iran cease fireThe Australian dollar is up sharply on Tuesday. In the North American session, AUD/USD is trading at 0.6504, up 0.70% on the day.
Investors' risk appetite is higher today after Israel and Iran agreed to a ceasefire in their 12-day war. The markets have reacted favorably to lower oil prices as fears that Iran would close the Straits of Hormuz, which would have disrupted global oil supplies, have diminished. Risk appetite has returned and risk currencies like the Australian dollar have posted strong gains today.
The Israel-Iran war has triggered sharp swings in oil prices and there are fears of an oil price shock if the fragile ceasefire does not hold. An oil price shock would send petrol prices higher and boost inflation, complicating the Reserve Bank of Australia's plans to lower interest rates.
Australia CPI expected to ease to 2.3%
Australia releases the May inflation report early on Wednesday. Headline CPI has been stuck at 2.4% for three consecutive months, within the Reserve Bank of Australia's target of 2-3% and its lowest level since Nov. 2024. The market estimate for May stands at 2.3%. Trimmed Mean CPI, a key core inflation indication, edged up to 2.8% from 2.7% in April.
The Reserve Bank will be keeping a close eye on the inflation report, with the central bank making a rate announcement on July 8. The RBA trimmed rates by a quarter-point in May and has shifted to a more dovish stance - the Board discussed a jumbo half-point cut at the May meeting.
Fred Chair Powell appears before Congress today and Wednesday and is likely to defend the Fed's wait-and-see stance. The Fed is concerned about President Trump's tariffs and the Israel-Iran war threatens stability in the Middle East, hardly the recipe for further rate cuts. Still, there appears to be some dissent within the Fed, as two members, Michelle Bowman and Christopher Waller, have suggested that the Fed could lower rates as early as September.
AUD/USD is testing resistance at 0.6490. Above, there is resistance at 0.6522
There is support at 0.6400 and 0.6342

Upward Momentum, Caution Near 106,500–110,000 Resistance__________________________________________________________________________________
Technical Overview – Summary Points
Momentum: Strong bullish bias on mid/long-term (1D-4H), short-term "Down" divergences (1H/2H). Overall alignment, no capitulation/euphoria signals.
Key supports / resistances: Supports at 103,300/102,600 (D Pivot Low, 720 Pivot). Major resistances: 106,480–109,952. Price compression under daily/weekly resistance, technical rejection risk.
Volumes: Normal to moderately high, 1H abnormal volumes signal possible squeeze.
Multi-TF: Bullish confluence 1D–6H, short-term Down divergences, caution required for late long entries under resistance.
Risk On / Risk Off Indicator: "Strong Buy" signal consolidated across all timeframes except 15min (neutral ST), sector bullish.
ISPD DIV: Neutral on all TFs – no behavioral overheating or exhaustion.
__________________________________________________________________________________
Strategic Summary
Overall bias: Bullish HTF setup (1D–4H), buy opportunities on dips towards 103,300/102,600, stop <102,000.
Risk zones: 106,480–109,950 = resistance cluster, active management required. Technical invalidation below 102,000.
Macro catalysts: Window of increased volatility 15:00–16:00 UTC (CB Consumer Confidence & Powell speech). Middle East geopolitics = “wildcard”, caution on any escalation.
Action plan: Buy on pullback, manage actively >106,000, mandatory protection during news hours, reassess post-macro-volatility.
__________________________________________________________________________________
Multi-Timeframe Analysis
1D & 12H: Upward momentum confirmed, solid supports, no exhaustion signals, Risk On / Risk Off Indicator "Strong Buy".
6H–4H: Technical and behavioral confirmation, constructive volumes, caution near immediate resistances.
2H–1H: Short-term downside divergence, 1H very high volumes = potential squeeze or shakeout, active caution required under resistance.
30min–15min: Consolidation/digestion; Risk On / Risk Off Indicator neutral at 15min, no impulsive entry point yet.
Summary: Robust up-structure on HTF, buy-side strategies on dips favoured, active management imperative near resistance and macro volatility events.
__________________________________________________________________________________
Fundamental, On-Chain & Macro Risks Analysis
Macro news: No immediate catalysts except USD news (CB Consumer Confidence, Powell) at 15:00-16H00 UTC, source of temporary volatility – no prevailing trend in question at this stage.
On-chain / Market: High volumes, institutional leadership, no “retail” panic, no flush/fomo, healthy structure.
Leverage: OI >$95B, stablecoin dominance, risk contained except on external triggers (macro, geopolitical).
Geopolitics: Middle East context = spike risk, active management mandatory on escalation.
__________________________________________________________________________________
Summary:
• Dominant bias Up (buy on dips >102,600), active management below major resistances (106,500–110,000).
• Key stop <102,000 (invalidation).
• Increased risk window: 15:00–16:00 UTC (USD news).
• Monitor leverage, adjust exposure ahead of key catalysts.

From $1 to $10 doing 900% in 2 days $KIDZ💣💥 $1 to $10+ in 2 days +900% NASDAQ:KIDZ similar to AMEX:GPUS
Shortsellers attempted similar tricks during the day and got squeezed the same way on both 🤣 making us awesome gains along the way
Please 🐻 attempt to do it again on next setups.
3 Buy Alerts in $3.50 - $4.00 range more than enough money made into vertical to $10+

British PMIs fall, Trump says won't fire PowellThe British pound dropped as much as 0.7% earlier today and is under pressure. In the North American session, GBP/USD is trading at 1.3265, down 0.45% on the day.
The pound has taken advantage of broad US dollar weakness recently, rising 3% in the month of April. On Tuesday, the pound climbed as high as 1.3423, its highest level since September 2024.
UK PMIs reports softened in April, another reminder that that the UK economy is struggling. The Services PMI fell to 48.9 from 52.5 in March, below the market estimate of 51.3. There are growing fears that the UK will fall into recession and global economic uncertainty has led to decreased business activity.
The Manufacturing PMI eased to 44.0, matching the market estimate but lower than the March reading of 44.9. This was the lowest reading since August 2023 as the deteriorating global market outook has reduced demand for UK exports. The increase in employer tax contributions has hurt employment and lowered confidence.
The International Monetary Fund has lowered its 2025 global growth forecast to 2.8, down from 3.3% in January. The downgrade was in response to US tariffs and the IMF warned that an escalation of trade tensions between the US and other countries would create further market volatility and lead to even lower growth.
US stock markets are sharply higher on Wednesday after President Trump said that he had no intention to fire Federal Reserve Chair Jerome Powell. Trump had intensified his attacks on Powell in recent days, resulting in sharp slides in US equity markets and the US dollar.
Trump also said that China tariffs would drop "substantially" and investors hope this signals a de-escalation in the nasty trade war between the US and China.

Trump vs. Powell: 4d Gold Price Roller Coaster📊 Summary of Recent 4 Trading Days
During the ongoing US-China trade war, President Trump has ramped up his public criticism of Federal Reserve Chair Jerome Powell. Though he lacks the authority to remove Powell directly it seems, Trump's frustration with the Fed’s independent policy direction has led to an apparent institutional power struggle.
This conflict hasn’t gone unnoticed by the markets. Just the mention of removing Powell caused the gold price to spike, as stock market money got squeezed out, amplified by tensions in the trade war. The Federal Reserve’s credibility is high, so such remarks naturally trigger significant volatility.
After Trump's initial outburst, gold surged $216. But when he softened his tone, the price reversed just as dramatically—falling about $240 (with the trading day still ongoing at the time). Hopes for progress in trade negotiations also played a role in this sharp reversal.
⚠️ Warning Signs of Market Distortion
Statements from the US President now function almost like market-moving events in addition to normal news. For gold traders, this creates an unstable environment where typical technical setups may fail.
The past days showed signs of manipulated or artificial movements—with potential insider activity. One notable example: Gold looked set to break higher after a 1-hour candle closed above the EMA 20 line. But a sudden $12 bearish candle in the last 30 seconds erased the setup. It felt orchestrated—possibly by institutional players defending key levels.
💡 Trader’s Takeaway
Don’t blindly trust technical signals in this environment.
Watch for political noise—it’s louder than usual.
Prefer quieter markets if you’re risk-averse.
Expect $100+ daily ranges and frequent price whipsaws.
🗣 What’s your take?
Is Trump really influencing the gold market on purpose—or just creating chaos? Let’s discuss below. 👇
-------------------------------------------------------------------------
This is just my personal market idea and not financial advice! 📢 Trading gold and other financial instruments carries risks – only invest what you can afford to lose. Always do your own analysis, use solid risk management, and trade responsibly.
Good luck and safe trading! 🚀📊

What if Kid Rock ran the Fed?Gold has broken above $3,400 for the first time, setting a new all-time high as investor confidence in the United States continues to decline.
Citi forecasts gold could reach $3,500 within the next three months. However, this projection might be underestimating Trump’s potential to further undermine confidence in the US.
On Monday, President Trump intensified pressure on Federal Reserve Chair Jerome Powell, calling him a “major loser” and demanding immediate interest rate cuts. Last week the President said, "Powell's termination cannot come fast enough,".
A move to dismiss Powell would likely trigger significant market volatility. Markets generally view Powell as a stabilizing figure, and history shows that a less independent central bank is less effective at keeping inflation under control.
I think it might be fair to wonder what a Federal Reserve Chairman Kid Rock would do for the price of gold.

Yen surges to five-month high as US dollar under pressureThe Japanese yen came flying out of the gates on Monday. In the European session, USD/JPY is trading at 141.00, down 0.79%. Earlier the yen strengthened to 140.47, its strongest level since Sep. 2024.
The US dollar has posted losses against the major currencies on Monday, including against the yen. Investors gave the US dollar a thumbs down after President Trump's top economic advisor said that Trump was considering the dismissal of Fed Chair Jerome Powell.
Trump has been increasingly critical of Powell for not lowering interest rates and said last week that "Powell's termination cannot come fast enough". Trump fired his latest salvo after Powell said that US tariffs would raise inflation and that the Fed could find itself having to balance keeping a lid on inflation and supporting economic growth. Powell added that tariffs are "likely to move us further away from our goals".
Powell has insisted that he isn't going anywhere and will serve until the end of his term in May 2026. Can Trump legally fire Powell? That is a complicated legal question, but the markets aren't waiting for an answer and the US dollar has retreated.
Trump's attacks on Powell threaten the independence of the US central bank and is eroding confidence in the US dollar. The dollar is also under pressure from Trump's tariff policy, which has dampened the confidence of foreign investors.
USD/JPY has pushed below support at 141.16. Below, there is support at 140.14.
There is resistance at 142.62 and 143.64

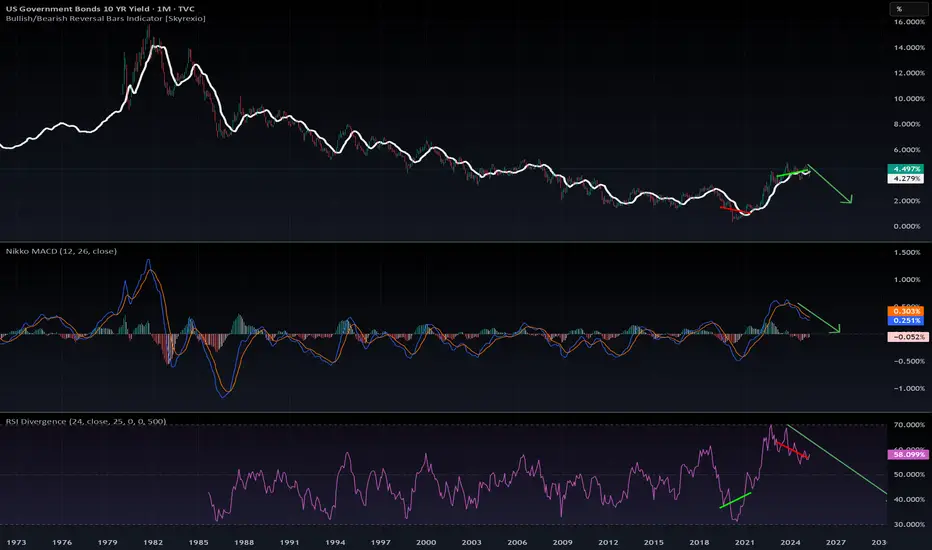
10YR Bond Yields: Panic on LTF, Calm on HTF📉 10YR Bond Yields: Panic on LTF, Calm on HTF
Yes, the recent spike in the 10-Year Yield is causing some short-term panic. But if you zoom out to the monthly timeframe, the bigger picture looks far more constructive.
🔍 Here’s what the chart says:
The MACD and RSI on the monthly are both pointing down.
Yields touched 4.5%, historically a key recession threshold.
We’re now seeing a MACD bearish crossover and a clear bearish divergence—classic signs of a trend reversal.
💡 What does this mean?
If no new fear or shock hits the market, yields are likely headed down, potentially toward the 2% range in the coming months. This would naturally ease pressure on equities and crypto.
📉 Conclusion:
This recent spike in yields seems to be transitional, not structural.
The chart suggests that the top is in, and the market is correcting from an overextended zone.
The Fed might not even need to intervene—the bond market is likely to correct on its own.
Stay calm. Stay rational. Always zoom out.
#10YearYield #BondMarket #MacroAnalysis #InterestRates #RecessionWatch #MarketPanic #MACD #TechnicalAnalysis #FederalReserve #CryptoMarkets #StockMarketInsights #StayCalmZoomOut #DYOR
THE KOG REPORT - FOMCTHE KOG REPORT – FOMC
This is our view for FOMC, please do your own research and analysis to make an informed decision on the markets. It is not recommended you try to trade the event if you have less than 6 months trading experience and have a trusted risk strategy in place. The markets are extremely volatile, and these events can cause aggressive swings in price.
While gold is relatively new to this range we have to entail some caution if we’re even going to consider trading this FOMC. Markets are a little fragile, we’re at ATH’s and the moves are extremely aggressive. So, we’ll highlight the red box levels and the potential move we’ll be looking for, sticking to the extreme and key levels, ignoring the intermediate levels.
Looking at the chart we have a support region below 3010-15 which if spiked into and held can push this back up this time to break above 3030 and attempt to attack that 3050 region. That in our opinion would be the first point to start looking for price to exhaust, but it will only give us the flip so longer scalps are likely to be all we’ll get.
If we break above the 3055 region we’re likely to go higher giving us a red box resistance level of 3065-75. It’s this level we would ideally like to target from a lot lower down if we can get that entry. For that reason, we have given the level below on the break of 3010 sitting around 2990-80, we’ll have to wait and see, but if we can get down there a nice swing could present itself.
RED BOX INDICATOR:
Break above 3030 for 3050, 3055, 3063 and 3070 in extension of the move
Break below 3020 for 3912, 3006, 2996 and 2990 in extension of the move
Please do support us by hitting the like button, leaving a comment, and giving us a follow. We’ve been doing this for a long time now providing traders with in-depth free analysis on Gold, so your likes and comments are very much appreciated.
As always, trade safe.
KOG

Ultimate summary of Powell’s comments today As expected, Powell reiterated that the Fed is in no rush to adjust rates, and the labour market is stable.
He also reaffirmed the Fed’s reliance on hard data over sentiment and the approach of slowing balance sheet reduction.
What’s different this time:
Inflation & tariffs: Powell acknowledged that recent inflation upticks may be tariff-driven, delaying progress toward price stability. The Fed’s base case assumes tariff inflation is temporary.
Economic sentiment: Consumer sentiment has weakened, partly due to Trump policy changes, and concerns over inflation are growing.
Recession risk: Forecasts now lean toward weaker growth and higher inflation, with recession risks slightly elevated but still not high.

Rate Cuts Are NOT BullishRate cuts in the US have never been bullish for equity markets in macro cycles. The idea that rates coming down from 5% to 4% suddenly making people more creditworthy is a farce because rates never move in anything other than large timeframe tides. These tides reflect growth/inflation expectations, not borrowing costs.
Were Jerome Powell to suddenly become very dovish at the next FOMC meeting it would be a clear signal that the SHTF protocol is in full effect. Powell is more likely to talk away the negative GDP prints as demand shocks due to tariffs/trade deficit imbalances while waiting for more data to make a decision. Labor market has been declining as well but he doesn't want to make a panic decision and also probably feels no personal loyalty to help President Trump out.
Historical average for US inflation is about 3.2% with the 2% target meaning deflation is a possible problem incoming. Current US inflation rate is about 3% which is well inline with the historical average. Powell will never say it but so far his mission has been accomplished. He may cut rates at the back end of the year if necessary but as of this post he has no reason to.

UK GDP beats forecast, gives sterling a liftThe British pound has edged higher on Thursday. GBP/USD is trading at 1.2460, up 0.15% on the day.
The UK economy ended 2024 on a high note, as GDP rose 0.4% m/m in December. This was the fastest pace of growth in nine months and blew past the market estimate of 01.%. The surprise gain was driven by increases in services and manufacturing activity. Annually, the economy expanded 1.5% in December, its best showing since Oct. 2022. This followed a revised 1.1% gain in November and beat the market estimate of 1%.
The surprise to the upside in GDP is welcome news but is tempered by the fact that much of the growth may have been due to government spending, as business investment decreased in the fourth quarter and consumer spending was flat. GDP quarterly growth was only 0.1%, an indication that the UK economy is still weak.
Fed Chair Jerome Powell testified before the House Financial Services Committee on Wednesday, just after the release of January's hot inflation report. Headline and core CPI were both higher than expected, with headline inflation accelerating for a fourth consecutive month. Powell told lawmakers that the Fed had made "great progress" on inflation, but acknowledged there was more work to do. Powell said that the Fed doesn't "get excited about one or two bad readings" but there are concerns that inflation could be moving in the wrong direction, away from the Fed's 2% target.
The Fed's battle with inflation has also become more complicated with President Donald Trump's promise to impose tariffs on US trading partners. Trump has called on the Fed to lower interest rates, raising fears that he is trying to dictate monetary policy to the Fed, which is suppose to act independent of political considerations.
GBP/USD tested resistance at 1.2493 earlier. Above, there is support at 1.2541
1.2435 and 1.2387 are the next support levels
