POWR Ascending Broadening Wedge Giving Us A Few Trading Options!Ok today we will have a look at POWR vs BTC on the daily log chart!
As you can see on the 10th of April we finally broke out of the downtrend channel we have been in since early January. Since then we have trending higher in an ascending broadening wedge pattern. It’s worth noting that ascending broadening wedges tend to breakout in the direction of the previous price trend; acting as continuations of this move – so in this instance it would result in a move lower. Generally if a downside break occurs, these patterns are very trustworthy, however they are less reliable prior to the break of the lower trend-line. It is also important to note that ascending broadening wedges can extend for long periods of time, and there is no easy way to predict when or how the pattern will end.
Now in saying this I am not necessarily convinced we will actually break to the downside of this (pattern despite a commonly accepted notion of a 76% chance that the formation will break out downward). This is because the MACD is trending above the signal line and we have a bit of momentum building to the upside. Aroon Up is trending high above 50, whilst Aroon Down is well below 50 – indicating bulls have the edge. We have also tested the 12 EMA as support after the bullish cross over of the 26 EMA occurred on the 13th of April. The RSI is not overbought at the moment, and is starting to trend downwards providing us with further room for growth.
In addition we have a three outside up candlestick pattern emerging (not yet fully formed) on the half hour chart, and a bullish engulfing pattern emerging (again not yet fully formed) on the one hour chart. Both bullish signals indicating a move further up the pattern. So in summary, technical indicators are giving us a strong buy signal on the daily.
So how do we trade this pattern? Well we have a few options. First there is the bearish breakout strategy. This is the most basic and involves waiting for a breakout confirmation such as a breakthrough of the lower support line. This means sell once the lower support area is breached. But this is the least effective of all the strategies. Probably because it’s the one everyone is using.
Secondly we have the bullish continuation strategy. This means we go long as the price breaks above the upper resistance line of the wedge. This generally has the best odds of success as there is about a 55% probability of a further bullish advancement after a break of the upper resistance line. If this occurs the bullish move generally lasts at least as long as the duration of the pattern itself.
Lastly we have a swing trade strategy. As the ascending broadening wedge tends to extend indefinitely, it can also be traded as a price channel. In this case, you can use a swing strategy to trade off the highs and lows between the support and resistance area. Simply place a sell order when the price rebounds down from the upper resistance line and place a buy order when the price rebounds up from the lower support line. If you take this approach you do however need to pay special attention to breaks of the support/resistance areas.
Remember to always DYOR and trade safely!
Cheers
POWR

5+% Profit for POWROur indicators show that POWR will give at least 5+% profit..
Disclaimer: This is not a trade advice, every trade is at your own risk.

POWR/BTC [SHORT - MEDIUM] | BUY for %7+ PROFITOur indicators give buy signal!
Entrance : 0.00005673 - 0.00005730
Profit Points : 4% - 7% - More
Stoploss (Optional) : 5510
Stay tuned! Follow us for more signals.
Disclaimer: This is not a trade advice, every trade is at your own risk.

POWR/BTCLooks similar to other cryptos like Lumens, this one is testing monthly resistance level
Target 1 will be easy
Target 2 will get probably tested
Target 3 is optional


WPR/BTC Possible %50+ Gain |Here is what you need to knowDear All,
Lets look at the expectations and facts;
WePower (WPR) has a platform release in April. In addition they are actively working on networking through telegram bounty etc.
It entered binance recently and still did not see an exlosion!
The price is less than ICO price.
With the volume coming to crpytocurrency we can see one of the first bull runs with WPR...
Nothing really to work on technical sense, however the fibo levels corresponds to earlier ATH after the ICO release
Stay strong, stay tuned!
Cheers!

POWR - BUY SIGNALPOWR has completed accumulation and has broken out, forming a wedge on the 4H chart, looks to be testing the wedge resistance now and a breakout is possible. If we are rejected, we will bounce off the wedge support once more before breaking out.
POWR
Buy - 0.00004800-5250
Target 1: 0.00005700
Target 2: 0.00006100
Target 3: 0.00006600
Target 4: 0.00007900
Target 5: 0.00012000
Stop loss: 0.00004500

POWRBTC 20% + 60 + 100% +POWRBTC 20% + 60 + 100% +
Good day to all!
The market continues to please us.
We have a new opportunity to make a purchase at the right time and at a good price.
When entering the market, I advise you to have a clear trade plan that will protect your capital and help it to increase.
And as always, I advise you to remember about profit taking. After all, only the profit that you recorded can be called a true profit, the rest is only a mirage!
Good luck and good trading!

POWER LEDGERBullish pattern Moving in triangle. beak out resistance line
Power Ledger’s will present in the start-up section.
From the 17th — 19th April, EventHorizon will bring together pioneers, experts and visionaries of both the energy and blockchain sectors in Berlin.
The event serves the best interests of all sectors attending with deep dive sessions to broaden the horizon and start-up pitches to experience the latest breakthroughs.
eventhorizon2018.com

POWER LEDGE (POWR) on Binance - Bittrex in Uptrend - 120% - 170%This is a Low Risk trade if we use SL (STOP LOSS) at around 10%
Chart is self explanatory
Enjoy this trade Crypto Maniacs!
Invest only what you can afford to lose or you're going right back to poverty on drop. We are not your financial advisors.


$Powr Accumulation Phase Ends, New Targets Arise $Powr Accumulation Phase Ends, New Targets Arise :)


Breakout imminent on POWRAscending triangle with accumulation volume. Price had a nice Kijun bounce with the price currently trading above the Tenkan and Kijun and an expanding bullish Kumo cloud. MACD coiling in the positive zone. :)

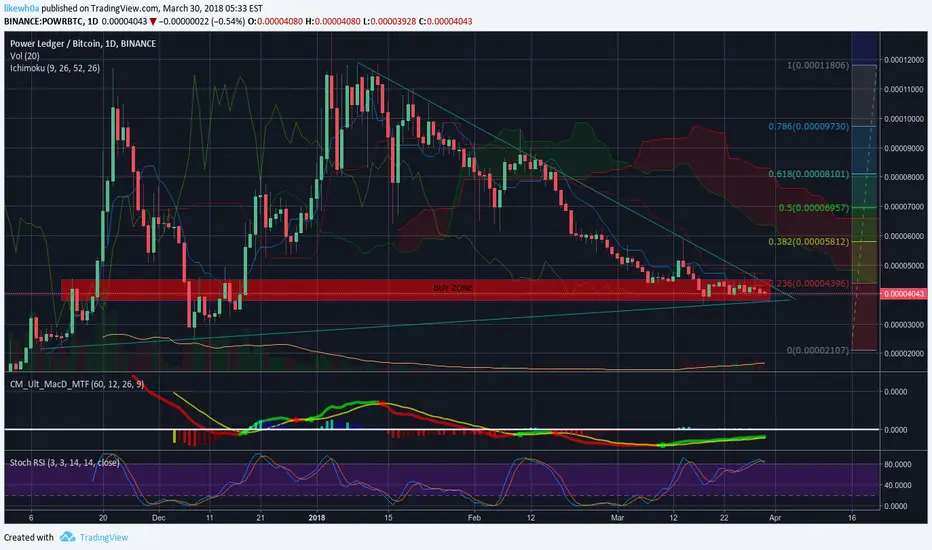
PowerLedger (POWR) Falling Wedge: 400% Profits PotentialI first traded PowerLedger (POWR) last year, it was a very nice, profitable and fun ride. After sharing this coin on December 12th, its price shot up massively and increased almost 5x. After an incredible bull run, great profits generated, POWR, like all other coins went on a retrace. A hard and long retrace which can be clearly seen on the daily chart above...
### PowerLedger (POWR) Trade Analysis by Alan Masters
SIGNALS AND INDICATORS
- "Falling wedge" pattern, which is a bullish formation.
- Orange circles, marks the bottom from early December. After this bottom was reached, a strong breakout happened and POWR went on a very strong bull run. Now, we've touched this bottom again and POWR has responded strong.
- We went almost on a full retrace from the last all time high and you can see the accumulation happening on the daily chart based on the positive divergence that can be seen on the MACD. Which is another very bullish signal.
- MACD and RSI are trending upwards. Trending up with plenty of room for growth.
- Low volume allows for more growth as well.
- These are just some basic signals, but they all look very positive.
- The weekly chart is very young but it also allows room for growth and it is calling for some positive action.
Now let's move to the details on how to trade this coin...
TRADE INSTRUCTIONS
Buy-in: 0.00004250 - 0.00005280
The above buy in is set for long term traders. It is useful with the long term targets that you will see below.
We set the bottom for PowerLedger (POWR) at 0.00003650 on 18th March, from which point we bounced and started to trend up. If we break below the above buy-in, you can wait again for the bottom to be re-tested and later buy in. You can also buy in and hold long, as we have already bounced strong from bottom and we are trending up.
PowerLedger (POWR) Targets:
LONG
(1) 0.00006143
(2) 0.00007683
(3) 0.00010173
(4) 0.00011953
(5) 0.00014213
(6) 0.00020743 (New All Time High)
MEDIUM
(1) 0.00005961
(2) 0.00007381
(3) 0.00008401
(4) 0.00009691
Use these prices above as reference to sell some of your coins for profit. We are likely to face resistance each time one of these price level is reached, which is followed by a retrace. You can sell at these prices and buy back lower, or simply sell to secure profits. You can get our "How To Sell The Targets" article for additional information on how to maximize profits when selling the targets.
Stop-loss: No stop loss is needed here since this is a long term trade. The long term potential of this coin is obvious, based on the chart signals and analysis mentioned.
You can use a stop loss of 0.000041 if you are a tight trader looking for short term. If the price breaks below this level, you can pull out expecting to buy back in lower. At this time, with the huge potential ahead, this is a good buy & hold.
Other trades are not going to be this detailed for every point, but I am sharing in order to remind ourselves the different options we have when trading these coins. But this is all pretty simple. Buy low to sell high. Buy and hold. Patience is the key.
### Message: We Keep On Growing - We Keep The Growth
As I grow, every single day...
I get the feeling of passion, other people with love and spirit, interacting with me in many ways.
As I keep on growing, which we all do; daily anyways, more challenges keep on coming, more lessons need to be learned.
So the challenge continues and live goes on. The appreciation of the experience is unique, each time it becomes better, more meaningful, stronger... as long as WE KEEP THE GROWTH!
Namaste.


POWR Looking GoodHello,
POWR (Powerledger), seems to be at the end of the consolidation period, after a good bullish 5 wave impulse, we are nearing the end of the decision triangle that has been forming for 3 months. I expect an up from here.TP1 = 0.00048, TP2 = 0.000526, TP3 = 0.00063; SL = 0.000364. Great R/R ratio, good fundamentals.
Please note that the timeframes I'm using are 4h and up, so trades can take some time. Good luck.

POWR (Power Ledger) Wait to get it.POWR is going wave 4. Prepare to wave 5, target sold at 100% of Fibonacci.
Wait to get it.
If you find our post useful, please give us a BIG LIKE Your support will be a great motivation for us to update chart every day! If you have any opinion about this chart, don’t hesitate to comment below! The discussion will make us better! Thank you, guys!


POWR is consolidating and looks like a breakout is nearLooking at trend lines it looks as if POWR should be making a move soon towards the 60k satoshi levels. I have added a buy order at 39k and will wait for this to drop as it has already dropped down to 39.1k so far.