sell power before 6900power to come back down after anticipated run up.
top is 6900 sell anytime before then and watch bitcoin bring it back down again.
POWRBTC
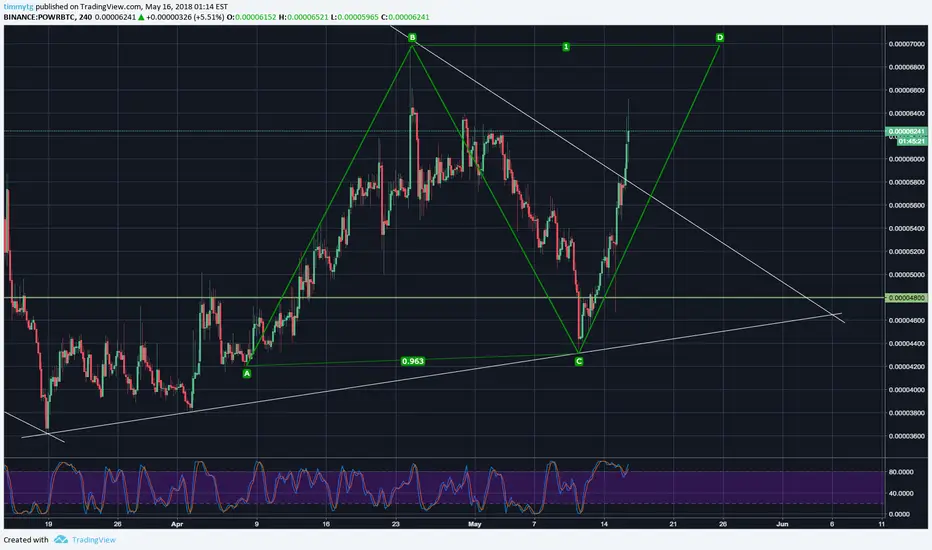
Gartley power all depends on bitcoin as always
just an idea if drops down to o 4800 would disregard this
would not enter until back up at 5400 and sell around 6100 to re-buy 4600


#POWR update: Bullish move from 4100 sats #crypto#POWR has broken out of the bullish falling wedge pattern
Bounce off 4100sats level
RSI & MACD are showing bullish Divergence
MACD bullish crossover of the signal line
We can expect a rally to 6400sats region.
Target1: 5000sats
Target2: 5600sats
Target3: 6300sats

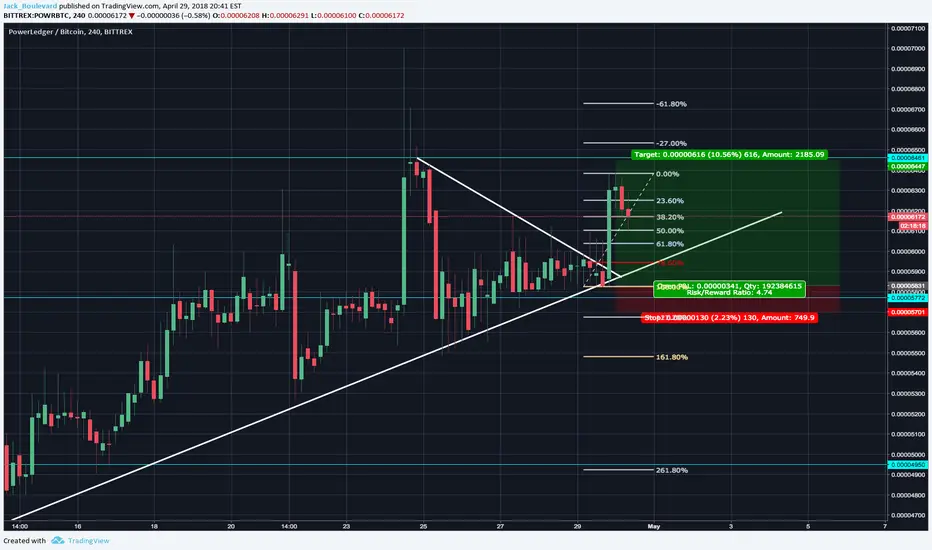
trend reversal imminent, possible %156 gain. I have just finished charting my Analysis on Power ledger (POWR/BTC)-Binance
Fundamentally I've been a big fan of this ambitious project since the ICO, I think they have a talented, diverse and methodical Development that have a clear and precise long term vision for Powers implementation. Its not very often you hear about their achievements, which is something I value, the Power team are quiet achievers focused on delivering and I'm positive they will deliver.
I have been waiting patiently to add to my investment portfolio since its last push on the 11/5/2018 and I believe we are nearing a good entry.
SUPPORT & RESISTANCE
On the 4 hour chart we've had a steady pull back of %29.31 from the 16/05 which saw a strong reaction to the long term ascending trend line indicated by the dashed line. This trend line spans all the way back to the 13/11/2017 and touches multiple time on the
08/12/17 - 18/03/18 - 02/04/18 - 24/05/18. this trend line alone has indicated a Bullish on 4 occasions now.
Price has also been respecting the 4 hour support line, this support line was resistance that was tested 5 times before breaking out for a %47.15 run on the 08/04/2018.
Possible formation of a Descending triangle which could play out as Bearish or bullish, but due to the Trend line, 4 hour support and %29.31 I am confident it will breakout Bullish. (indicated by the grey solid line closing on the trend line)
INDICATORS
-RSI, is looking bullish to me.
-MACD is looking like it wants to cross back under but given the respect to support i think it will curve up.
-Bollinger bands (Not shown) are restricting nicely indicating reduced volatility this is also confirmed by the reduced volume.
-We have the 50,100,200 Moving averages acting as resistance at the moment, so expect to see the price rejected at these points.
THE PLAY
play 1) wait for bullish breakout of (Descending triangle) wait for it to retest and hold the 4 hour resistance then buy and sell as per your trade plan.
play 2) wait for Bearish breakout of (Descending triangle) and look for buying opportunities closer to the Daily Resistance.
play 3) decide your happy with a %67 pull back from 04/01/2018 (All time high), buy in knowing the price could still dip further %10 from (all time Low) but add to your investment and potential %156 gain to retest (All time high)
I would love to hear your thoughts,
are you Bullish Or Bearish.
happy trading, Jarrah

$POWR , fuelling up?$POWR fuelling up for a sufficient time.
have taken a bullish divergence on the daily but bearish in the 4H which means a temporary dip around the corner.
The next ATH should be the Green margins,
Scalpers/Day traders should exit at the yellow margins.
it's a holder's heaven,
Good Luck!

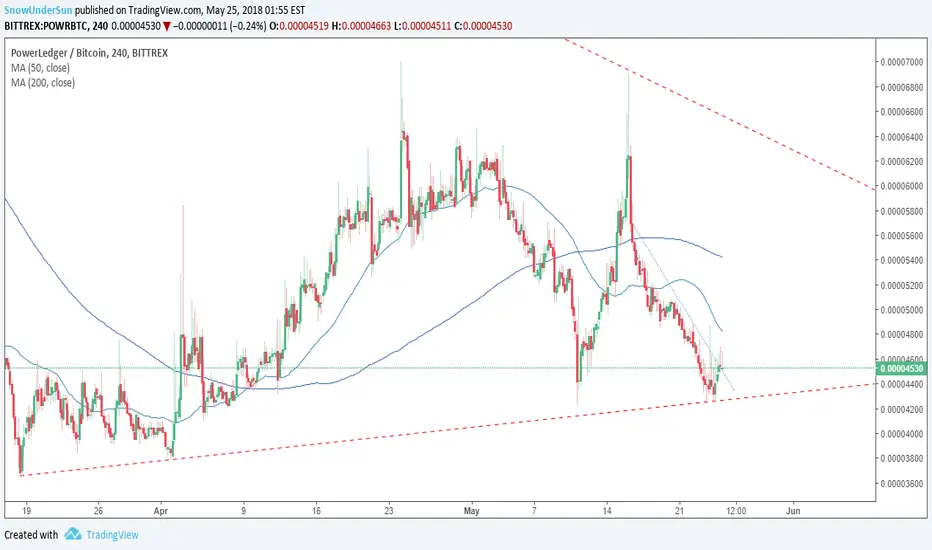
POWRBTC Bittrex 1D up to 26MAY18 Crypto Trading Analysis (TA)BITTREX:POWRBTC
1D Chart, also works in 4H, at this time PowerLedger (POWR) is testing by third time the SUPPORT ZONE since April 7 (0.00004273 BTC), gaining strength to move towards RESISTANCE ZONE 1 (TARGET 1 0.00005927 BTC). The 50, 100, 200 MA already crossed up its 100/200 days signals (GREEN ARROW), the Volume is decreasing -BUY SIGNAL-, and the Stochastic RSI Index & MACD and are both about to pierce up below 20 RSI Signal and Histogram respectively (BLUE ARROWS), we could spect the POWR price to move UPwards in the next hours. But remember, this is our optimistic approach, keep in mind that is plenty of possibilities to witness a reverse from any point at any time. At this time the Market Cap is recovering at 338 Billions and the BTC is traying to get oxigen at $7.5K. Good Luck!
Grafico de 1D, también funciona en 4H, en este momento PowerLedger (POWR) está probando por tercera vez la SUPPORT ZONE desde el 7 de abril (0.00004273 BTC), ganando fuerza para moverse hacia RESISTANCE ZONE 1 (TARGET 1 0.00005927 BTC). El Indicador 50, 100, 200 MA ya cruzo sus señales de 100/200 días (GREEN ARROW), el volumen está disminuyendo -BUY SIGNAL-, y el índice estocástico RSI y el MACD ambos están a punto de cruzar sus señales por debajo de 20 RSI Signal y el Histograma respectivamente (FLECHAS AZULES), podríamos observar el precio de POWR moverse hacia ARRIBA en las próximas horas. Pero recuerde, este es nuestro enfoque optimista, tenga en cuenta que hay muchas posibilidades de presenciar un retroceso desde cualquier punto en cualquier momento. En este momento, el Market Cap se está recuperando en 338 Billones y el BTC está tratando de obtener oxígeno en $7.5K. ¡Buena suerte!
"Bitcoin will do to Banks what Email did to Postal Industry / El Bitcoin le hara a los Bancos lo mismo que el Correo Electronico hizo a la Industria Postal"
REMEMBER: I am not a financial adviser nor is any content in this article presented as financial advice. The information provided in this blog post and any other posts that I make and any accompanying material is for informational purposes only. It should not be considered financial or investment advice of any kind. One should consult with a financial or investment professional to determine what may be best for your individual needs. RECUERDE: No soy un asesor financiero y el contenido de este artículo no se presenta como asesoramiento financiero. La información provista en esta publicación de blog y cualquier otra publicación que haga y cualquier material que la acompañe es solo para fines informativos. No debe considerarse asesoramiento financiero o de inversión de ningún tipo. Se debe consultar con un profesional financiero o de inversiones para determinar qué es lo mejor para sus necesidades individuales.

POWRBTC - getting squeezed on trendlinePOWR token getting squeezed within trend line .. hoping some action soon. As always, tried to make my chart easy to understand. Use Fibonacci levels for support and resistance. Ladder your profit with Fibonacci levels. RSI moving upward and bounces from trend line. It might bounce down to trend or fib support level before moving up.
Please hit "LIKE" to support.
PS: my trades aren't for day traders, however, they sometimes hit target sooner than expected.
Good luck
Vinny

Trade Recommendation: POWRBTCSignal for BINANCE: POWRBTC
New trading opportunity here:
Buy @ 0.00005148
Stop Loss @ 0.00004414 (-14.2%)
Take Profit @ 0.00006354 (23.4%)
Risk on the trade is 1%. Please let me know if anyone needs an explanation on how to calculate risk per trade using 3commas service.
To place take profit (TP), stop loss (SL) and Trailing I use 3commas services. Register and get 10$ on your trading account.


POWR is on!Power Ledger looks ready to break out of cup and handle formation.
Today's Bithumb listing will certainly help.
There should be some resistance from algorithms selling the 50% and 61.8% fibonacci levels on the way up so there is potential for scalps on shorter time frames.
50% profit target is for those with stronger hands :)

POWER LEDGER LONG TERM Potential 5$Power Ledger is the world leading peer-to-peer marketplace for renewable energy.
ROADMAP
Q3/2018
FIRST ASSET GERMINATION EVENT
Power Ledger and Platform Application Hosts will begin conducting Asset Germination Events, where POWR token holders will receive priority to become coowners and beneficiaries of renewable assets.
MARKETING AND PARTNERSHIPS
As new Applications are developed potential Application Hosts will be targeted and/or Power Ledger may directly deploy the Application.
AND WHITE PAPER => powerledger.io

Possible C&H on POWR?We can spot possible C&H pattern on $POWR/ETH chart. Likely price target is matching very nicely with the resistance level. Let's see what happens in few days ahead!
BITTREX:POWRETH


Power Ledger POWR POWRBTCAlike other alts, I see more upward movement to go soon before major correction.

POWR - Trying It's Best to Break Out Above Heavy Resistance!!OK so after a short break spending some quality time with the wife and the little one (as well as working on my motorbike at nights) – I am back!
Let’s have a look at POWR vs BTC on the one hour log chart to see what we find!
POWR finally broke out of its three month down trend channel (dashed black line) around the 11th of April and has since been trading within a smaller ascending (uptrend) channel. At the moment we find ourselves at a critical point in our journey! As you can see we have some strong resistance above us in the red dashed line and although we have tried and tried to break to the upside of it over the past week; we have ultimately failed! Unless we break out by today's close with supporting volume, then we are likely going down. How far down? Well let’s take a look at our moving averages to see if they can give us a possible scenario…
We had a recent bullish crossover of the short term moving average (12 EMA) over the longer term moving average (26 EMA) on 14/04/2018; and since then we have been riding the support offered by the 12 EMA. Now with the heavy resistance looming directly above us, the support is barely holding. If we don’t break out by today’s close, then it is likely we will fall to test the support provided by the 26 EMA in Pink. If this doesn’t hold, then we next have the 50 EMA represented by the green dashed support line. Therefore, in terms of where we will drop to; I think the green dashed line is as far as it will go. Let’s take a look at our other technical indicators to see if they support this theory.
Aroon Up is below 50, whereas Aroon Down is around 7. At the moment this indicates that neither bulls nor bears have the edge – this can still go either way! If the Aroon Down is to increase above 50 and Aroon Up remains below 50, then bears definitely have the edge. Given neither bulls nor bears currently have an edge, then there would not be a lot of strength to the drop below the uptrend channel if this occurs. On the flip side however, if we do break out above the heavy resistance and we do not have the supporting volume required; then again we there will not be a lot of strength to the break out, and we will probably not find support above the red dashed resistance line (effectively this will be a false breakout).
RSI is at 58 and the MACD also have no momentum currently, further supporting the view that a drop at this stage is likely to take us to the next level of support at the 26 EMA; whereas a breakout above the resistance will be a false break out. Like I mentioned earlier however, if we do drop and both the 26 EMA fails and then the 50 EMA green dashed line also fails - then we are dropping further!
Volume gives me a positive indication that all the buyers over the last week are not going to want to sell so soon. A drop out of the uptrend channel is not going to scare them enough in to selling, although it may shake out a few loose hands. This again, supports the notion of a drop only as far as the 26 EMA or green dashed support line representing the 50 EMA before a bounce.
At the moment, this is a no trade zone for me. In order for me to go long, I would need to see a break above the red heavy resistance dashed line (with the all-important supporting volume!) which would likely take us all the way up to the 61.8% Fib where we are met with our next level of resistance. I will be looking for this break and once confirmed, going long.
Cheers

POWRBTCSo far looking good. Expect a little sideways action for a while before next leg up.
At high density nodes. Once breaks past looking good.
See previous posts of mine for active trade.


POWRBTC Long PlayConsolidating currently. Squeeze firing for a long.
Look for next leg up.
Consider taking some profit at pink line as that is resistance above. Break that and look for next fib as target.

POWER TO THE PEOPLE!We can do it! Believe! Power up!
White lines are profit targets, red is stop-loss.
