DXY I Still have the DXY in the expanded Flat with a top in at $107 which happens to be the fib retracement 50% level of the 5 down wave A.
I expect the momentum indicators to begin to slowly roll over. RSI, Stochastic RSI , OBV , MACD should all confirm the last leg of the down trend wave C which I expect to finish around $94.
At $94 the DXY should complete a very HTF wave 4 and then kick off what is shaping up to be one ugly recession. W5 targets for DXY run over $130 and I don't think much will survive this risk off trade set up.
This is likely what many analysts are referring to as the "Blow off Top" to which I find myself reluctantly agreeing with since all my charts keep leading me down this rabbit hole. ;)
Preciousmetals

Gold ended the week with a slight increaseGood day to all traders. Today, we will delve into the current state of the market. Analyzing the 1-day chart, it becomes evident that gold is currently experiencing a significant downward trend and is being traded at a value of $1871. Although there may be minor fluctuations in the short term, overall, sellers are persistently contributing to the likelihood of gold's continued decline in the foreseeable future.

Gold is still falling freely, possibly down to 1,800 USD/ounceGold prices experienced a further decline during the recent closing session, currently trading at $1848 USD. This can be attributed to the Federal Reserve's persistent hawkish stance, which continues to suppress the upward trajectory of precious metals in the market. Although US bond yields have decreased slightly, they still remain relatively high at 4.55%. Additionally, the US Dollar Index has risen above 106 points, exerting additional downward pressure on gold.
The prospect of higher interest rates poses a risk for gold prices, potentially driving them down to $1,800 per ounce. However, it is worth considering that there may be an increase in demand for gold if labor conflicts persist and inflation continues to impact the US economy leading to a government shutdown.

Gold for the price increase, the most new analysisGreetings, valued traders! As predicted, the price of gold is experiencing significant growth and has currently reached a level of 1832 USD. This marks the highest increase seen in the past week.
After breaking away from its downward trend, the value of gold is on an upward trajectory. Additionally, due to three consecutive declines in the value of the dollar, support for purchasing gold remains strong. It is anticipated that prices may rebound to around 1,834 USD and potentially even reach 1,853 USD. This positive trend will persist until negative news pertaining to this currency pair emerges and dampens investor sentiment.

Gold extends gains to $1880?Hello dear readers! It's a pleasure to engage in this first conversation with all of you! Just as predicted in the previous weekend session, Gold opened at 1,849 USD/ounce, experiencing a significant increase of 16 USD/ounce compared to the previous week.
The buying demand for gold when prices dropped to their lowest level in 7 months has helped the precious metal recover. Despite the US Dollar index maintaining its high level around 106 points on the international market, gold prices continued to rise.
Due to buyers' interest in pushing up gold prices, Gold is currently trading at 1,851 USD with a projected increase reaching 1,880 USD from its opening price of today's session.

Update the latest gold prices. Long-term analysisHello everyone, Alselv here. Today, Gold continues to maintain its upward trend. It is currently trading at $1863, a 0.12% increase for the day. This stable rise aligns with the predictions made yesterday.
The bloody conflict in the Middle East over the past weekend led to Israeli Prime Minister Benjamin Netanyahu declaring that the country is at war following a major attack by the Hamas group from Palestine. This situation has fueled risk aversion and increased demand for safe-haven assets like precious metals, which has pushed up the price of gold today. The closure of the US and Canadian markets for Columbus Day has not impacted the price of gold as the USD strengthens.
Due to these factors, gold buyers continue to push the price higher, and gold is currently at $1864, with an expected increase to $1928. This upward trend will persist until any significant developments occur.
If you find this article interesting, please like and follow to stay updated with the latest information.

Comments on XAUUSD for the new weekNice to meet you all again! Today, Gold shows clear signs of recovery as the price reaches a high of $1851 with little change from this morning.
On the 4-hour timeframe, Gold appears to be cooling down as it seems uncertain about the prospects of further price increase. But don't worry, the possibility of Gold surpassing this level is only a matter of time, as the USD has reached its peak and is likely to retreat, thus supporting this precious metal.
This week, there is news about the USD on Wednesday and Thursday, so it is possible that after Gold rises to the indicated level, there will be another pullback before the direction of Gold becomes clear.

What is gold showing?Hello smart traders!
Today, on the 1-hour time frame, gold has formed a price gap at a high of $1842 during today's trading session. Gold has coincidentally broken down below, leading to a decrease in the Dow. Overall, gold may retest a support level and continue its upward trend.
Gold has been oversold from a technical standpoint and seems to be stabilizing around the $1820/ounce level. The US dollar and silver bond yields appear to be pausing after a strong rally. This could potentially be the driving force to continue pushing gold higher.
If you find this article helpful, please leave a like and follow to receive new updates.

Gold updates and analysis todayGreetings everyone!
At present, gold appears to be exhibiting less volatility as it is primarily focused on moving in a sideways direction, with its current trading value standing at 1826 USD per ounce. While the global gold market this morning neared yesterday's price level, it has experienced a notable decline in comparison to its previous surge. According to the latest report, there has been a notable increase in buying pressure within the gold market. The recent data indicates that the US labor market is displaying signs of slowing down, with last month's creation of private sector jobs falling significantly short of expectations.
Traders are presently eagerly anticipating the release of the September jobs report from the US Department of Labor on Friday. It is anticipated that this will bring positive news for gold.

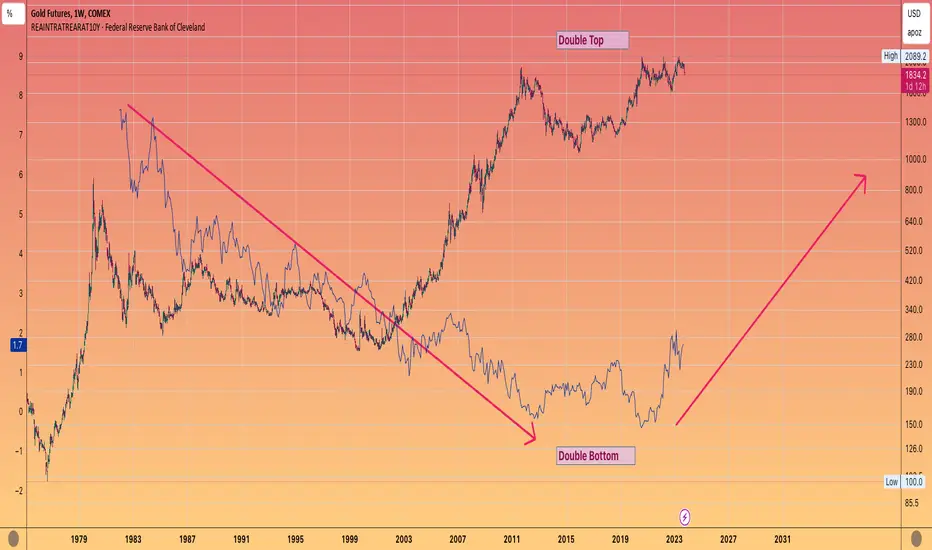
GOLD - Positive real rates is negative for GoldThe attractiveness of Gold is tarnished
When cash instruments yield a positive rate of return
More and more people are getting on board of higher interest rates
(Dimon, Santelli)
But u can see the Gold price has been inversely correlating with the rate of return for decades.
It's bull run in the 2000's along with the commodity bull , coincided with real rates trending to less than zero. Gold Topped a few months prior to that negative reading in 2012!
The current triple top that has been in place for he past 3 years , seems to be in danger of breaking down if rates continue up the next few years.
The key level to watch is last year's lows in October around $1611
Which I believe is a distinct reality if rates head up to 7%
Careful analysis of gold today (October 4)Hi everybody!
The price of gold today has dropped to its lowest level in 7 months as the US dollar and bond yields rise, fueled by strong US economic data that creates expectations of tighter monetary policy.
Currently, Gold is trading at $1822, the lowest since March, with no immediate signs of a rebound as DXY continues to strengthen in recent times.

Analysis of Gold tonightHello everyone! The price of gold today is following the main trend, currently trading at $1,822 per ounce, a decrease of $25 per ounce compared to earlier this morning due to the US dollar reaching its highest level in 10 months and the yield on US Treasury bonds rising to its highest level in 16 years.
Looking at the technical picture on the H4 time frame, we can see that the main trend is still downward, but currently the price decline seems to have cooled off as Gold has experienced a slight increase to $1,826. This indicates a minor correction at this moment. However, don't worry as the overall market sentiment still supports Gold's downward trend. Therefore, it is possible for Gold to drop to $1,800 tonight.

Gold's fluctuations are unclear todayHello everyone. The price of gold today remains at a low level of 1821 USD, with not much change compared to yesterday. The market seems to be showing its calmness, as the US dollar is still strong and followed by the yields on US bonds, which are showing disadvantages for gold.
According to my analysis, gold is likely to trade within a narrow range around the 1835 USD - 1816 USD zone.

USD increased sharply, causing Gold to plummetHello everyone! Today we continue with the ongoing streak of gold price reductions, currently trading at $1818 with signs of approaching the $1800 price range.
The increase in US bond yields and the strengthening of the USD continue to pose a threat and exert pressure on precious metals. Faced with pressure from the USD and US bonds, this precious metal market is facing disadvantages, leading investors to limit their holdings. The downward movement in global gold prices today is inevitable.

Latest Gold update today (October 2)In late September, the global price of gold dropped to over 1,866 USD per ounce, marking a decrease of almost 100 USD or a loss of more than 5% in just one month. This decline stands as the second largest monthly drop witnessed this year.
The primary reason for this may be attributed to the current monetary policy implemented by the US Federal Reserve (Fed), which has set its reference interest rate at 5.25-5.5%, the highest it has been since 2001. Additionally, high inflation rates and a stronger US dollar compared to previous months have contributed to the decrease in gold prices.
This week will see several significant reports regarding production and services from both the United States and European Union being published. James Stanley, senior market strategist at Forex.com, predicts that gold prices could experience a sharp decline during the first week of October due to these reports. He believes that there is no immediate evidence suggesting any fluctuations in exchange rates or selling sentiment; however, he expects that further dismantling will cease following recent substantial drops in gold prices.

Gold plunged influenced by higher inflationHello everyone!
The current trend for gold prices is downward, as it has slipped below the important psychological support level of $1,900 per ounce in the early morning trading session. It is currently trading at $1,874 per ounce. Additionally, the hawkish stance of the Federal Reserve continues to push up bond yields and the US dollar, suppressing the upward momentum of metal markets.
Higher inflation rates have resulted in higher interest rates, causing a significant decline in gold. It is expected that gold will slide further to $1,840 per ounce if market conditions continue on this trend.

World gold reduces shock, what should be noted?Hello everyone.
The price of gold on the international market has decreased by an additional 15 USD today, dropping from 1,875 USD/ounce to 1,865 USD/ounce due to the high value of this currency, with the USD Index remaining steady at 106.6 points.
On the other hand, financial investors are focusing their capital on bonds and stocks, resulting in a minimal flow of money into precious metals. As a result, the world's gold price is forced to decline.
In my personal opinion, gold will experience a slight adjustment today and then consider it as a resistance level that continues to push down the price of gold into a deep dip.

Gold promises to drop to the 1800 USD markHello everyone!
The price of gold at the beginning of the week is still declining and is currently trading at $1843 per ounce, a decrease of $5.2 compared to the previous session. This decline can be attributed to negative market influences, such as the continuous rise in the US dollar index, which has now surpassed 106 points. Additionally, the yield on US bonds continues to increase, causing global markets to be concerned about rising inflation. Despite supportive economic data, these current circumstances make it difficult for gold to reverse its downward trend.
It is expected that gold will experience slight profitability this week ahead of the release of non-farm payroll reports for September, scheduled for Friday morning.

Silver Breaking down: Symmetrical TriangleSilver (US$/Oz) Breaking drown from a long term support trendline (22.197 levels).
Crucial support levels to look for : 21.376, 20.7-20.52 and worst case 19.945. Although if macro factors support we can see a demand uprise and a subsequent pull back to 21.376 and rally upto previous long term trendline levels.

Gold Break Down : Hitting 7 Month Low. Crucial Support zoneGOLD(US$/Oz) stands at a 7 month low ever since March 2023. The precious metals commodity is standing at a crucial support levels of the channel ever since April 2023.
Although the charts shows momentum bottoming but the supply constraints and Macro factors may pull it down to levels of 1833,1806 post which we can see it pulling back to channel Trendlines again. The worst case scenario is still open for 1784 but for now that looks a less probabilistic from technical point of view.

Gold - breaks support to continue going downHello everyone!
The price of gold continues to decline, currently trading at a low of $1900.
Gold prices have decreased and are not finding support at $1905. It would not be surprising if gold continues to test lower levels with the possibility of rising from a new support level. $1890 is a significant number with strong support and the potential for a price recovery from this level.

Silver: Breaking six Weeks lowSilver breaking its last 6 weeks low.
commodity broke down from its symmetrical triangle.
A pull back can be expected from 67441 levels but not to an extent to reach to triangle trendline levels
Key levels to watch :
Supports: 67441, 65222, 63453. Resistance: 72109, 74741.

Gold prices plummeted before the recovery of the USDThe current price of gold in the international market is hovering around $1,897.9 per ounce, which is a decrease of $3 per ounce compared to this morning.
The recent monetary policy meeting of the Federal Reserve (Fed) indicates that their stance will continue to be a catalyst for pushing bond yields and the US dollar higher, putting significant pressure on precious metals and acting as the main factor influencing gold prices.
Analyzing the 4-hour chart, Gold has declined without finding support at the $1900 level. It would not be surprising if gold continues to test lower levels below $1888 as it is a strong support level that suggests potential price recovery from this point.
