GOLD Next Support! Sell!
Hello,Traders!
GOLD is going down now
But a strong support level
Of 1929$ is now ahead so
I think that after the retest
We will see a move up
Buy!
Like, comment and subscribe to help us grow!
Check out other forecasts below too!
Preciousmetals

XAUUSD - KOG REPORT - FOMCFOMC – KOG Report:
This is our view for FOMC today, please do your own research and analysis to make an informed decision on the markets. It is not recommended you try to trade the event if you have less than 6 months trading experience and have a trusted risk strategy in place. The markets are extremely volatile, and these events can cause aggressive swings in price.
On Sunday’s KOG Report we said the report would only be applicable for the first half of the week due to FOMC today. We did well with this so will stick with some of the levels from the report for today. We’re going to keep this FOMC Report short this time as we’re not likely to be trading again until tomorrow. For those who are keen to get involved, we’ve highlighted the key levels to look for a reaction in price. The daily is showing a potential swing where a bullish move here can take it up towards testing the 2000 level and slightly above. For that reason, we’ve given the level on the break up towards 2005-8 with the initial hurdle being the 1980-85 level.
On the flip, 1975-80 is another level to keep an eye on. We’re not publishing the daily bias today, but this was yesterdays bearish below level with a rejection around here potentially leading to price first attacking the 1945 region and below the 1930-35 order region which was our initial target for the short trades.
Illustrated on the chart is the potential path, obviously with the swings, spikes and volatility expected please take it as a guide. We’ll only be looking for extreme levels in Camelot and that, as we said above is probably going to be in the sessions ahead.
If you’re new to trading, the trade will come after the event. Please try not to get involved in the pre-event price action, it’s going to chop you in the range before they make the move. Best practice is to come back to the markets tomorrow and look for a clean set up.
Please do support us by hitting the like button, leaving a comment, and giving us a follow. We’ve been doing this for a long time now providing traders with in-depth free analysis on Gold, so your likes and comments are very much appreciated.
As always, trade safe.
KOG

GOLD - PVVM Scores Confirm Bullish Trend!Analysis:
It appears that the Macro PVVM score for GOLD has been gradually increasing, moving from -106.27 (10/07) to 29.52 (27/07). This suggests that the long-term trend for GOLD is increasingly bullish.
The Micro PVVM score has been displaying a similar trend, generally increasing from -4.8 to 54.76 over the same period, indicating that the short-term momentum is also bullish.
The closing price of gold has been following an upward trend aligning with the increasing PVVM scores. This is an indication of the positive correlation between the PVVM scores and the closing price.
Key Takeaways:
The upward trend in Macro and Micro PVVM scores suggests that the bullish momentum for gold is strong, both in the short-term and long-term.
Traders should consider long positions. Entry points could be found during temporary pullbacks in the Micro PVVM, provided the Macro PVVM remains positive or stable.
Watch Points:
1. Be cautious of divergence between price and PVVM indicators. If the price starts decreasing while the PVVM scores remain high, it could indicate a bearish reversal.
4. If the Micro PVVM begins to decrease while the Macro PVVM remains high, it may be an indication of short-term bearish movement in a generally bullish market, signaling a potentially favorable entry point for long positions.

GOLD Bearish Breakout! Sell!
Hello,Traders!
GOLD was trading in a
Rising channel but now
After the retest of the
Resistance at 1990$
We are seeing a breakout
From the channel which
Makes us bearish biased
And I think that we will see
Some bearish continuation
Sell!
Like, comment and subscribe to help us grow!
Check out other forecasts below too!

#Gold Longer-termAs the short-term picture becomes clearer, I'm revising the view for the next six months (first published on May 27).
The image below is based on the assumption of a larger rising wedge, which is dictated by the complexity of the moves observed since 2019, and specifically by what occurred in 2022-2023, which appears to be subwaves of WXY (double zigzags), which usually form 12345 waves of expanding or contracting diagonals.
I will reiterate that while the multi-year trend is up, I still see the next 6-8 months as extremely challenging for stocks, energy and precious metals.

#Gold Update #XAUUSDMy take is that the price is moving within the scenario outlined a week ago. This week I watch the market to complete the structure before engaging in any trades or considering alternatives.

Gold -> Clear Path Ahead!Hello Traders and Investors ,
my name is Philip and today I will provide a free and educational multi-timeframe technical analysis of Gold 💪
Gold retested the monthly 0.382 fibonacci retracement level of the last major monthly impulse and is now in confluence with bullish moving averages heading for new all time highs.
The parallel channel on the weekly timeframe is still quite nicely pushing the price of Gold higher so I am waiting for any pullback to enter more buys on Gold.
With Gold retesting previous daily structure and rejecting towards the downside my last analysis perfeclty played out - I am now just waiting for a retest of the $1935 structure and then I do expect a bullish trend resumption from there.
Keep in mind: Don't get caught up in short term moves and always look at the long term picture; building wealth is a marathon and not a quick sprint 📈
Thank you for watching and I will see you tomorrow!
My previous analysis of this asset:

#Silver Update #XAGUSD Continuing with my prior study, I made a small tweak to the time and form. Gold seems to be forming the same pattern.

#Silver UpdateSilver outperformed my outlook and its peer gold by any measure. And at this point, it should turn lower to shape an ending diagonal as there are no other alternatives left (at least I struggle to find one) other than recycling the bigger picture.

#Gold UpdateIn the chart above, I highlighted the preferred scenario now in Gold and Silver - flat. Since wave is a clear double zigzag and because Silver invalidated a symmetrical triangle, I would discount the probability of such a triangle in Gold as well. That leaves me with ABC flat, or the whole thing is something else.
However, even one scenario with ABC flat may have a great degree of uncertainty as wave C can take the shape of an ending diagonal as indicated below, or an impulse with wave w relabeled as wave (1) - less likely considering complex structures on minute timeframes. It can also be an expanded diagonal which is always a nightmare for ElliottWave traders.

💰 Exploring the Potential of Investing in Precious Metals.Throughout the ages, the allure of rare and captivating metals like gold, silver, platinum, and palladium has remained unwavering. Their scarcity, exquisite aesthetics, and enduring nature have made them objects of desire. While these metals are commonly associated with ornamental jewelry, their utility extends far beyond adornment, finding applications in various industrial and technological realms. Moreover, precious metals have long been regarded as a safeguard against inflation and a sanctuary for investors amidst economic upheaval. Consequently, the trading of these invaluable commodities has evolved into a pivotal component of the global financial landscape, witnessing the exchange of billions of dollars each passing day. In this exposition, we embark upon an exploration of the fundamentals of precious metals trading: the mechanisms at play, the influential factors shaping prices, and the diverse avenues through which investors can partake in this exhilarating and ever-evolving marketplace.
The vast realm of metals is neatly divided into two distinct groups: ferrous and nonferrous. The former encompasses iron, manganese, and chromium, although experts occasionally question the inclusion of the latter metal. This classification extends to alloys containing elements from these primary ferrous metals.
Understanding Precious Metals
From an official statistical perspective, ferrous metals command an overwhelming share, reaching up to 90%. One would naturally assume that such metals enjoy significant demand on stock exchanges. However, in reality, a majority of transactions occur outside the realm of these exchanges, transpiring directly between buyers and sellers. Consequently, the ferrous metals market and its liquidity do not boast the most favorable conditions.
Within this category, certain metals hold a prominent position in exchange trading, namely: gold, silver, platinum, palladium, copper, aluminum, zinc, and nickel. Amongst these, gold and silver reign as the favored choices among traders and investors.
To comprehend the market of precious metals in its entirety, it is imperative to examine it through two essential lenses: the functional aspect and the institutional perspective. Ultimately, the market represents a harmonious amalgamation of diverse spheres, encompassing not only extraction, production, and processing but also the final sale to consumers.
The price of precious metals is subject to the influence of various factors, encompassing:
Supply and demand dynamics: The fundamental principles of supply and demand exert a significant impact on precious metal prices. Limited supply coupled with high demand typically drives prices upward.
Economic indicators: Economic data, including inflation rates, interest rates, and GDP growth, can shape the price trajectory of precious metals. For instance, during periods of elevated inflation, investors often seek refuge in precious metals as a store of value, leading to increased demand and subsequent price appreciation.
Geopolitical events: Geopolitical occurrences like wars, trade conflicts, and political instability have the potential to sway precious metal prices. When geopolitical tensions escalate, investors frequently turn to precious metals as a safe haven, fueling demand and subsequently driving prices higher.
Currency fluctuations: Since the price of precious metals is commonly denominated in US dollars, fluctuations in currency value can impact metal prices. For instance, if the US dollar strengthens, precious metal prices may experience a decline as they become relatively more expensive for buyers using other currencies.
Investor sentiment: The sentiment and outlook of investors can play a vital role in shaping precious metal prices. Bullish sentiment may lead to increased buying activity, resulting in price surges. Conversely, bearish sentiment may prompt investors to sell their holdings, leading to price declines.
To summarize, the price of precious metals is influenced by a multifaceted interplay of factors, ranging from the core dynamics of supply and demand to geopolitical events and currency fluctuations.
Investing in precious metals offers several avenues for investors to participate in the market. Here are three of the most popular approaches:
Stocks: Investors can purchase shares in mining companies engaged in the extraction of precious metals like gold, silver, platinum, and palladium. The stock prices of these companies often correlate closely with the underlying metal's price, as their profitability is tied to production costs and market demand.
Exchange-Traded Funds (ETFs): Precious metal ETFs enable investors to buy shares in a fund that holds physical precious metals, such as gold or silver. These funds aim to track the price movements of the respective metal, providing a convenient means of exposure to the market without the need for physical storage and transportation of the metals.
Contracts for Difference (CFDs): CFDs are financial instruments that allow investors to speculate on the price fluctuations of precious metals without owning the physical metal itself. By entering into a contract with a broker, investors can buy or sell the metal at a predetermined price on a future date. CFDs are a more speculative approach, involving leverage and potentially significant losses if the metal's price moves unfavorably.
The potential earnings from trading precious metals can vary greatly and are highly dependent on individual factors and market conditions. It's important to note that trading in precious metals can be subject to volatility and fluctuations, and there are no guarantees of specific earnings. While gold and silver have demonstrated a long-term upward trend, it is crucial to approach trading with realistic expectations.
Over the long term, precious metals have historically shown the potential for favorable returns. However, short-term gains can be less predictable. It's important to have a long-term perspective and not expect significant profits within a short period. Patience and a strategic approach are key when investing in precious metals.
It's worth mentioning that the scarcity of precious metals, especially gold, has a significant impact on their value. As the available supply diminishes over time while demand remains steady or increases, the price per unit tends to rise. This trend is driven by the basic principles of supply and demand.
In summary, while precious metals can offer good returns over the long term, it's important to manage expectations and understand that substantial earnings may take years or even decades to materialize.
Investing in precious metals offers both advantages and disadvantages. Here are the key pros and cons to consider:
Advantages:
Safe haven investment: Precious metals, particularly gold and silver, are often viewed as safe haven assets during economic uncertainty or market instability. They can act as a hedge against inflation, currency devaluation, and geopolitical risks.
Diversification: Precious metals provide diversification benefits to an investment portfolio. They have a low correlation with traditional assets like stocks and bonds, which can help reduce overall portfolio risk and enhance stability.
Tangible assets: Precious metals are physical assets that can be held directly, offering a sense of ownership and security for some investors. Having tangible assets can also provide a potential alternative during times of financial crisis or disruptions in the banking system.
Disadvantages:
Volatility: Precious metal prices can be highly volatile, experiencing significant price swings within short periods. This volatility can pose risks, especially for short-term traders or those seeking quick profits.
Limited income potential: Unlike stocks or bonds, precious metals do not generate income through interest payments or dividends. Their value primarily relies on price appreciation, which may limit their long-term growth potential compared to income-generating investments.
Storage and insurance costs: If investing in physical precious metals, storage and insurance expenses can add to the overall costs of ownership. Proper storage facilities and insurance coverage are necessary to protect the value of the assets, which can eat into potential returns.
Market manipulation concerns: Critics argue that the precious metals market may be susceptible to manipulation by large players or governments, potentially leading to artificial price movements that may not reflect true supply and demand dynamics.
It's important for investors to carefully weigh these advantages and disadvantages, taking into account their financial goals, risk tolerance, and the broader investment landscape. Consulting with a financial advisor or conducting thorough research is recommended before making any investment decisions in precious metals.
Are Precious Metals A Good Investment For You?
Determining whether precious metals are a good investment for you requires considering various factors such as your financial goals, risk tolerance, and investment timeframe. Here are some key points to consider:
Diversification: Precious metals can serve as a valuable component of a diversified investment portfolio, as they often have a low correlation with other asset classes. This diversification can help mitigate risk and stabilize portfolio performance.
Inflation protection: Precious metals are historically considered a hedge against inflation since their value tends to rise when the purchasing power of fiat currencies declines. If protecting against inflation is a priority for you, investing in precious metals could be advantageous.
Volatility: It's important to recognize that precious metals can experience significant price volatility, which may not align with the risk tolerance of every investor. If you are uncomfortable with substantial price fluctuations, other investment options may be more suitable.
Liquidity: Precious metals generally offer high liquidity, meaning they can be easily bought or sold on major exchanges. This accessibility allows for flexibility and quick access to funds when needed.
Long-term perspective: Investing in precious metals, particularly gold, often yields gradual and steady returns over the long term. Patience is crucial when investing in these assets, as their growth tends to occur gradually rather than in short-term bursts.
Considering these factors, it is recommended to conduct thorough research, assess your individual circumstances, and consult with a financial advisor before deciding if precious metals are a suitable investment for you.

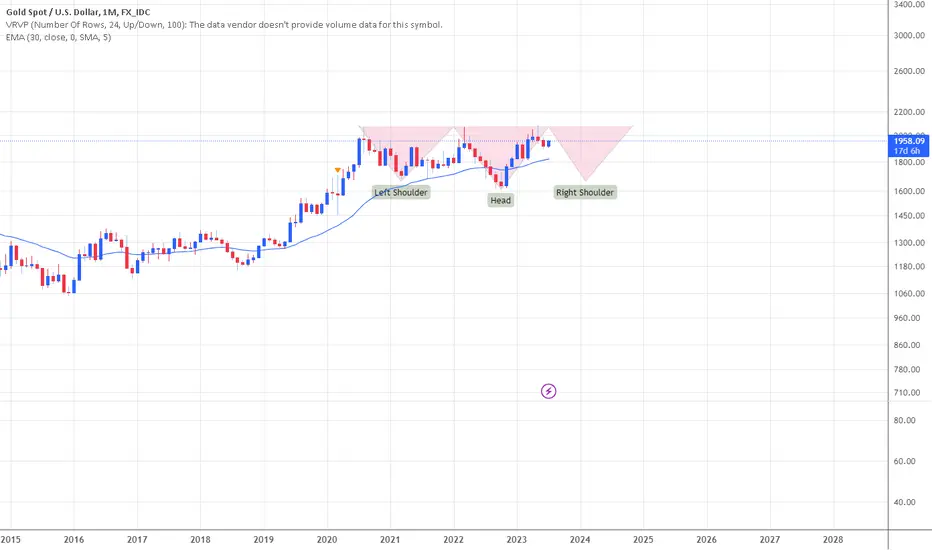
An idea on Gold before breakoutMany technical analysts are talking about a Cup and handle pattern on Gold. I used to agree, but now as the chart shows, it could be forming an inverse head and shoulders pattern before breakout. If true, bulls will have to wait well over another year for the breakout.
OANDA:XAUUSD
Huge market deficit, speculation, and investment appealSilver is a precious metal that has long been valued for its versatility, beauty, and rarity. Its unique properties have made it an important material for both monetary and industrial uses. While silver is often overshadowed by gold in terms of investment appeal, it has its own unique investment potential that should not be overlooked. Based on the data from The Silver Institute and Metals Focus, there are several developments in this space that may make silver an attractive option for investment or speculation in the coming months.
To better understand this opportunity, it is important to be acquainted with the driving forces in the silver market. Silver is produced by mining and recycling. On the demand side, silver has a variety of uses, including in jewelry, silverware, investment, and industrial applications. In 2022, the total supply stood at 31,250 metric tonnes. Meanwhile, total demand reached 38,643 metric tonnes.
The mining activity accounted for 81.84% (25,578 metric tonnes) of the supply in 2022, with recycling contributing the remaining 18.16% (5,618 metric tonnes). Mining output dropped by approximately 1% YoY, and recycling grew by about 3% YoY.
As for the demand in 2022, industrial use accounted for 44.79% (17,309 metric tonnes), jewelry for 18.83% (7,280 metric tonnes), silverware for 5.91% (2,286 metric tonnes), photography for 2.21% (855 metric tonnes), and physical investment for 26.79% (10,356 metric tonnes); the remaining 1.47% of the demand relates to the other uses.
The investment demand for silver doubled from 4,884 metric tonnes in 2017 to 10,356 metric tonnes in 2022. Furthermore, jewelry demand fully recovered from a slump during the Covid-19 epidemic, rising from 4,680 metric tonnes in 2020 to 7,280 metric tonnes in 2022. In fact, the total demand for silver returned stronger from the 2020 disruption, resulting in the market being undersupplied by 7,393 metric tonnes in 2022.
As the World Silver Survey 2023 expects the total output to grow only by 2% in 2023, the market deficit represents an interesting dynamic that might prove to be impactful to the price of silver in the future. However, with the current weakness in the precious metals sector, we think it would be reasonable to either wait a little bit longer before entering a trade or start with very small purchases in multiple transactions (leaving more capital on the side for later). Our goal would be to get the entry closest to the $20 price tag and wait for silver to rise above $26.
Illustration 1.01
Illustration 1.01 shows the daily chart of XAGUSD. One red arrow indicates the declining price from 5th May 2023 until yesterday; the other red arrow hints at volume, which started to decline more recently. Normally, such a relationship between the price and volume suggests that selling pressure is losing steam, and reversal can be impending.
Technical analysis
Daily = Bearish
Weekly = Bearish
Please feel free to express your ideas and thoughts in the comment section.
DISCLAIMER: This analysis is not intended to encourage any buying or selling of any particular securities. Furthermore, it should not be a basis for taking any trade action by an individual investor. Therefore, your own due diligence is highly advised before entering a trade.

✅SILVER SHORT FROM RESISTANCE🔥
✅SILVER surged again to retest the resistance at 24.87$
But it is a strong key level
So I think that there is a high chance
That we will see a bearish pullback and a move down
SHORT🔥
✅Like and subscribe to never miss a new idea!✅

#Silver Update Just like with gold the chances are that we are in a rising wedge which is ending diagonal in wave c. Very speculative at this point though.

#Gold Update Given the low timeframe waves the chances are we are in a scenario with ABC flat where C is an ending diagonal

GOLD Local Short From Resistance! Sell!
Hello,Traders!
GOLD has again reached
The wide horizontal resistance
Of 1941$ so naturally we
Will be expecting a local
Pullback to the downside
Sell!
Like, comment and subscribe to help us grow!
Check out other forecasts below too!

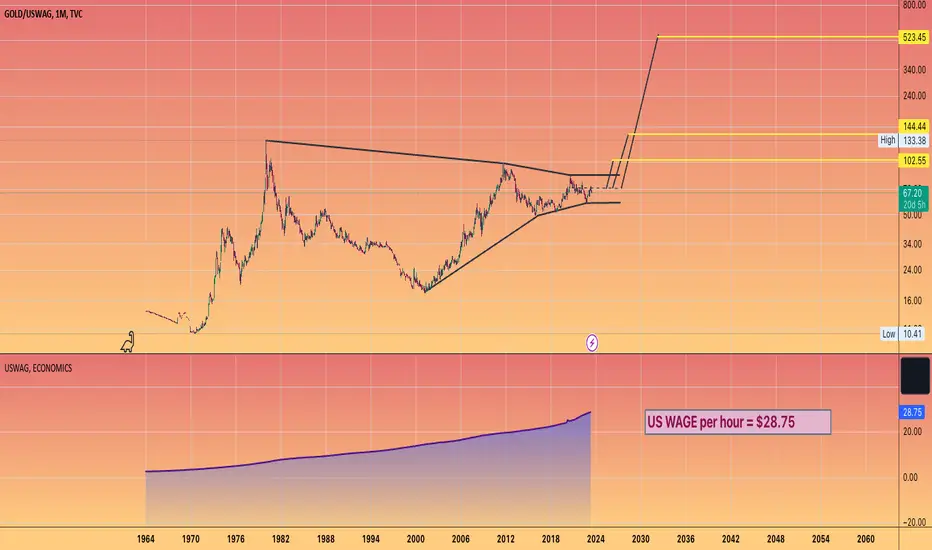
BEFORE 1971 u could acquire 1 #Gold Oz for 10 hours of labourThe erosion of wealth via #fiat debasement is clear for you to see on this chart
With the price of gold denominated us avg salary per hour
* The BLS actually has a higher number of $32 ... but the data on that price has less historical data.
NOW it takes nearly two weeks of labour to acquire 1 oz
(pre tax and living expenses obviously)
But this chart also perilously points how painful the end of US dollar dominance could be.
Pointing to an astronomical level of over 500 hours of work to get one gold ounce.
Clearly adding #PreciousMetals to your portfolio could be one the great wealth builders in the coming years.
#Silver UpdateWhile Silver did not follow Gold closely, it also shaped the first two steps of the upward move within a corrective structure. Since Silver revealed what increasingly looks like an incomplete symmetrical triangle (A)(B)(C)(D)(E), I am inclined to think that the structure in the making is a bigger triangle (unlike in Gold) or a triangle as wave y. The reason - triangles consist of simple zigzags ABC. Only one complex wave is allowed - double zigzag or another nested triangle.
Another possibility is an ending diagonal or impulse wave c labelled in teal. That would nicely match the base case scenario in Gold.

#GOLD Update In the previous week's update, I highlighted enough certainty to go long because of the ending diagonal (C) of in the chart below.
We spent the entire week creating the opening move, which I've labelled wave A or (1) below. There is no preferred structure at this moment, and the complexity of the scenarios should remain on the chart. However, I can somewhat discount the larger running triangle labelled in black circles ABCDE. Given that wave is a clear (W)(X)(Y), and wave is nearly 2x of , the running triangle is less likely but not ruled out.

#Silver XAGUSD Update Okay, it appears that we can exclude the abc flat scenario (since the price formed what appears to be a symmetrical triangle) and maintain the bigger triangle and wxy combo as wave (b) options.

#Litecoin Part 2 -- explosive move versus #silverWe have an upside #HVF for #LTC against #Si !!!
Watch this video to see what that ratio could be!
At some point we will see a precious metals bull market return with a fury
will investors favour the #digital #commodity instead?

#Silver Update #XAGUSD Silver has followed the scenario framework. So far there is no reason to drop any of the options. I am expecting a minor correction and then a surge in prices to $24
