GOLD Support Cluster! Buy!
Hello,Traders!
GOLD went down just as I predicted
And now Gold is retesting the
Support cluster from where
The price is expected to go up
Buy!
Like, comment and subscribe to boost your trading!
See other ideas below too!
Preciousmetals

✅GOLD POTENTIAL LONG🚀
✅GOLD fell again to retest the support
But it is a strong key level
So I think that there is a high chance
That we will see a bullish rebound and a move up
LONG🚀
✅Like and subscribe to never miss a new idea!✅

XAUUSD Bullish retracement for MN timeframeHi traders,
After a successfull sell off ollowing a sccessful bearish wave we see the XAUUSD/ Gold commoditity pull back on the resistence of our monthle bearish channel. We will now call it our support. The pullback will lead us back to the neckline of our double bottom which was from to complete it. Once completed, we anticipate a massive sell off to the crashing XAUUSD commodity. The second option is that it violated the double top, in this case, we will wait for a tripple top to form and catch it after three confirmations.
#Preciousmetals #XAUUSD #Goldcrash

✅GOLD HOW TO TRADE? |SHORT🔥
✅GOLD s trading in a downtrend
And the price has make a pullback
From the falling resistance
Now, it is retesting a key level
So IF we see a breakout to the
Downside, then Gold will go down
IF the price breaks the falling resistance then the setup is invalid
But for now the bearish scenario
Seems to be more probable
SHORT🔥
✅Like and subscribe to never miss a new idea!✅

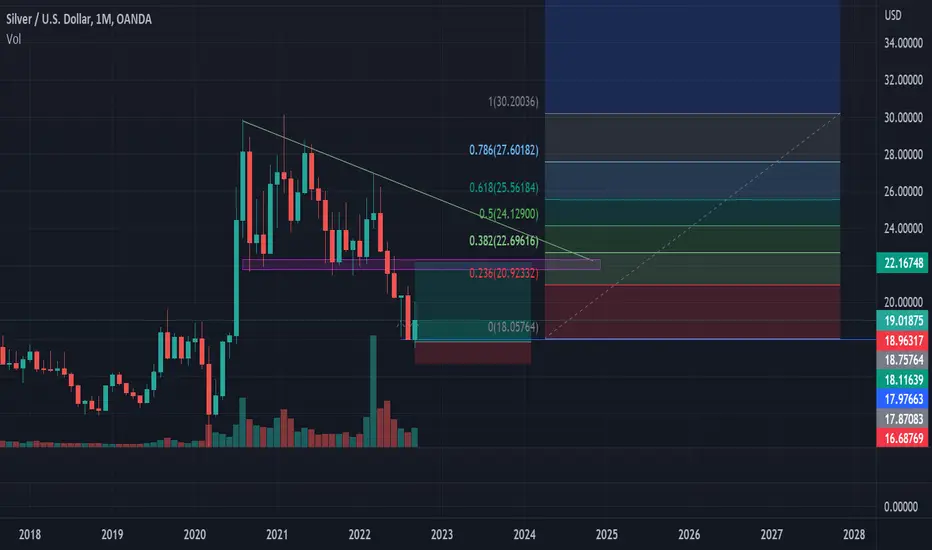
SILVER Support Cluster! Buy!
Hello,Traders!
SILVER broke the falling resistance
And went up, and is now
About to retest the support cluster
From where I would be expecting
A local rebound
Buy!
Like, comment and subscribe to boost your trading!
See other ideas below too!

✅GOLD WILL GO DOWN|SHORT🔥
✅GOLD is going up now
But a strong resistance level is ahead
Thus I am expecting a pullback
And a move down towards the target
SHORT🔥
✅Like and subscribe to never miss a new idea!✅


GOLD Bearish Bias! Sell!
Hello,Traders!
GOLD has retested a horizontal
Resistance level and as Gold
Seems to be locally overbought
I think that we might see
A local pullback and a retest
Of the target below
Sell!
Like, comment and subscribe to boost your trading!
See other ideas below too!

✅SILVER RISKY SHORT🔥
✅SILVER will soon retest a key resistance level
So I think that the pair will make a pullback
And go down to retest the demand level below
SHORT🔥
✅Like and subscribe to never miss a new idea!✅


GOLD Will Fall! Sell!
Hello,Traders!
GOLD is going up to retest
A massive key horizontal resistance level
From where I will be expecting
A pullback and a move down
Towards the local level below
Sell!
Like, comment and subscribe to boost your trading!
See other ideas below too!

✅GOLD SHORT FROM RESISTANCE🔥
✅GOLD will soon retest a key resistance level
So I think that the pair will make a pullback
And go down to retest the demand level below
SHORT🔥
✅Like and subscribe to never miss a new idea!✅

The Gold Odyssey - Gold-ing Down over the next yearsI must attribute this post to my brother who texted me earlier this week asking for my opinion of where Gold is going. I did respond with a "Down" but I felt that I should also validate it properly. And lo and behold, I noticed a major pattern formation, that would break the previous trend/pattern.
Gold appears to be on a VERY CRITICAL LAST DAY of the month.
It needs to close well above 1685 to save it from the pattern break(down). Previously, since 2019, I started this series of The Gold Odyssey documenting Gold's bullish journey, andI think it is about time that Gold changes trend from Bullish to Bearish.
The monthly Gold futures chart is shown here with two very similar pattern breaks. Well, in about 8 hours, we will know if there is a pattern break, and a new bearish pattern truly emerges...
In 2011-2013, a major Gold top formed, and in this formation a couple of characteristics formed:
1. a monthly lower high was formed;
2. a breakdown below the 55 Hull EHMA;
3. a breakdown out of the triangle formation; and
4. MACD cross down into bearish territory
In 2020, Gold made a historical high, and since then, Gold did these few things:
1. a monthly lower high was formed; ✅
2. a breakdown below the 55 Hull EHMA; ✅
3. a breakdown out of the triangle formation; and (candle NOT YET closed, on last few hours now)
4. MACD cross down into bearish territory ✅
The patterns are uncanny and a dead ringer for further downside, projected in a similar fashion to 1275 around later 2024.
Conceptually, longer term patterns are more difficult to form (or break).
Notwithstanding, the Gold monthly chart appears to be suggesting that the relatively trusty Cup and Handle pattern ( about 90% success ) is broken, and a bearish phase is developing with the monthly lower low and (potentially, at this time of writing) a break down out of the triangle.
In summary, the long term technical set up here is suggesting that Gold will be bearish to 1275 over the next two years. Today, it is just the beginning.
Food for thought here, especially for those who had loaded up in Gold over the last couple of years... will revisit once the month, and quarter, is done.

Which is shinier: Bitcoin or Gold? Okay plebs, listen up.
This is the chart I've been using to trade between precious metals and bitcoin, ethereum, and other cryptos. It is a custom chart, adding gold and silver with a modern ratio, doing the same with BTC and ETH, and pitting them against each other. What you get? A smooth chart that obeys technical analysis quite nicely.
And here we have a compression triangle. I drew those dotted lines of the triangle before it pinged them the last 2 times upward and downward, so I know it's legit. And what happens with a compression triangle? When it gets to that last bit like it is now, it breaks out in one direction or the other. The direction is yet undecided, but it FAVORS the direction it was going before the triangle started forming. That is, it is more than likely to break out strongly in the upward direction, favoring precious metals.
This has been building for quite some time, and indicates that the smart money has been rotating from the crypto sector to the PM sector REGARDLESS OF HOW YOU PERSONALLY FEEL ABOUT GOLD. I know, it can be a hard pill to swallow, but hey, the charts don't lie and I'd rather give it to you straight.
Makes sense, afterall, we're in crypto winter atm. At the same time, global economies are unstable, which historically favors gold.
While I believe one day digital gold will shine again, that day is probably a few years off at least. For now, real gold is what shines. Peace yall
THIS IS NOT FINANCIAL ADVICE
Want to know how I trade directly between cryptos and allocated physical precious metals? You'll have to ask me.

XAGUSD BULLISH FORECASTHi traders,
We closed our Silver trades manually after seing XAUUSD meeting our target faster than silver. We believe that these precious metals move together and thus the need to re-analyze to maximis our profits. We see XAGUSD looks to retest our resistance, we will take this bullish trade and sell again at the after it rejects on the resistance area.
#Commodities #XAGUSD # Silver #Commoditytrading
Disclaimer
NASDAQ Guru offers general trading signals that does not take into consideration your own trading experiences, personal objectives and goals, financial means, or risk tolerance.
$XAU - WEEKLY & DAILY CLOSE IS KEY!$XAU - WEEKLY & DAILY CLOSE IS KEY!
A long term area, one to keep an eye on checking on HT = ST movement! We do have FOMC in 6 days time! Expecting another hike... and as I stated this morning cash is still king and will remain that way for little while longer.
Enjoy,
TJ

Breakout soon AUGBP will breakout soon, very soon. Either GBP will weaken more or Gold will start rising. As my previous post, DXY is close to peak then GBP has bottomed and Gold should start rising. Buy gold. Lets go XAU.

✅SILVER POTENTIAL SHORT🔥
✅SILVER is trading along the falling resistance line
And as the pair is going down now
After the retest of the line
I am expecting the price to keep falling
With the target of retesting the demand levels below
SHORT🔥
✅Like and subscribe to never miss a new idea!✅

Gold. Detailed Elliott Wave structure.Gold is about to end this ABC correction. Wave 5 of C of 4 is in progress. Ideal target is 1575. Next upside target is at least 2500

SILVER Risky Long! Buy!
Hello,Traders!
SILVER fell down sharply today
And the price is now retesting
A horizontal support level
From where I think
We might see a bullish rebound
Buy!
Like, comment and subscribe to boost your trading!
See other ideas below too!

Quality Short Opportunity on GoldAs Gold rebounds off of its lows I will be looking to start a short position as it enters the key resistance area (purple zone). I will stay patient to add most of the position on a final swing up to grab liquidity above the key zone and ultimately complete a bearish divergence. My short target is a macro golden pocket, the bottom of a macro parallel channel, and the next big support level on Gold. $1,575-1,550.
Use proper risk management and a stop loss and this could be a very profitable trade, good luck!
Below is a zoomed out image of the trade discussed, looks good.

GOLD Sell UpdateAmazing short setup on Gold Shared in April. Down nealy 3,000 pips and 90% trade setup complete.
Original idea in link below

✅GOLD MASSIVE BREAKOUT|SHORT🔥
✅GOLD is trading in a downtrend
But the metal was hovering above
The KEY support level which seemed
Like it was unbreakable until today
When we saw a massive breakout
To the downside which makes me
Bearish biased on Gold and I think
That is might go further down
Until the market collects itself from the shock
And makes a correction upwards
SHORT🔥
✅Like and subscribe to never miss a new idea!✅
