GBPAUD: Will Start Growing! Here is Why:
Looking at the chart of GBPAUD right now we are seeing some interesting price action on the lower timeframes. Thus a local move up seems to be quite likely.
Disclosure: I am part of Trade Nation's Influencer program and receive a monthly fee for using their TradingView charts in my analysis.
❤️ Please, support our work with like & comment! ❤️
Prediction

GOLD: Short Trade Explained
GOLD
- Classic bearish setup
- Our team expects bearish continuation
SUGGESTED TRADE:
Swing Trade
Short GOLD
Entry Point - 3365.4
Stop Loss - 3372.6
Take Profit - 3352.8
Our Risk - 1%
Start protection of your profits from lower levels
Disclosure: I am part of Trade Nation's Influencer program and receive a monthly fee for using their TradingView charts in my analysis.
❤️ Please, support our work with like & comment! ❤️

AUDNZD: Long Trade Explained
AUDNZD
- Classic bullish formation
- Our team expects growth
SUGGESTED TRADE:
Swing Trade
Buy AUDNZD
Entry Level - 1.0766
Sl - 1.0740
Tp - 1.0812
Our Risk - 1%
Start protection of your profits from lower levels
Disclosure: I am part of Trade Nation's Influencer program and receive a monthly fee for using their TradingView charts in my analysis.
❤️ Please, support our work with like & comment! ❤️

GBPCAD: Long Trade with Entry/SL/TP
GBPCAD
- Classic bullish formation
- Our team expects pullback
SUGGESTED TRADE:
Swing Trade
Long GBPCAD
Entry - 1.8543
Sl - 1.8509
Tp - 1.8596
Our Risk - 1%
Start protection of your profits from lower levels
Disclosure: I am part of Trade Nation's Influencer program and receive a monthly fee for using their TradingView charts in my analysis.
❤️ Please, support our work with like & comment! ❤️

USDCAD: Growth & Bullish Continuation
Remember that we can not, and should not impose our will on the market but rather listen to its whims and make profit by following it. And thus shall be done today on the USDCAD pair which is likely to be pushed up by the bulls so we will buy!
Disclosure: I am part of Trade Nation's Influencer program and receive a monthly fee for using their TradingView charts in my analysis.
❤️ Please, support our work with like & comment! ❤️

EURUSD: Expecting Bullish Movement! Here is Why:
Balance of buyers and sellers on the EURUSD pair, that is best felt when all the timeframes are analyzed properly is shifting in favor of the buyers, therefore is it only natural that we go long on the pair.
Disclosure: I am part of Trade Nation's Influencer program and receive a monthly fee for using their TradingView charts in my analysis.
❤️ Please, support our work with like & comment! ❤️

NZDUSD: Bearish Continuation & Short Trade
NZDUSD
- Classic bearish setup
- Our team expects bearish continuation
SUGGESTED TRADE:
Swing Trade
Short NZDUSD
Entry Point - 0.6018
Stop Loss - 0.6051
Take Profit - 0.5952
Our Risk - 1%
Start protection of your profits from lower levels
Disclosure: I am part of Trade Nation's Influencer program and receive a monthly fee for using their TradingView charts in my analysis.
❤️ Please, support our work with like & comment! ❤️

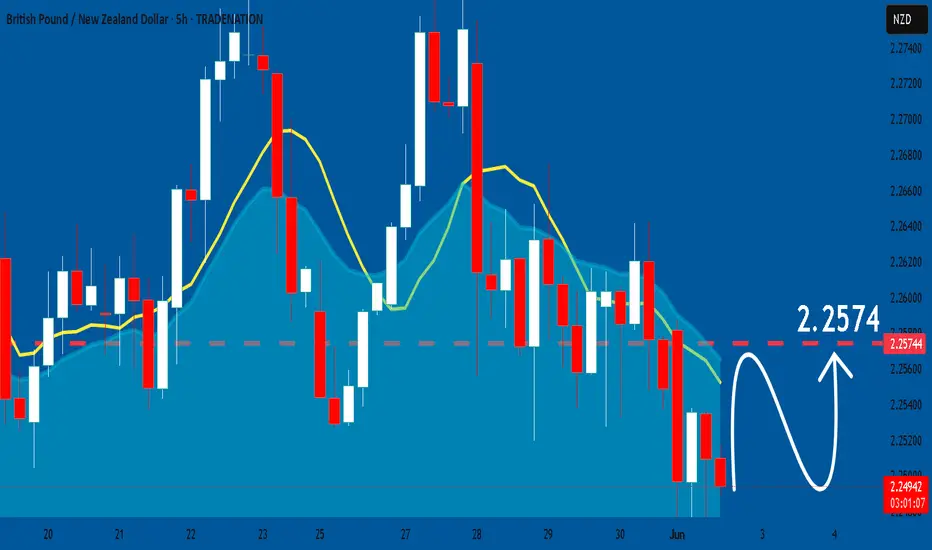
GBPNZD: Market of Buyers
The charts are full of distraction, disturbance and are a graveyard of fear and greed which shall not cloud our judgement on the current state of affairs in the GBPNZD pair price action which suggests a high likelihood of a coming move up.
Disclosure: I am part of Trade Nation's Influencer program and receive a monthly fee for using their TradingView charts in my analysis.
❤️ Please, support our work with like & comment! ❤️
AUDCAD: Will Start Falling! Here is Why:
Our strategy, polished by years of trial and error has helped us identify what seems to be a great trading opportunity and we are here to share it with you as the time is ripe for us to sell AUDCAD.
Disclosure: I am part of Trade Nation's Influencer program and receive a monthly fee for using their TradingView charts in my analysis.
❤️ Please, support our work with like & comment! ❤️

GOLD: Short Signal with Entry/SL/TP
GOLD
- Classic bearish formation
- Our team expects fall
SUGGESTED TRADE:
Swing Trade
Sell GOLD
Entry Level - 3369.0
Sl - 3381.1
Tp - 3345.8
Our Risk - 1%
Start protection of your profits from lower levels
Disclosure: I am part of Trade Nation's Influencer program and receive a monthly fee for using their TradingView charts in my analysis.
❤️ Please, support our work with like & comment! ❤️

AUDCHF: Great Trading Opportunity
AUDCHF
- Classic bullish pattern
- Our team expects retracement
SUGGESTED TRADE:
Swing Trade
Buy AUDCHF
Entry - 0.5296
Stop - 0.5277
Take - 0.5338
Our Risk - 1%
Start protection of your profits from lower levels
Disclosure: I am part of Trade Nation's Influencer program and receive a monthly fee for using their TradingView charts in my analysis.
❤️ Please, support our work with like & comment! ❤️

TESLA: Short Trade with Entry/SL/TP
TESLA
- Classic bearish formation
- Our team expects pullback
SUGGESTED TRADE:
Swing Trade
Short TESLA
Entry - 345.78
Sl - 360.55
Tp - 309.96
Our Risk - 1%
Start protection of your profits from lower levels
Disclosure: I am part of Trade Nation's Influencer program and receive a monthly fee for using their TradingView charts in my analysis.
❤️ Please, support our work with like & comment! ❤️

USOIL: Bullish Forecast & Bullish Scenario
The price of USOIL will most likely increase soon enough, due to the demand beginning to exceed supply which we can see by looking at the chart of the pair.
Disclosure: I am part of Trade Nation's Influencer program and receive a monthly fee for using their TradingView charts in my analysis.
❤️ Please, support our work with like & comment! ❤️

EURUSD: Bearish Continuation
The recent price action on the EURUSD pair was keeping me on the fence, however, my bias is slowly but surely changing into the bearish one and I think we will see the price go down.
Disclosure: I am part of Trade Nation's Influencer program and receive a monthly fee for using their TradingView charts in my analysis.
❤️ Please, support our work with like & comment! ❤️

BTC eliot wave prediction
106,600$ → 100,300$ → 116,000$
The third extended wave of Bitcoin has completed, and it is now going through a correction phase.
Wave 4 corrections often retrace to the 0.382 Fibonacci level.
Therefore, a price drop to that level is expected — around $106,600.
This correction is unfolding as a W–X–Y pattern.
In wave W, the internal ABC subwaves completed with wave C reaching 1.618 times the length of wave A.
Currently, Bitcoin is in the rising phase of wave X.
No one knows how high wave X will go,
but what’s important is that after wave X finishes,
one more lower low is expected — again around $106,600.
At that price level, I plan to open a $2 billion long position with 10x leverage.

iBIT - Weekly Volatility SnapshotGood Afternoon,
Here is my weekly perspective for NASDAQ:IBIT ---
IV (48.31%) entering this week is holding in the 24th percent range for the year and has been climbing weekly from putting in new lows at the beginning of the year. We essentially have been seeing rising IV with rising price action, the best of the best. Premium increases from price action climbing and IV rising affects Vega positively increasing premium too.
Bi-weekly trends (27.64%) show a cooling off entering the week and contraction under IV, but it might not last long as there could be major macro news in the crypto world at any moment. This could be a big week on continued regression towards quarterly means (51.52%).
If this happens the range will continue to expand in my option and hold a +3.21% value per move on premium over stated IV, but weekly trends would be expanding 23.89% -- A huge move.
As always --
For those interested in volatility analysis and the application of weighted HV ranges to IV, I encourage you to BOOST and share this post, leave a comment, or follow me to join me on this journey.

BITx - Weekly Volatility SnapshotGood Afternoon,
Here is my weekly perspective for CBOE:BITX
IV (96.75%) entering this week is holding in the 18th percent range for the year and has been climbing weekly from putting in new lows at the beginning of the year. We essentially have been seeing rising IV with rising price action, the best of the best. Premium increases from price action climbing and IV rising affects Vega positively increasing premium too.
Bi-weekly trends (56.07%) show a cooling off entering the week and contraction under IV, but it might not last long as there could be major macro news in the crypto world at any moment. This could be a big week on continued regression towards quarterly means (104.06%).
If this happens the range will continue to expand in my option and hold a +7.31% value per move on premium over stated IV, but weekly trends would be expanding 47.99% -- A huge move.
As always --
For those interested in volatility analysis and the application of weighted HV ranges to IV, I encourage you to BOOST and share this post, leave a comment, or follow me to join me on this journey.

S&P 500 Index -- Weekly Volatility Potential Good Afternoon!
This week, I want to talk about the CBOE:SPX and its weekly potential for how I read historical volatility to weight it then to implied volatility -- this creates my custom trading ranges.
Implied ranges for this week are calculated at 4 DTE using my strength of IV method. You can find out more how I do this over at my highlights page on 'X' - Find me @askHVtobidIV
We are entering a short week, with IV currently in the 89th percentile for the year ( 18.31% ) and resonating between bi-weekly ( 19.36% ) and monthly ( 15.13% ) historical values. Quarterly volatility trends ( 31.79% ) have risen more than 10% this year alone due to macro concerns and increased news from tariff uncertainties. This is creating a volatile environment that, in turn, only increases our trading ranges. Something I personally like.
Near-term trends are above the currently high IV environment, suggesting further expansion. This provides premium value on what is happening to what is projected to happen and a “strength of IV” of >100% indicating rising volatility, slowly towards quarterly means, while resonating around monthly trends.
If price action drives downwards, our gap from May 16th could fill around $5,692.56 with confluence of HV21 trends at $5,710.91.
Conversely, I can see HV10 ranges with rising pricing action and good macro news with EU tariffs breaking $5,971.33—Expanding to the price of $5,995.95 with continuing expansion and regression towards means.
Come back next weekend as I will review the chart to see how we developed!
For those interested in volatility analysis and the application of weighted HV ranges to IV, I encourage you to BOOST and share this post, leave a comment, or follow me to join me on this journey.

BTCUSD: Bullish Continuation & Long Trade
BTCUSD
- Classic bullish setup
- Our team expects bullish continuation
SUGGESTED TRADE:
Swing Trade
Long BTCUSD
Entry Point - 10465
Stop Loss - 10321
Take Profit - 10794
Our Risk - 1%
Start protection of your profits from lower levels
Disclosure: I am part of Trade Nation's Influencer program and receive a monthly fee for using their TradingView charts in my analysis.
❤️ Please, support our work with like & comment! ❤️

USDCAD: Long Signal Explained
USDCAD
- Classic bullish formation
- Our team expects growth
SUGGESTED TRADE:
Swing Trade
Buy USDCAD
Entry Level - 1.3742
Sl - 1.3706
Tp - 1.3809
Our Risk - 1%
Start protection of your profits from lower levels
Disclosure: I am part of Trade Nation's Influencer program and receive a monthly fee for using their TradingView charts in my analysis.
❤️ Please, support our work with like & comment! ❤️

SILVER: Will Start Growing! Here is Why:
Our strategy, polished by years of trial and error has helped us identify what seems to be a great trading opportunity and we are here to share it with you as the time is ripe for us to buy SILVER.
Disclosure: I am part of Trade Nation's Influencer program and receive a monthly fee for using their TradingView charts in my analysis.
❤️ Please, support our work with like & comment! ❤️

NATGAS: Forecast & Technical Analysis
The recent price action on the NATGAS pair was keeping me on the fence, however, my bias is slowly but surely changing into the bullish one and I think we will see the price go up.
Disclosure: I am part of Trade Nation's Influencer program and receive a monthly fee for using their TradingView charts in my analysis.
❤️ Please, support our work with like & comment! ❤️

Altseason Isn’t Over – It’s Just Getting Started !!It’s not the end of #Altcoins this is just a small dip before the big move. 🚀
Right now, all EMAs (50, 100, 200) are sitting at the same level. This is acting as very strong support around the $1.12T zone.
Price has bounced from this area before, and if it holds again, we could see a big breakout toward $1.28T+.
Altseason isn’t over. It’s loading.
Be ready. 👀
#TOTAL2 #Altseason2025
