Weekly Volatility SnapshotVolatility, expressed through standard deviation, quantifies market elasticity and presents a level of probability and precision that humbles us all.
In my analysis, I track trending volatility to discern historical patterns (HV) and utilize them to anticipate future outcomes (IV). This weighted indicator provides a comprehensive and accurate range for observation.
When trending historical volatility expands or contracts around implied volatility, price action can be interpreted as positively or negatively compounded within the predicted implied range.
I measure this concept using the ‘strength’ of IV and calculate my implied range based on the current market elasticity. This system is adaptable to any IV condition, as it allows for a fair assessment of market movements and potential outcomes.
__________________________________
Last week, volatility increased slightly as bi-weekly trends picked up over monthly values -- the same near term trends with the major indices show strength within 8% of IV into this next week.
One thing to note: NASDAQ:MSFT NASDAQ:NVDA and NASDAQ:TSLA all show near term contraction under stated IV within the magnificent 7 while the rest show shorter term volatility as expansive.
What do you think the CBOE:VIX will do this next week?
___________________________________
For those interested in volatility analysis and the application of my system using weighted HV ranges to IV, I encourage you to BOOST and share this post, leave a comment, or follow me to join me on this journey!
We will weekly analyze our ranges under the VIX and engage in discussions.
Prediction

APPLE: Bullish Continuation & Long Trade
APPLE
- Classic bullish pattern
- Our team expects retracement
SUGGESTED TRADE:
Swing Trade
Buy APPLE
Entry - 195.23
Stop - 188.82
Take - 206.74
Our Risk - 1%
Start protection of your profits from lower levels
Disclosure: I am part of Trade Nation's Influencer program and receive a monthly fee for using their TradingView charts in my analysis.
❤️ Please, support our work with like & comment! ❤️

USDJPY: Long Signal Explained
USDJPY
- Classic bullish setup
- Our team expects bullish continuation
SUGGESTED TRADE:
Swing Trade
Long USDJPY
Entry Point - 142.56
Stop Loss - 141.39
Take Profit - 144.82
Our Risk - 1%
Start protection of your profits from lower levels
Disclosure: I am part of Trade Nation's Influencer program and receive a monthly fee for using their TradingView charts in my analysis.
❤️ Please, support our work with like & comment! ❤️

USDCHF: Market of Buyers
Balance of buyers and sellers on the USDCHF pair, that is best felt when all the timeframes are analyzed properly is shifting in favor of the buyers, therefore is it only natural that we go long on the pair.
Disclosure: I am part of Trade Nation's Influencer program and receive a monthly fee for using their TradingView charts in my analysis.
❤️ Please, support our work with like & comment! ❤️

EURUSD: Will Start Falling! Here is Why:
The recent price action on the EURUSD pair was keeping me on the fence, however, my bias is slowly but surely changing into the bearish one and I think we will see the price go down.
Disclosure: I am part of Trade Nation's Influencer program and receive a monthly fee for using their TradingView charts in my analysis.
❤️ Please, support our work with like & comment! ❤️

USOIL Under Pressure! SELL!
My dear friends,
Please, find my technical outlook for USOIL below:
The price is coiling around a solid key level - 61.69
Bias - Bearish
Technical Indicators: Pivot Points Low anticipates a potential price reversal.
Super trend shows a clear sell, giving a perfect indicators' convergence.
Goal - 61.18
About Used Indicators:
The pivot point itself is simply the average of the high, low and closing prices from the previous trading day.
Disclosure: I am part of Trade Nation's Influencer program and receive a monthly fee for using their TradingView charts in my analysis.
———————————
WISH YOU ALL LUCK

AUDUSD: Bearish Continuation & Short Signal
AUDUSD
- Classic bearish formation
- Our team expects pullback
SUGGESTED TRADE:
Swing Trade
Short AUDUSD
Entry - 0.6464
Sl - 0.6484
Tp - 0.6424
Our Risk - 1%
Start protection of your profits from lower levels
Disclosure: I am part of Trade Nation's Influencer program and receive a monthly fee for using their TradingView charts in my analysis.
❤️ Please, support our work with like & comment! ❤️

NZDUSD: Weak Market & Bearish Forecast
It is essential that we apply multitimeframe technical analysis and there is no better example of why that is the case than the current NZDUSD chart which, if analyzed properly, clearly points in the downward direction.
Disclosure: I am part of Trade Nation's Influencer program and receive a monthly fee for using their TradingView charts in my analysis.
❤️ Please, support our work with like & comment! ❤️

EURJPY: Expecting Bearish Movement! Here is Why:
The analysis of the EURJPY chart clearly shows us that the pair is finally about to tank due to the rising pressure from the sellers.
Disclosure: I am part of Trade Nation's Influencer program and receive a monthly fee for using their TradingView charts in my analysis.
❤️ Please, support our work with like & comment! ❤️

GOLD: Short Trading Opportunity
GOLD
- Classic bearish pattern
- Our team expects retracement
SUGGESTED TRADE:
Swing Trade
Sell GOLD
Entry - 3330.6
Stop - 3337.3
Take - 3316.6
Our Risk - 1%
Start protection of your profits from lower levels
Disclosure: I am part of Trade Nation's Influencer program and receive a monthly fee for using their TradingView charts in my analysis.
❤️ Please, support our work with like & comment! ❤️

Fundamental Market Analysis for May 23, 2025 EURUSDEvent to pay attention today:
17:00 EET. USD- Volume of home sales on the primary market
EURUSD:
EUR/USD is recovering its recent losses from the previous session and is trading around 1.1310 during Asian hours on Friday. The pair is rising on the back of lower US Treasury yields, which continue to decline after the US 30-year bond yield retreated from 5.15 per cent, the highest in 19 months.
US President Donald Trump's ‘One Big Beautiful Bill’ has passed the House of Representatives and is on its way to the Senate, sparking fears of a widening budget deficit in the United States (US).
However, EUR/USD lost around 0.50 per cent on Thursday as the US dollar gained as the S&P Global Composite Purchasing Managers' Index (PMI) for May came in at 52.1, up from April's 50.6. Meanwhile, the manufacturing PMI rose to 52.3 from 50.2 previously, while the services PMI rose to 52.3 from 50.8.
Fed Chairman Christopher Waller noted on Thursday that markets are watching fiscal policy. Waller also said that if rates are close to 10%, the economy will be in good shape for H2 and the Fed may be in a position to cut rates later this year.
The Financial Times reported that President Trump is pushing the European Union (EU) to cut tariffs or impose more duties. US Trade Representative Greer is set to tell fellow EU Commissioner for Trade and Economic Security, Maroš Šefčovič, that the recent ‘explanatory memorandum’ does not meet US expectations.
Trading recommendation: BUY 1.13200, SL 1.13000, TP 1.14200

NZDJPY: Long Signal with Entry/SL/TP
NZDJPY
- Classic bullish formation
- Our team expects growth
SUGGESTED TRADE:
Swing Trade
Buy NZDJPY
Entry Level - 84.918
Sl - 84.386
Tp - 85.905
Our Risk - 1%
Start protection of your profits from lower levels
Disclosure: I am part of Trade Nation's Influencer program and receive a monthly fee for using their TradingView charts in my analysis.
❤️ Please, support our work with like & comment! ❤️

AUDCAD: Bullish Continuation & Long Signal
AUDCAD
- Classic bullish formation
- Our team expects pullback
SUGGESTED TRADE:
Swing Trade
Long AUDCAD
Entry - 0.8907
Sl - 0.8880
Tp - 0.8957
Our Risk - 1%
Start protection of your profits from lower levels
Disclosure: I am part of Trade Nation's Influencer program and receive a monthly fee for using their TradingView charts in my analysis.
❤️ Please, support our work with like & comment! ❤️

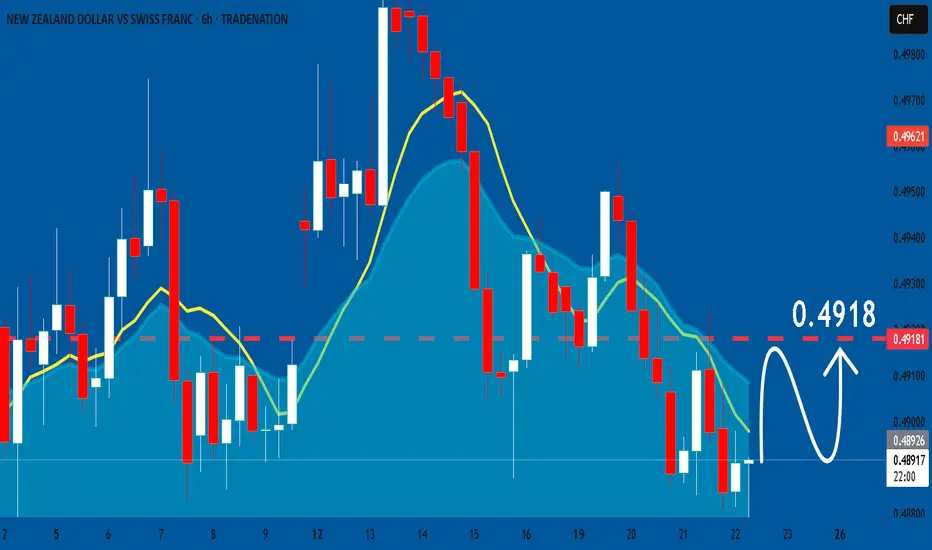
NZDCHF: Market Sentiment & Forecast
The charts are full of distraction, disturbance and are a graveyard of fear and greed which shall not cloud our judgement on the current state of affairs in the NZDCHF pair price action which suggests a high likelihood of a coming move up.
Disclosure: I am part of Trade Nation's Influencer program and receive a monthly fee for using their TradingView charts in my analysis.
❤️ Please, support our work with like & comment! ❤️
EURUSD: Bulls Will Push
The price of EURUSD will most likely increase soon enough, due to the demand beginning to exceed supply which we can see by looking at the chart of the pair.
Disclosure: I am part of Trade Nation's Influencer program and receive a monthly fee for using their TradingView charts in my analysis.
❤️ Please, support our work with like & comment! ❤️

Nightly $SPY / $SPX Scenarios for May 22, 2025 🔮 Nightly AMEX:SPY / SP:SPX Scenarios for May 22, 2025 🔮
🌍 Market-Moving News 🌍
📈 Treasury Yields Surge Amid Weak Bond Auction
U.S. Treasury yields continued their upward trajectory, with the 10-year yield nearing 4.6% and the 30-year yield surpassing 5%, marking the highest levels since early 2023. This increase followed a weak $16 billion auction of 20-year bonds, which attracted less investor demand and sold at higher-than-expected yields. Factors contributing to the rise include fading recession fears, persistent inflation concerns, and growing fiscal worries related to potential tax cut extensions.
📉 Stock Market Declines as Tech Stocks Retreat
The stock market experienced significant losses, with the Dow Jones Industrial Average dropping 1.9%, falling below its 200-day moving average. The S&P 500 and Nasdaq fell 1.6% and 1.4%, respectively.
💼 Snowflake ( NYSE:SNOW ) Reports Strong Earnings
Snowflake Inc. reported record quarterly revenue of $1.04 billion, surpassing expectations. Product revenue increased 26% year-over-year to $996.8 million. The company raised its full-year forecast to $4.325 billion, reflecting a 25% year-over-year increase. Despite a GAAP net loss of $430 million, Snowflake posted an adjusted profit of 24 cents per share, exceeding the 21-cent estimate.
📊 Morgan Stanley Turns Bullish on U.S. Stocks
Morgan Stanley has shifted to a bullish stance on U.S. stocks and bonds, raising its outlook due to signs of market stabilization and improving growth conditions. The bank maintains a base target of 6,500 for the S&P 500 by mid-2026, with a bullish scenario projecting 7,200.
📊 Key Data Releases 📊
📅 Thursday, May 22:
8:30 AM ET: Initial Jobless Claims
9:45 AM ET: S&P Global Flash U.S. Services PMI for May
10:00 AM ET: Advance Services Report (First Quarter 2025)
⚠️ Disclaimer:
This information is for educational and informational purposes only and should not be construed as financial advice. Always consult a licensed financial advisor before making investment decisions.
📌 #trading #stockmarket #economy #news #trendtao #charting #technicalanalysis

EURNZD: Free Trading Signal
EURNZD
- Classic bearish setup
- Our team expects bearish continuation
SUGGESTED TRADE:
Swing Trade
Short EURNZD
Entry Point - 1.9062
Stop Loss - 1.9116
Take Profit - 1.8970
Our Risk - 1%
Start protection of your profits from lower levels
Disclosure: I am part of Trade Nation's Influencer program and receive a monthly fee for using their TradingView charts in my analysis.
❤️ Please, support our work with like & comment! ❤️

AUDCHF: Expecting Bullish Movement! Here is Why:
Our strategy, polished by years of trial and error has helped us identify what seems to be a great trading opportunity and we are here to share it with you as the time is ripe for us to buy AUDCHF.
Disclosure: I am part of Trade Nation's Influencer program and receive a monthly fee for using their TradingView charts in my analysis.
❤️ Please, support our work with like & comment! ❤️

EURGBP: Bearish Forecast & Bearish Scenario
Looking at the chart of EURGBP right now we are seeing some interesting price action on the lower timeframes. Thus a local move down seems to be quite likely.
Disclosure: I am part of Trade Nation's Influencer program and receive a monthly fee for using their TradingView charts in my analysis.
❤️ Please, support our work with like & comment! ❤️

GOLD: Long Trading Opportunity
GOLD
- Classic bullish pattern
- Our team expects retracement
SUGGESTED TRADE:
Swing Trade
Buy GOLD
Entry - 3301.5
Stop - 3295.3
Take - 3312.0
Our Risk - 1%
Start protection of your profits from lower levels
Disclosure: I am part of Trade Nation's Influencer program and receive a monthly fee for using their TradingView charts in my analysis.
❤️ Please, support our work with like & comment! ❤️

CHFJPY: Long Trade Explained
CHFJPY
- Classic bullish setup
- Our team expects bullish continuation
SUGGESTED TRADE:
Swing Trade
Long CHFJPY
Entry Point - 173.57
Stop Loss - 173.03
Take Profit - 174.53
Our Risk - 1%
Start protection of your profits from lower levels
Disclosure: I am part of Trade Nation's Influencer program and receive a monthly fee for using their TradingView charts in my analysis.
❤️ Please, support our work with like & comment! ❤️

CADJPY: Long Trade with Entry/SL/TP
CADJPY
- Classic bullish formation
- Our team expects growth
SUGGESTED TRADE:
Swing Trade
Buy CADJPY
Entry Level - 103.60
Sl - 103.05
Tp - 104.64
Our Risk - 1%
Start protection of your profits from lower levels
Disclosure: I am part of Trade Nation's Influencer program and receive a monthly fee for using their TradingView charts in my analysis.
❤️ Please, support our work with like & comment! ❤️

EURUSD: Weak Market & Bearish Continuation
Remember that we can not, and should not impose our will on the market but rather listen to its whims and make profit by following it. And thus shall be done today on the EURUSD pair which is likely to be pushed down by the bears so we will sell!
Disclosure: I am part of Trade Nation's Influencer program and receive a monthly fee for using their TradingView charts in my analysis.
❤️Please, support our work with like & comment!❤️
