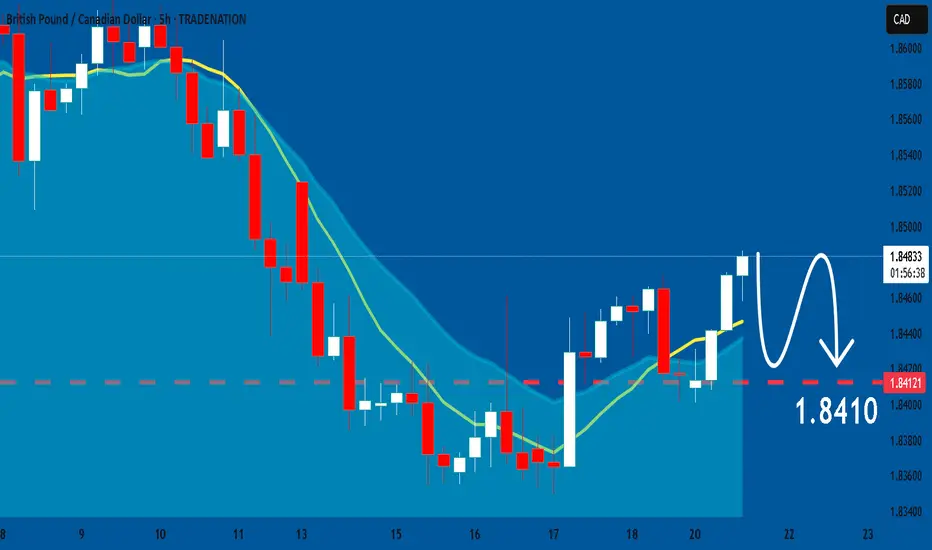
GBPCAD: Will Start Falling! Here is Why:
Remember that we can not, and should not impose our will on the market but rather listen to its whims and make profit by following it. And thus shall be done today on the GBPCAD pair which is likely to be pushed down by the bears so we will sell!
Disclosure: I am part of Trade Nation's Influencer program and receive a monthly fee for using their TradingView charts in my analysis.
❤️ Please, support our work with like & comment! ❤️
Prediction
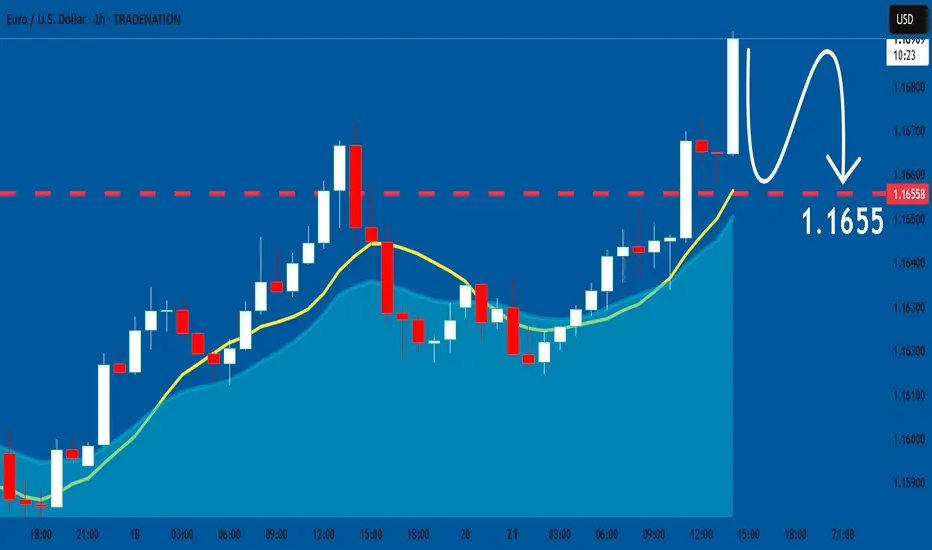
EURUSD: Expecting Bearish Movement! Here is Why:
Balance of buyers and sellers on the EURUSD pair, that is best felt when all the timeframes are analyzed properly is shifting in favor of the sellers, therefore is it only natural that we go short on the pair.
Disclosure: I am part of Trade Nation's Influencer program and receive a monthly fee for using their TradingView charts in my analysis.
❤️ Please, support our work with like & comment! ❤️
GBPUSD Long Opportunity – Inverted Head & Shoulders PatternGBPUSD is currently forming a classic Inverted Head & Shoulders pattern on the 1-hour timeframe — a powerful trend reversal signal that typically marks the shift from bearish to bullish momentum. The structure is clear, with a defined left shoulder, head, and right shoulder, and price now approaching the neckline resistance around 1.3488–1.3495.
Traders should now shift focus to two key confirmation events:
A neckline breakout
A successful retest of the neckline with a bullish reversal candle (e.g., bullish engulfing)
🔍 Trade Plan (Long Setup)
Entry: After 1H candle closes above neckline (~1.3490), wait for a retest of the breakout
Enter long on bullish confirmation candle during the retest
Stop Loss: Below the swing low of the retest (around 1.3440–1.3450)
Risk/Reward Ratio: ~5.5:1
🎯 Target Zones:
TG1: 1.3540 (Minor Resistance)
TG2: 1.3585 (Next structure zone)
Final Target: 1.3627+ (Full measured move from pattern)
📌 Confirmation Tips:
Look for bullish candlestick confirmation on neckline retest (bullish engulfing, hammer, or strong rejection wick)
Avoid entering inside the pattern – confirmation is key to reduce false breakouts
⚠️ Note to Traders:
This setup aligns with a possible shift in sentiment for GBPUSD. The pattern is developing against the larger downtrend, so discipline and stop-loss protection are crucial. A successful breakout and retest would suggest a potential short-term bullish reversal with clean upside targets.
🧠 Stay patient. Let the breakout confirm. Execute with structure.
=================================================================
Disclosure: I am part of Trade Nation's Influencer program and receive a monthly fee for using their TradingView charts in my analysis.
=================================================================

Weekly Volatility Snapshot Good Evening --
I hope everyone is having a restful weekend and enjoying your time away from markets. Always appreciate it while you can, and spend that precious time with loved ones. Now, let us review the price action last week as we look towards our expectations for the coming trading sessions.
The CBOE:SPX opened the weekly candle at $6,126.15 and closed $6,252.50 -- this respectively puts the weekly move at +$126.35. This is slightly above what IV was stating entering the week. We are starting to see seasonality set in as the markets top and look for consolidation. The TVC:VIX dropped throughout the week putting a bottom in at $15.70 which shows volatility creeping to it's lowest point year-to-date.
We should all expect a volatility bounce in the near future as the run the broader markets have made out of the steep correction needs to cool off before moving forward. Below is my volatility read for the S&P 500. You will see that HV10 (7.94%) is coiled within 3.30% of its sliding yearly lows. This tells me between the low sentiment in fear and the low volatility in short-term trends, we need to cool off a little.
Now looking towards this week, I see the broader markets consolidating and even selling off in order to reset the overbought 'lagging' indicators and pop the VIX up a little bit. The administration has pushed the trade deal deadline off till AUG 1st providing some relief to the markets but, has also created more uncertainties with tariff letters that went out Friday.
Look for a negative news cycle sparking up Sunday night into Monday, potentially creating momentum downwards. However, I believe we stay in range of what HV10 weighted to IV implies -- $6,207.72 - $6,311.78. This range holds a divergence from IV of 5.29% and and price gap difference of -$17.32. To me, this says that what is short-term trending is 'contractive' to what IV states.
That's all for this week. Stay hedged against your bias always and remember to practice your ABCs -- If you like what you are reading and love volatility range analysis as much as i do -- feel free to drop me a comment and ill get back to you! Till next time, Cheers!

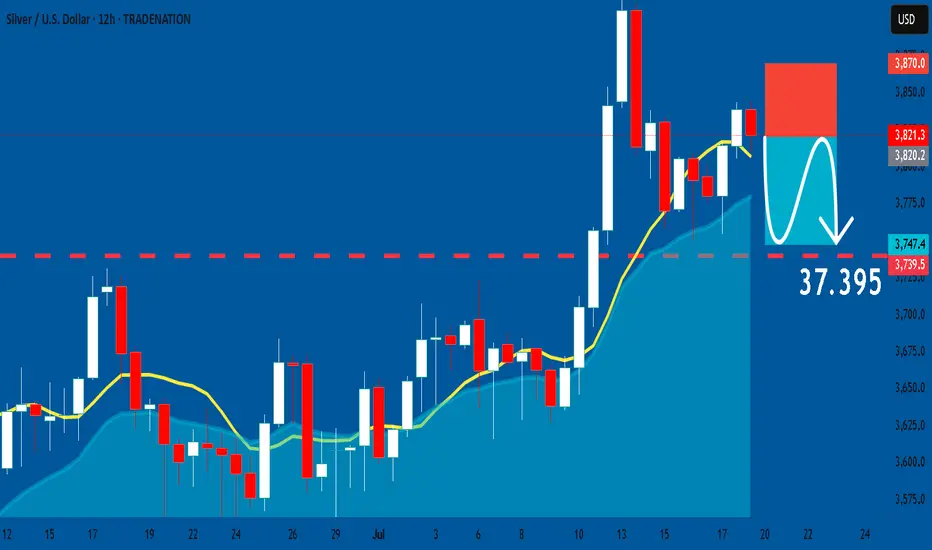
SILVER: Short Trade with Entry/SL/TP
SILVER
- Classic bearish setup
- Our team expects bearish continuation
SUGGESTED TRADE:
Swing Trade
Short SILVER
Entry Point - 38.213
Stop Loss - 38.700
Take Profit - 37.395
Our Risk - 1%
Start protection of your profits from lower levels
Disclosure: I am part of Trade Nation's Influencer program and receive a monthly fee for using their TradingView charts in my analysis.
❤️ Please, support our work with like & comment! ❤️
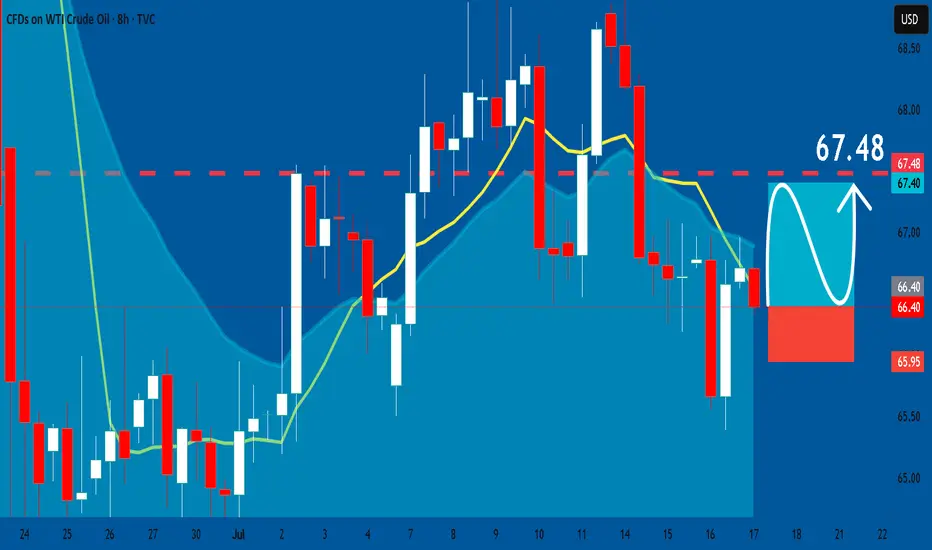
USOIL: Bullish Continuation & Long Trade
USOIL
- Classic bullish pattern
- Our team expects retracement
SUGGESTED TRADE:
Swing Trade
Buy USOIL
Entry - 66.40
Stop - 65.95
Take - 67.48
Our Risk - 1%
Start protection of your profits from lower levels
Disclosure: I am part of Trade Nation's Influencer program and receive a monthly fee for using their TradingView charts in my analysis.
❤️ Please, support our work with like & comment! ❤️
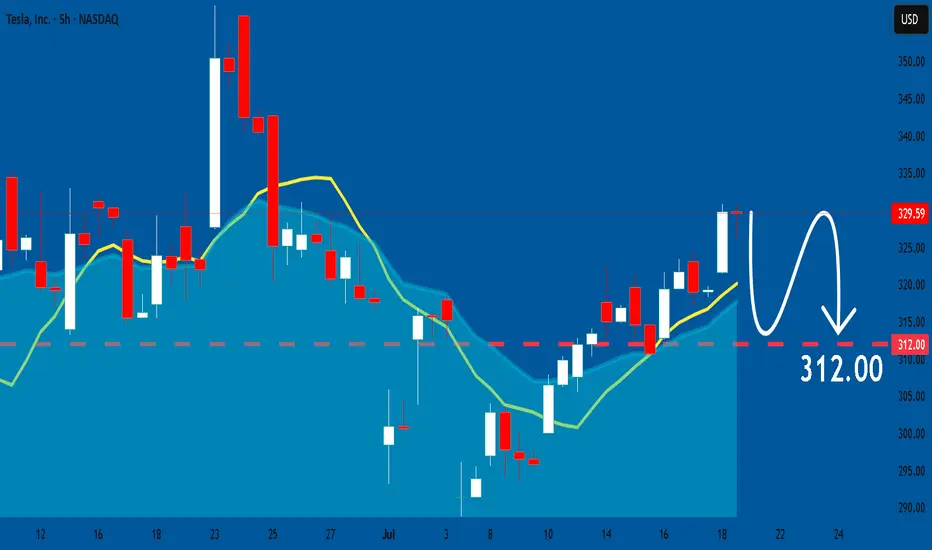
TESLA: Bearish Continuation is Expected! Here is Why:
The charts are full of distraction, disturbance and are a graveyard of fear and greed which shall not cloud our judgement on the current state of affairs in the TESLA pair price action which suggests a high likelihood of a coming move down.
Disclosure: I am part of Trade Nation's Influencer program and receive a monthly fee for using their TradingView charts in my analysis.
❤️ Please, support our work with like & comment! ❤️
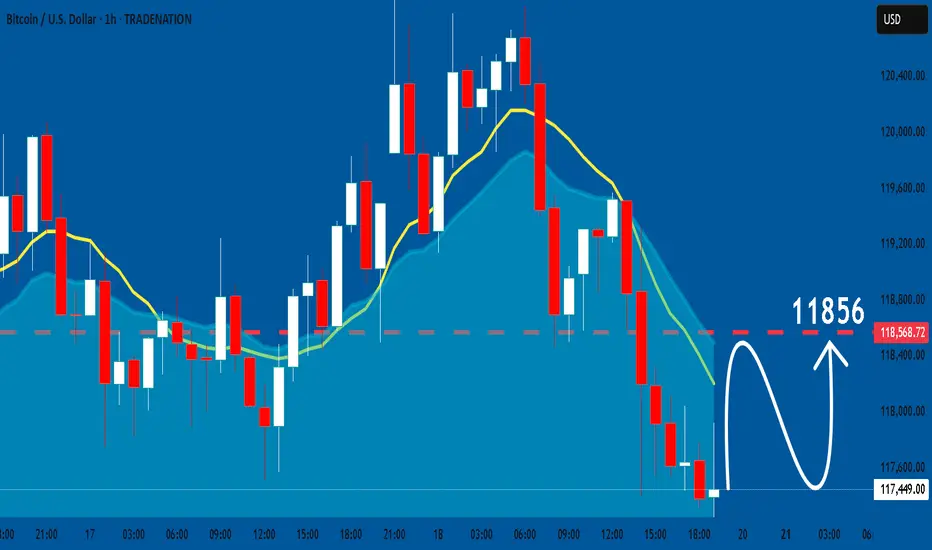
BTCUSD: Bullish Continuation
Looking at the chart of BTCUSD right now we are seeing some interesting price action on the lower timeframes. Thus a local move up seems to be quite likely.
Disclosure: I am part of Trade Nation's Influencer program and receive a monthly fee for using their TradingView charts in my analysis.
❤️ Please, support our work with like & comment! ❤️
Polish zloty in trouble: Swiss franc is sharpening its teethTechnically, CHFPLN has completed a consolidation phase within a narrowing triangle and broke to the upside. The pair is now testing the 4.60 level (the 0.618 Fibonacci retracement) from below — a decisive zone. A breakout and confirmation above this area opens the path toward 4.705, which coincides with the 0.5 Fibo level and a local resistance. A pullback from that zone back to 4.60 is possible, but this time as a support retest. If the level holds, the targets remain: 4.91 and 5.13 - both marked by Fibonacci extensions and major long-term horizontal resistance. The EMAs are aligned in support of further upside, with price consistently trading above them.
Fundamentally, the Swiss franc remains a safe-haven currency, especially amidst increasing instability in the Eurozone. Weak growth in Germany, looming ECB policy easing, and rising inflationary pressures are all tilting investor interest toward CHF. Meanwhile, Poland faces political uncertainty, budgetary debates, and volatility in the agricultural and energy sectors. All of this strengthens the case for the franc in this pair.
Tactically, the game plan is straightforward: a confirmed breakout above 4.60 signals the start of a bullish impulse. The 4.60–4.705 zone is the key area of interest for buyers. If this zone is reclaimed and held, the next targets - 4.91 and 5.13 - remain valid, where large players may look to take profits.
If this scenario plays out, the zloty may soon be tuning into Polish radio to sing nostalgic songs about the golden days of its strength.

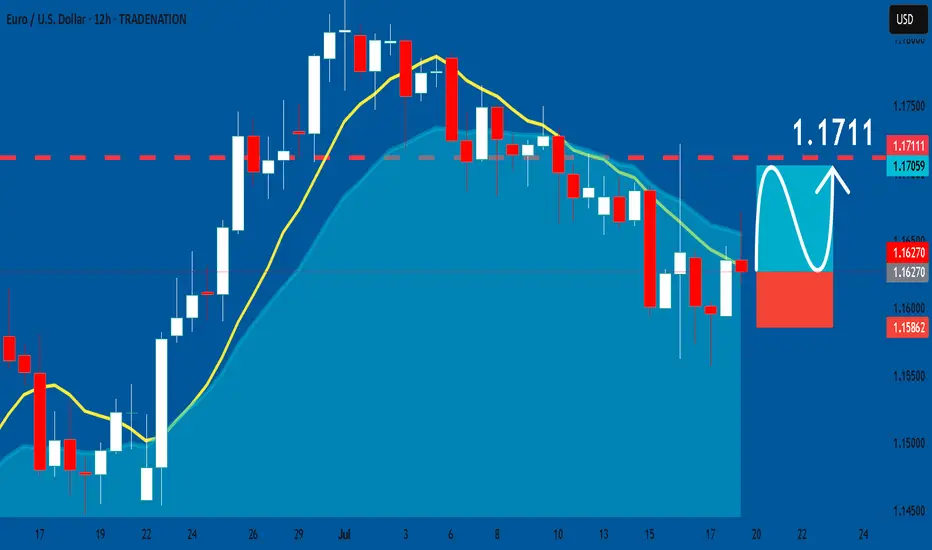
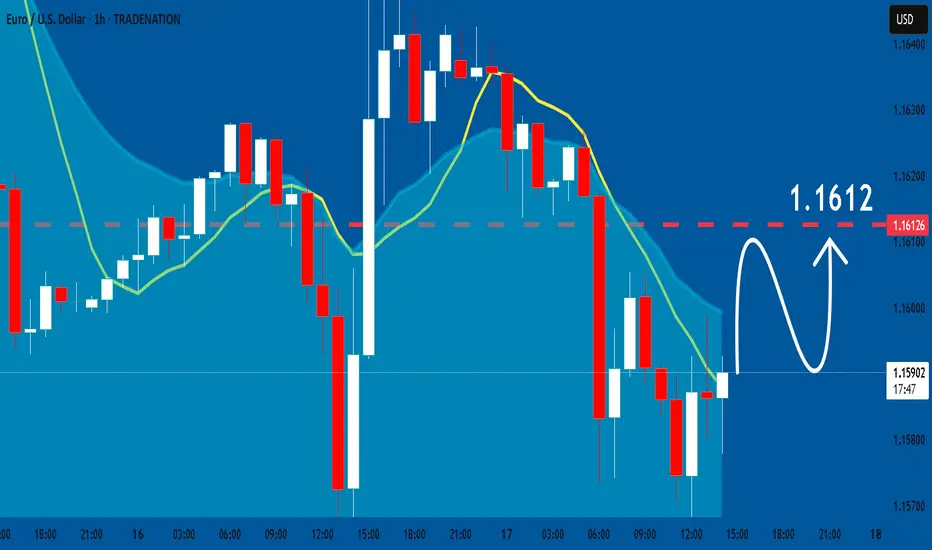
EURUSD: Long Trade with Entry/SL/TP
EURUSD
- Classic bullish setup
- Our team expects bullish continuation
SUGGESTED TRADE:
Swing Trade
Long EURUSD
Entry Point - 1.1627
Stop Loss - 1.1586
Take Profit - 1.1711
Our Risk - 1%
Start protection of your profits from lower levels
Disclosure: I am part of Trade Nation's Influencer program and receive a monthly fee for using their TradingView charts in my analysis.
❤️ Please, support our work with like & comment! ❤️
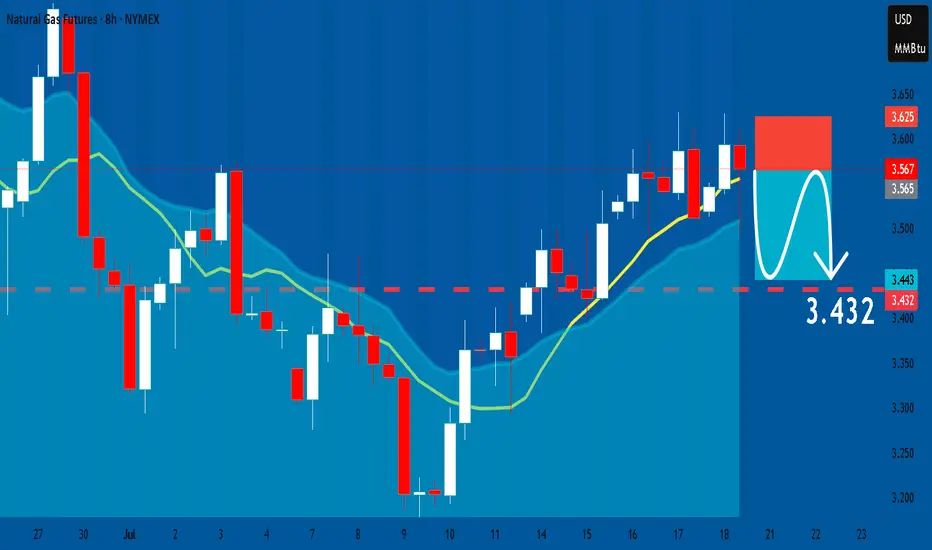
NATGAS: Bearish Continuation & Short Signal
NATGAS
- Classic bearish formation
- Our team expects fall
SUGGESTED TRADE:
Swing Trade
Sell NATGAS
Entry Level - 3.567
Sl - 3.625
Tp - 3.432
Our Risk - 1%
Start protection of your profits from lower levels
Disclosure: I am part of Trade Nation's Influencer program and receive a monthly fee for using their TradingView charts in my analysis.
❤️ Please, support our work with like & comment! ❤️
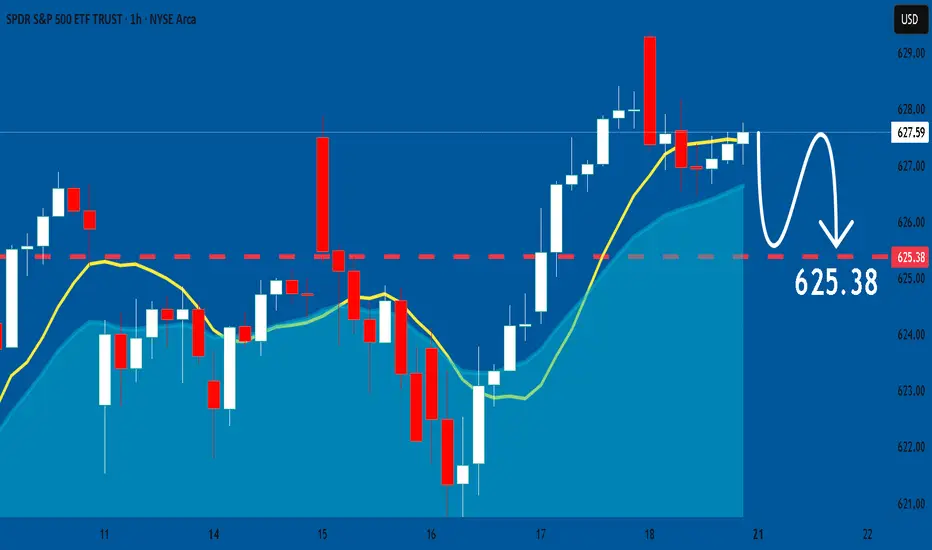
SPY: Market of Sellers
Our strategy, polished by years of trial and error has helped us identify what seems to be a great trading opportunity and we are here to share it with you as the time is ripe for us to sell SPY.
Disclosure: I am part of Trade Nation's Influencer program and receive a monthly fee for using their TradingView charts in my analysis.
❤️ Please, support our work with like & comment! ❤️
GBPJPY: Short Trading Opportunity
GBPJPY
- Classic bearish formation
- Our team expects pullback
SUGGESTED TRADE:
Swing Trade
Short GBPJPY
Entry - 199.63
Sl - 200.26
Tp - 198.44
Our Risk - 1%
Start protection of your profits from lower levels
Disclosure: I am part of Trade Nation's Influencer program and receive a monthly fee for using their TradingView charts in my analysis.
❤️ Please, support our work with like & comment! ❤️

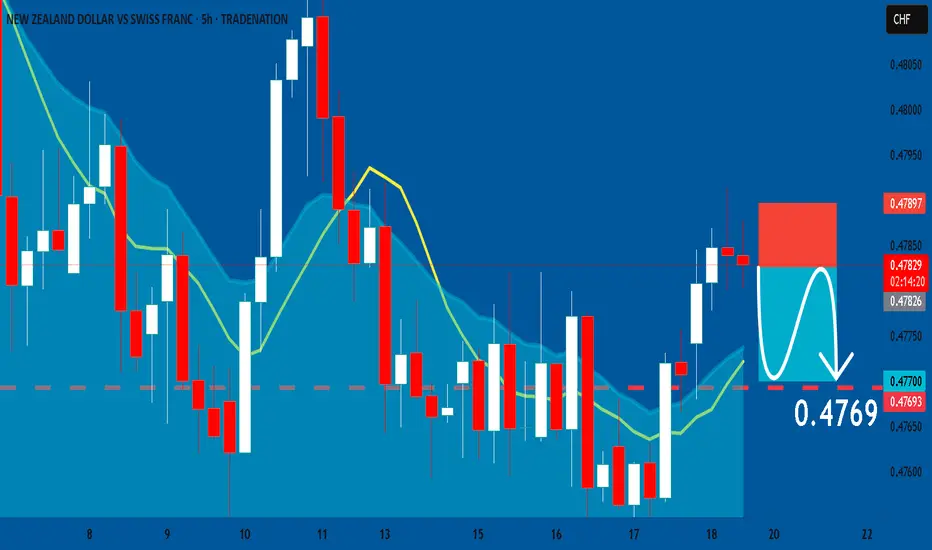
NZDCHF: Will Keep Falling! Here is Why:
The recent price action on the NZDCHF pair was keeping me on the fence, however, my bias is slowly but surely changing into the bearish one and I think we will see the price go down.
Disclosure: I am part of Trade Nation's Influencer program and receive a monthly fee for using their TradingView charts in my analysis.
❤️ Please, support our work with like & comment! ❤️
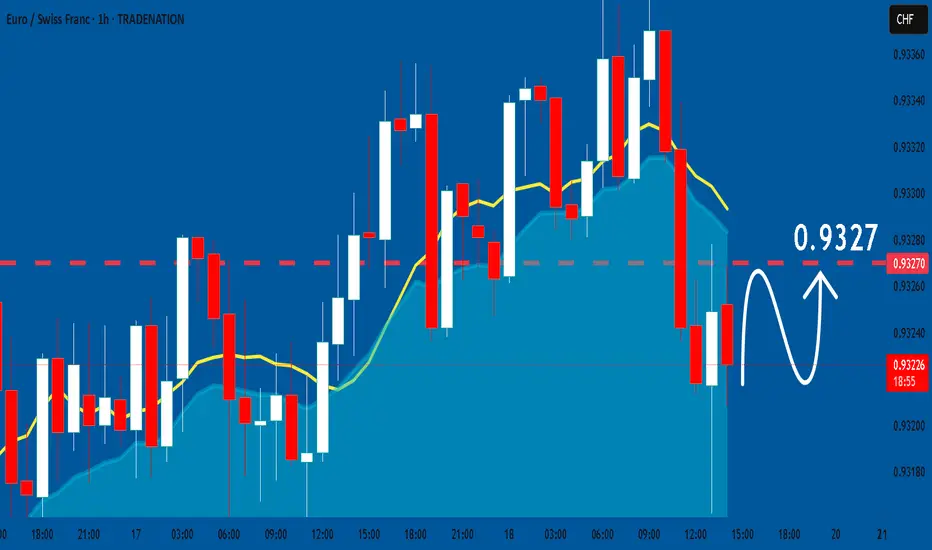
EURCHF: Bullish Continuation is Highly Probable! Here is Why:
Remember that we can not, and should not impose our will on the market but rather listen to its whims and make profit by following it. And thus shall be done today on the EURCHF pair which is likely to be pushed up by the bulls so we will buy!
Disclosure: I am part of Trade Nation's Influencer program and receive a monthly fee for using their TradingView charts in my analysis.
❤️ Please, support our work with like & comment! ❤️
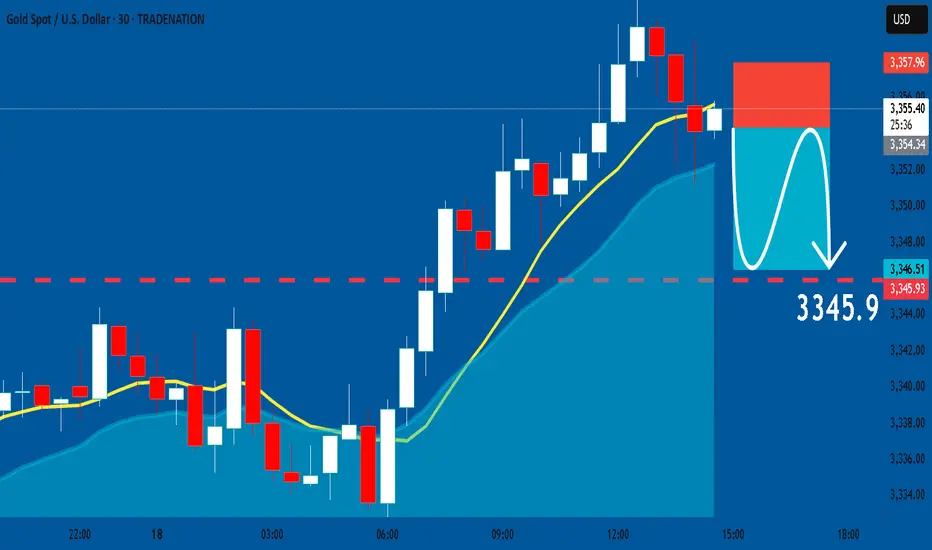
GOLD: Short Trade Explained
GOLD
- Classic bearish pattern
- Our team expects retracement
SUGGESTED TRADE:
Swing Trade
Sell GOLD
Entry - 3354.53
Stop - 3357.9
Take - 3345.9
Our Risk - 1%
Start protection of your profits from lower levels
Disclosure: I am part of Trade Nation's Influencer program and receive a monthly fee for using their TradingView charts in my analysis.
❤️ Please, support our work with like & comment! ❤️
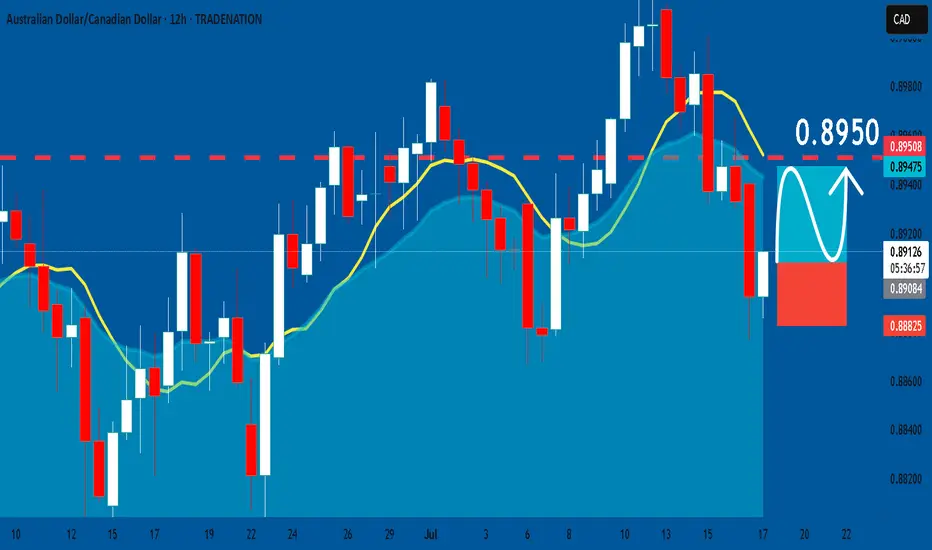
AUDCAD: Long Signal Explained
AUDCAD
- Classic bullish formation
- Our team expects pullback
SUGGESTED TRADE:
Swing Trade
Long AUDCAD
Entry - 0.8908
Sl - 0.8882
Tp - 0.8950
Our Risk - 1%
Start protection of your profits from lower levels
Disclosure: I am part of Trade Nation's Influencer program and receive a monthly fee for using their TradingView charts in my analysis.
❤️ Please, support our work with like & comment! ❤️
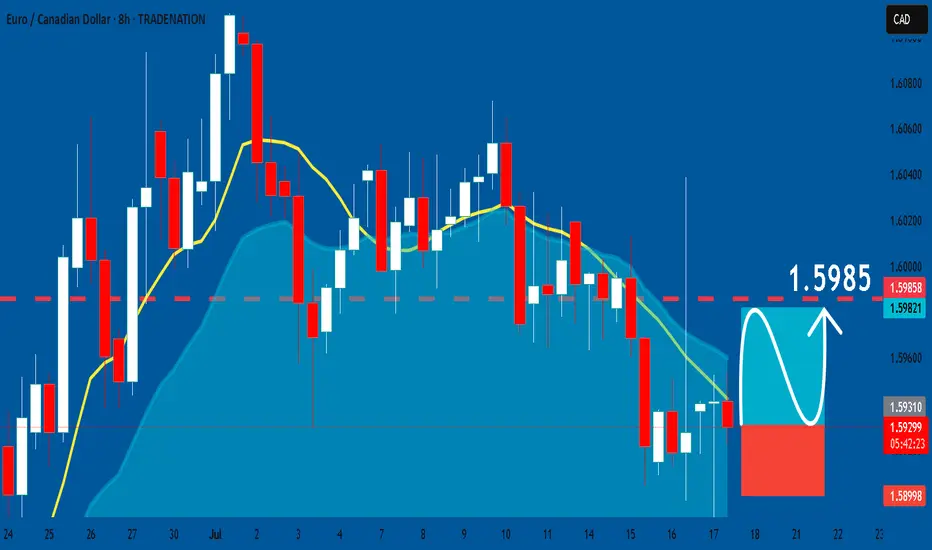
EURCAD: Long Signal with Entry/SL/TP
EURCAD
- Classic bullish pattern
- Our team expects retracement
SUGGESTED TRADE:
Swing Trade
Buy EURCAD
Entry - 1.5929
Stop - 1.5899
Take - 1.5985
Our Risk - 1%
Start protection of your profits from lower levels
Disclosure: I am part of Trade Nation's Influencer program and receive a monthly fee for using their TradingView charts in my analysis.
❤️ Please, support our work with like & comment! ❤️
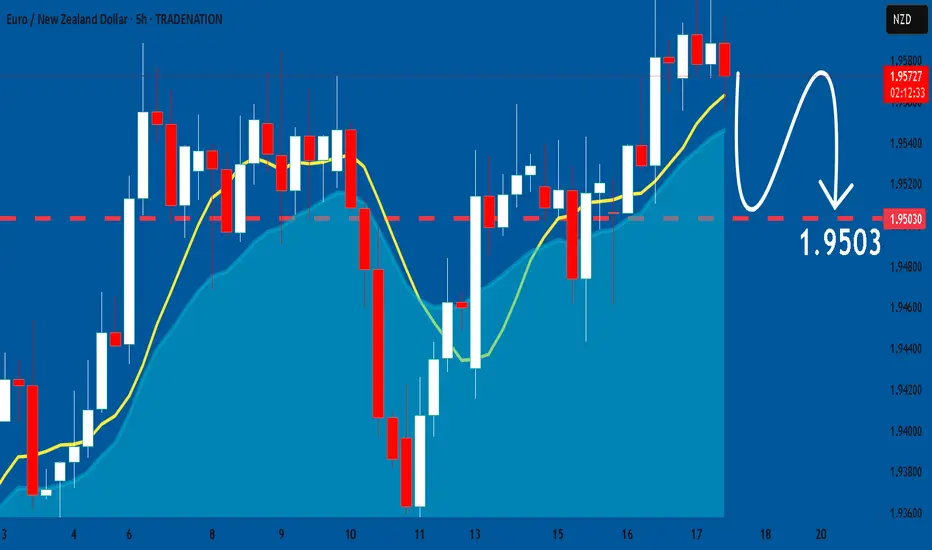
EURNZD: Bearish Forecast & Bearish Scenario
The analysis of the EURNZD chart clearly shows us that the pair is finally about to tank due to the rising pressure from the sellers.
Disclosure: I am part of Trade Nation's Influencer program and receive a monthly fee for using their TradingView charts in my analysis.
❤️ Please, support our work with like & comment! ❤️
EURUSD: Bulls Will Push
Balance of buyers and sellers on the EURUSD pair, that is best felt when all the timeframes are analyzed properly is shifting in favor of the buyers, therefore is it only natural that we go long on the pair.
Disclosure: I am part of Trade Nation's Influencer program and receive a monthly fee for using their TradingView charts in my analysis.
❤️ Please, support our work with like & comment! ❤️
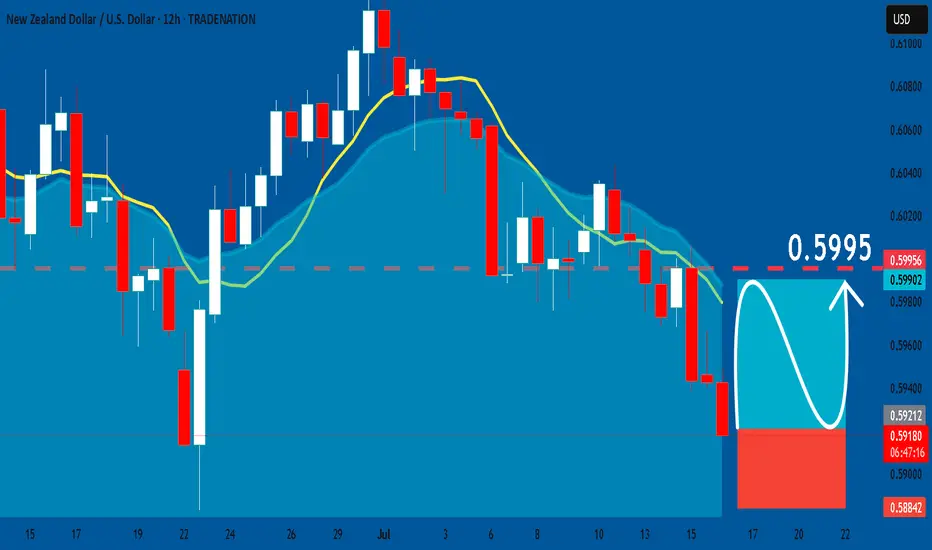
NZDUSD: Bullish Continuation & Long Signal
NZDUSD
- Classic bullish setup
- Our team expects bullish continuation
SUGGESTED TRADE:
Swing Trade
Long NZDUSD
Entry Point - 0.5922
Stop Loss - 0.5884
Take Profit - 0.5995
Our Risk - 1%
Start protection of your profits from lower levels
Disclosure: I am part of Trade Nation's Influencer program and receive a monthly fee for using their TradingView charts in my analysis.
❤️ Please, support our work with like & comment! ❤️
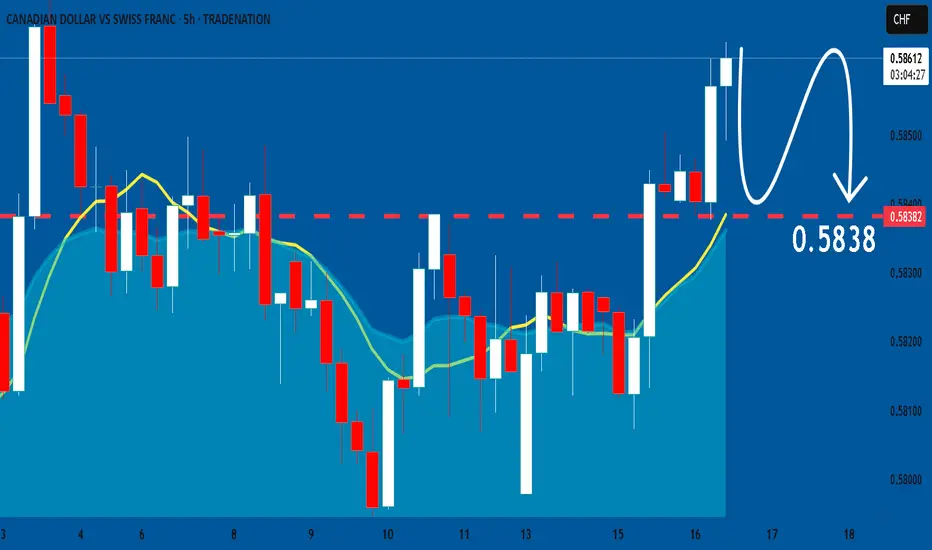
CADCHF: Bearish Continuation
Looking at the chart of CADCHF right now we are seeing some interesting price action on the lower timeframes. Thus a local move down seems to be quite likely.
Disclosure: I am part of Trade Nation's Influencer program and receive a monthly fee for using their TradingView charts in my analysis.
❤️ Please, support our work with like & comment! ❤️
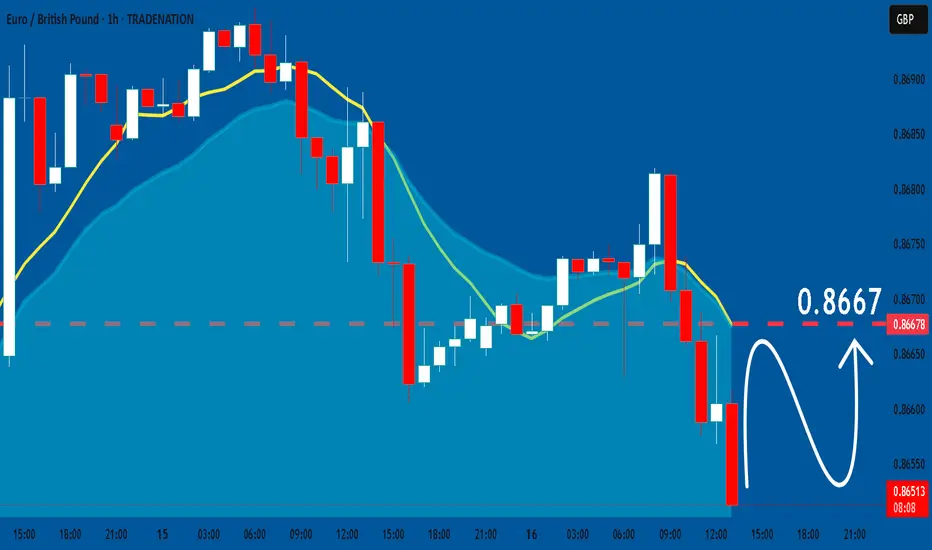
EURGBP: Expecting Bullish Movement! Here is Why:
The charts are full of distraction, disturbance and are a graveyard of fear and greed which shall not cloud our judgement on the current state of affairs in the EURGBP pair price action which suggests a high likelihood of a coming move up.
Disclosure: I am part of Trade Nation's Influencer program and receive a monthly fee for using their TradingView charts in my analysis.
❤️ Please, support our work with like & comment! ❤️