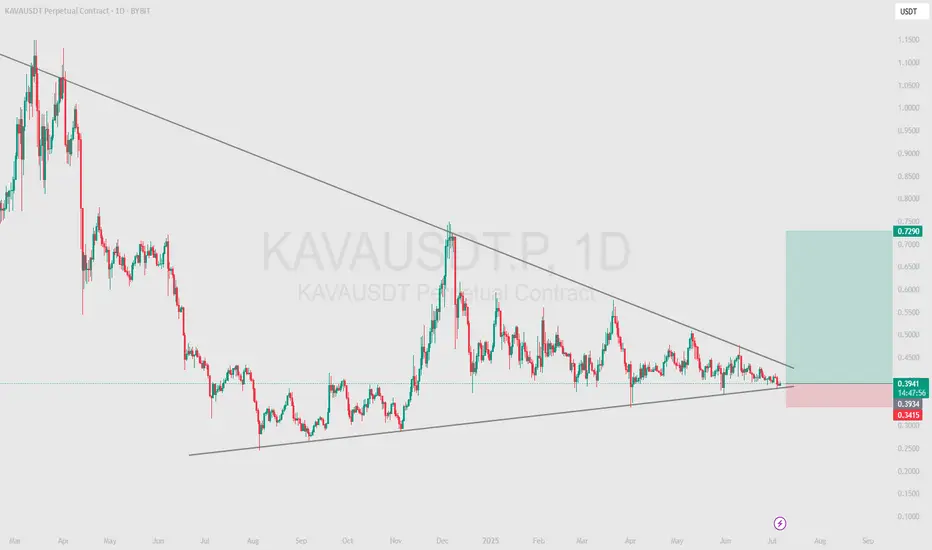
KAVA - We are expecting the rocket at 80%The KAVAUSDT chart shows a clear downward channel, indicating a bearish trend. However, the price is currently consolidating around the middle of the channel, creating uncertainty about the immediate direction.
Recommended signal: wait for confirmation of a breakout above the upper boundary for longs or a breakout below the lower boundary for shorts.
Prediction
AXS - We are on support, next rocket 180%At the moment, the price is in the testing zone of the lower boundary of the descending channel. This is a critical level that will determine the further direction of movement. If the price bounces off the support, we can expect an upward correction. If the price breaks through the support, we should expect a further fall.
Recommended signal: Waiting for confirmation of the breakout of the lower boundary of the channel to enter shorts or a rebound from support to enter longs.
Price range forecast for the next 3 days: 1.50–2.30 USDT.

MANA - move in support and then shoot at 150%Price Prediction:
Short Term (1-3 Days):
The price may continue to move within the falling wedge, maintaining a downward trajectory. However, there is a high probability of testing the lower boundary of the wedge ($0.1900 USDT).
If the price holds above $0.1900 USDT, this could signal a corrective rally toward the $0.2750 USDT level.
Medium Term (1-2 Weeks):
If the price successfully tests the lower boundary of the wedge and rebounds upward, this could lead to a reversal of the pattern and the start of an uptrend.
The target levels after a wedge breakout would be $0.3863 USDT (previous local high).
In case of an unsuccessful test of support ($0.1889 USDT), the price may continue to decline toward deeper support levels (e.g., $0.1500 USDT).
Long Term (1 Month+):
If there is a successful reversal of the falling wedge pattern, this could mark the beginning of a sustained recovery. Target levels could extend beyond $0.3863 USDT, such as $0.5000 USDT or higher.
However, if the downtrend continues without reversal, long-term targets could be significantly below current levels.
Trading Recommendations:
Long (Buy):
Entry: After a successful test of the lower boundary of the wedge ($0.1900 USDT) and a subsequent bounce upward.
Take-Profit: $0.2750 USDT → $0.3863 USDT → $0.5000 USDT.
Stop-Loss: Below $0.1889 USDT (to protect against further declines).
Short (Sell):
Entry: If the price fails to break above the upper boundary of the wedge ($0.2750 USDT) and begins to decline.
Take-Profit: $0.1900 USDT → $0.1500 USDT.
Stop-Loss: Above $0.2750 USDT (to protect against a bullish reversal).
Conclusion:
At the moment, the asset MANA is in a downtrend, forming a falling wedge. This creates potential for both a corrective rally and a continuation of the decline. The key event will be the test of the lower boundary of the wedge ($0.1900 USDT). A successful test could lead to a reversal of the pattern and the start of an uptrend, while an unsuccessful test could strengthen the downtrend.

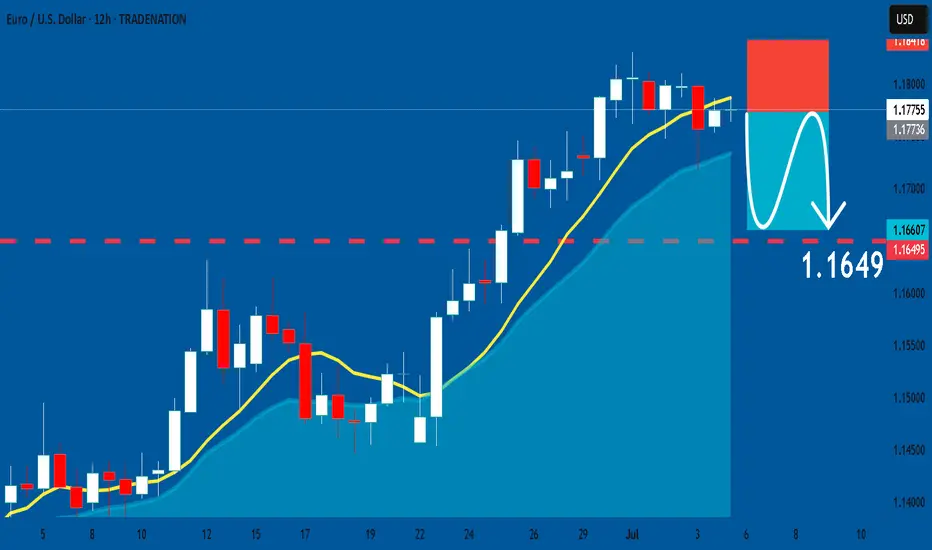
EURUSD: Short Signal Explained
EURUSD
- Classic bearish formation
- Our team expects fall
SUGGESTED TRADE:
Swing Trade
Sell EURUSD
Entry Level - 1.1775
Sl - 1.1841
Tp - 1.1649
Our Risk - 1%
Start protection of your profits from lower levels
Disclosure: I am part of Trade Nation's Influencer program and receive a monthly fee for using their TradingView charts in my analysis.
❤️ Please, support our work with like & comment! ❤️
APPLE: Short Trade with Entry/SL/TP
APPLE
- Classic bearish formation
- Our team expects pullback
SUGGESTED TRADE:
Swing Trade
Short APPLE
Entry - 213.58
Sl - 217.99
Tp - 204.49
Our Risk - 1%
Start protection of your profits from lower levels
Disclosure: I am part of Trade Nation's Influencer program and receive a monthly fee for using their TradingView charts in my analysis.
❤️ Please, support our work with like & comment! ❤️

QQQ: Expecting Bearish Movement! Here is Why:
The price of QQQ will most likely collapse soon enough, due to the supply beginning to exceed demand which we can see by looking at the chart of the pair.
Disclosure: I am part of Trade Nation's Influencer program and receive a monthly fee for using their TradingView charts in my analysis.
❤️ Please, support our work with like & comment! ❤️

TESLA: Bulls Will Push
The price of TESLA will most likely increase soon enough, due to the demand beginning to exceed supply which we can see by looking at the chart of the pair.
Disclosure: I am part of Trade Nation's Influencer program and receive a monthly fee for using their TradingView charts in my analysis.
❤️ Please, support our work with like & comment! ❤️

USDCAD: Long Signal with Entry/SL/TP
USDCAD
- Classic bullish formation
- Our team expects growth
SUGGESTED TRADE:
Swing Trade
Buy USDCAD
Entry Level - 1.3605
Sl - 1.3575
Tp - 1.3668
Our Risk - 1%
Start protection of your profits from lower levels
Disclosure: I am part of Trade Nation's Influencer program and receive a monthly fee for using their TradingView charts in my analysis.
❤️ Please, support our work with like & comment! ❤️

NZDCAD: Market of Buyers
Our strategy, polished by years of trial and error has helped us identify what seems to be a great trading opportunity and we are here to share it with you as the time is ripe for us to buy NZDCAD.
Disclosure: I am part of Trade Nation's Influencer program and receive a monthly fee for using their TradingView charts in my analysis.
❤️ Please, support our work with like & comment! ❤️

AUDUSD: Bullish Continuation is Expected! Here is Why:
The recent price action on the AUDUSD pair was keeping me on the fence, however, my bias is slowly but surely changing into the bullish one and I think we will see the price go up.
Disclosure: I am part of Trade Nation's Influencer program and receive a monthly fee for using their TradingView charts in my analysis.
❤️ Please, support our work with like & comment! ❤️

GOLD: Bearish Continuation & Short Signal
GOLD
- Classic bearish pattern
- Our team expects retracement
SUGGESTED TRADE:
Swing Trade
Sell GOLD
Entry - 3335.9
Stop - 3338.8
Take - 3330.1
Our Risk - 1%
Start protection of your profits from lower levels
Disclosure: I am part of Trade Nation's Influencer program and receive a monthly fee for using their TradingView charts in my analysis.
❤️ Please, support our work with like & comment! ❤️

Weekly Volatility SnapshotGood Morning -- ☀️☀️☀️
What an amazing last full week of June that was as we pulled out of corrective territory and onto new ATHs with the SP:SPX body of its weekly candle moving +3.41% -- bottom to top. The weekly move open-to-close was +$98.40 as that is how I gauge my volatility metrics. This in comparison is closest in value to IV entering the week as it was stating an implied move of +/-$102.08, which was a volatility read of 16.34% -- As you see in reflection of the weekly chart below and within daily candle structure, price action moved upwards all week surpassing quarterly marks. This in turn is raising short-term volatility and lowering monthly averages as we rotate higher.
Here is the weekly price action of the TVC:VIX from a 5m perspective. This is showing the EOW trend break upwards drilling the indices back down -- A healthy pullback after being seemingly over-extended. This happened during the news cycle release of the U.S. and Canada reciprocal tariff disagreement. Hopefully this settles over the weekend and we rotate higher into the 4th of July week.
Now looking towards this holiday week -- We have the SP:SPX IV (13.29%) after melting during the ATHs move previously -3.09% -- This places IV on the sliding yearly spectrum at the 39% down range showing increasing discount in yearly value. Remember, If you form option positions IV affects VEGA 1% at a time and the algos bid down IV in contracting markets as they rotate higher. HV10 (12.46%) has hinged down and still is contractive per IV prediction but, increasing in comparison with a ' strength of IV ' now showing 94% entering this week.
As the TVC:VIX has closed at $16.32 -- I believe that there is still a little room to extend potentially upwards to the HV10 weekly range of $6253.59. Currently, the SP:SPX YTD return is +4.96% with weekly momentum pointing up and room for volatility to still decrease. If this mark is reached it would put the YTD return at +6.52%. Very feasible and realistic being halfway through the year and going into the 4th of July 🇺🇸🇺🇸🇺🇸🇺🇸 Watch as we climb the wall of worries around us. This would in turn decrease short-term volatility more maybe even to a bottoming point and IV would melt during the rotation upwards with the VIX slowly grinding down.
Come back next week as we review what happened within the implied ranges posted and overlook the volatility potentially bottoming and looking towards a VIX spike in the near future.
Remember to know your ABCs and stay hedged against your bias! CHEERS!

RSKD - breakout confirmed, now waiting for retestRiskified (RSKD) shows a textbook breakout setup: daily triangle plus 4H bullish flag. Price already broke out and is now retesting the 0.618 Fibonacci retracement at $5.21, which also matches the flag resistance flip and EMA cluster. This is a clean buy zone with strong technical alignment.
Volume spiked during the breakout, trend structure remains intact, and moving averages are converging — usually a precursor to strong moves. The current pullback is orderly, and if buyers show strength on this retest, the price could target $6.00, then $6.54, and potentially $7.25 (1.618 extension).
Fundamentally, Riskified offers fraud prevention tech for e-commerce. The business is benefiting from global growth in online transactions and improved margin control. While still unprofitable, recent quarters showed progress toward positive operating leverage and strong client acquisition.
Tactical plan:
— Entry on confirmation from $5.21 retest
— TP1: $6.00
— TP2: $6.54
— TP3: $7.25
— SL: below $4.90 or $4.43 support zone
You’ve been watching this one. The triangle broke. The pullback is clean. Maybe it’s time to stop watching and start participating.

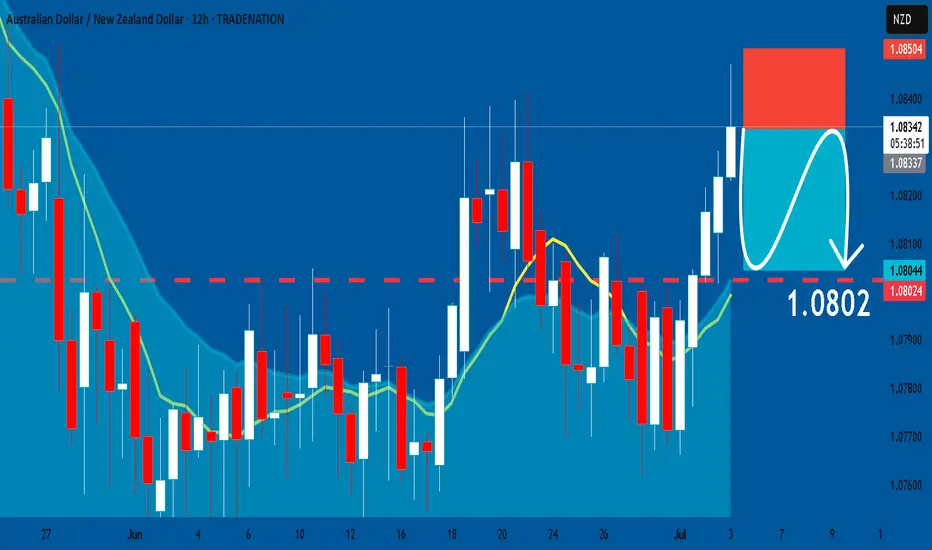
AUDNZD: Short Trading Opportunity
AUDNZD
- Classic bearish setup
- Our team expects bearish continuation
SUGGESTED TRADE:
Swing Trade
Short AUDNZD
Entry Point - 1.0834
Stop Loss - 1.0850
Take Profit - 1.0802
Our Risk - 1%
Start protection of your profits from lower levels
Disclosure: I am part of Trade Nation's Influencer program and receive a monthly fee for using their TradingView charts in my analysis.
❤️ Please, support our work with like & comment! ❤️
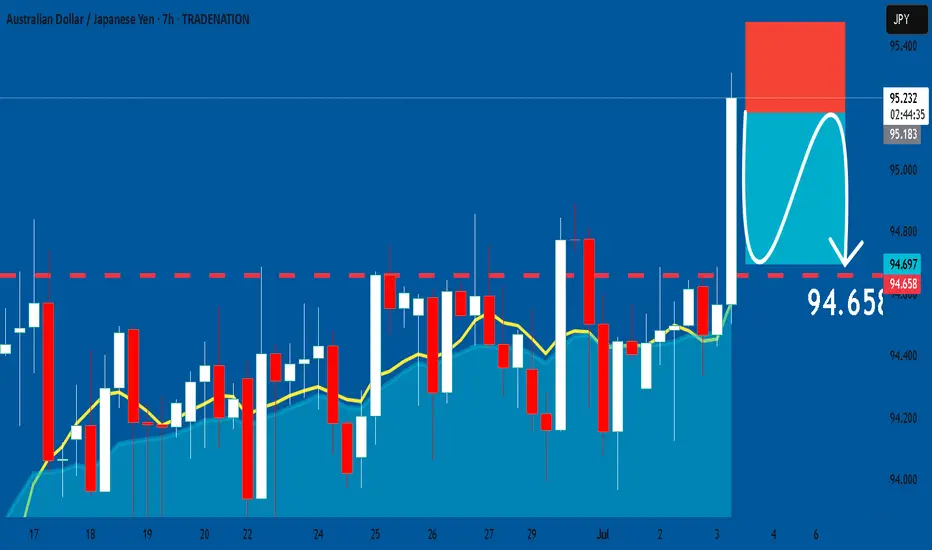
AUDJPY: Short Trade Explained
AUDJPY
- Classic bearish formation
- Our team expects fall
SUGGESTED TRADE:
Swing Trade
Sell AUDJPY
Entry Level - 95.193
Sl - 95.477
Tp - 94.658
Our Risk - 1%
Start protection of your profits from lower levels
Disclosure: I am part of Trade Nation's Influencer program and receive a monthly fee for using their TradingView charts in my analysis.
❤️ Please, support our work with like & comment! ❤️
GBPAUD: Growth & Bullish Continuation
It is essential that we apply multitimeframe technical analysis and there is no better example of why that is the case than the current GBPAUD chart which, if analyzed properly, clearly points in the upward direction.
Disclosure: I am part of Trade Nation's Influencer program and receive a monthly fee for using their TradingView charts in my analysis.
❤️ Please, support our work with like & comment! ❤️

GOLD 4H: structure broken - phase reversal beginsTwo key directional signals were recorded on the gold chart: first, a breakdown of the ascending channel, followed by a confident downward exit from the triangle with a clear fixation under the $3297 boundary. Both figures worked independently, but consistently - and strengthened the impulse towards selling.
The price has already gone beyond the lower boundary of the triangle ($3297), confirming the bearish scenario. Candlesticks closing under the level and local consolidation from below is a characteristic formation before the momentum continues.
Technical parameters:
- Channel breakout: completed
- Triangle breakout: $3297 level
- Retest from below: expected as confirmation
- EMAs reversed downwards, structure broken
- Volumes strengthened at the moment of breakout
Tactical plan:
- Sell after retest of $3297
- Targets on the move: $3248 and $3201
- Stop: above $3305 (above the area of false outs).
The current structure indicates the end of the accumulation phase and the beginning of the downward momentum. As long as the price holds below $3297 - shorts are the priority.

AUDCAD: Bearish Continuation & Short Trade
AUDCAD
- Classic bearish formation
- Our team expects pullback
SUGGESTED TRADE:
Swing Trade
Short AUDCAD
Entry - 0.8947
Sl - 0.8974
Tp - 0.8903
Our Risk - 1%
Start protection of your profits from lower levels
Disclosure: I am part of Trade Nation's Influencer program and receive a monthly fee for using their TradingView charts in my analysis.
❤️ Please, support our work with like & comment! ❤️

EURGBP: Weak Market & Bearish Forecast
Our strategy, polished by years of trial and error has helped us identify what seems to be a great trading opportunity and we are here to share it with you as the time is ripe for us to sell EURGBP.
Disclosure: I am part of Trade Nation's Influencer program and receive a monthly fee for using their TradingView charts in my analysis.
❤️ Please, support our work with like & comment! ❤️

AUDUSD: Will Start Growing! Here is Why:
Looking at the chart of AUDUSD right now we are seeing some interesting price action on the lower timeframes. Thus a local move up seems to be quite likely.
Disclosure: I am part of Trade Nation's Influencer program and receive a monthly fee for using their TradingView charts in my analysis.
❤️ Please, support our work with like & comment! ❤️

GOLD: Short Signal with Entry/SL/TP
GOLD
- Classic bearish pattern
- Our team expects retracement
SUGGESTED TRADE:
Swing Trade
Sell GOLD
Entry - 3349.3
Stop - 3353.5
Take - 3339.9
Our Risk - 1%
Start protection of your profits from lower levels
Disclosure: I am part of Trade Nation's Influencer program and receive a monthly fee for using their TradingView charts in my analysis.
❤️ Please, support our work with like & comment! ❤️

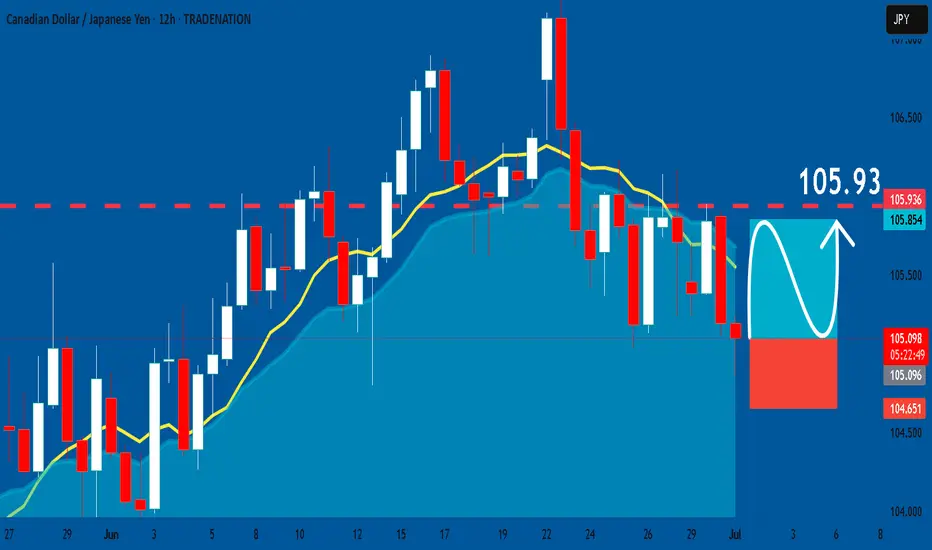
CADJPY: Bullish Continuation & Long Signal
CADJPY
- Classic bullish formation
- Our team expects pullback
SUGGESTED TRADE:
Swing Trade
Long CADJPY
Entry - 105.09
Sl - 104.65
Tp - 105.93
Our Risk - 1%
Start protection of your profits from lower levels
Disclosure: I am part of Trade Nation's Influencer program and receive a monthly fee for using their TradingView charts in my analysis.
❤️ Please, support our work with like & comment! ❤️
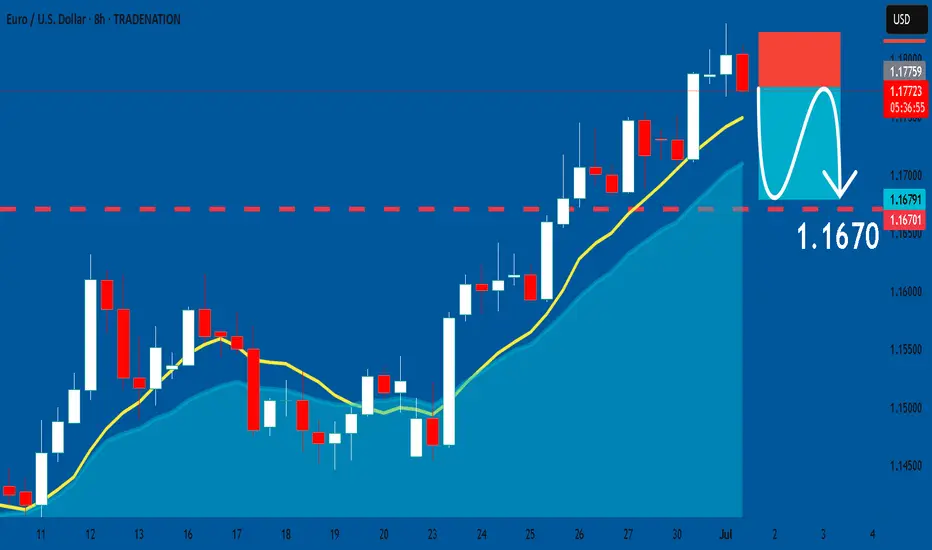
EURUSD: Short Signal Explained
EURUSD
- Classic bearish setup
- Our team expects bearish continuation
SUGGESTED TRADE:
Swing Trade
Short EURUSD
Entry Point - 1.1775
Stop Loss - 1.1822
Take Profit - 1.1670
Our Risk - 1%
Start protection of your profits from lower levels
Disclosure: I am part of Trade Nation's Influencer program and receive a monthly fee for using their TradingView charts in my analysis.
❤️ Please, support our work with like & comment! ❤️