AUDCAD: Long Signal with Entry/SL/TP
AUDCAD
- Classic bullish pattern
- Our team expects retracement
SUGGESTED TRADE:
Swing Trade
Buy AUDCAD
Entry - 0.8836
Stop -0.8817
Take - 0.8871
Our Risk - 1%
Start protection of your profits from lower levels
Disclosure: I am part of Trade Nation's Influencer program and receive a monthly fee for using their TradingView charts in my analysis.
❤️ Please, support our work with like & comment! ❤️
Predictions

At this point market successfully taped into the!Gold Market Analysis – Bullish Momentum Building
Gold has recently broken through a significant call option (CE) resistance level, signaling heightened bullish aggression among market participants. This breakout suggests that buyers are currently in control, pushing prices decisively above the CE threshold.
At this point, the market has successfully tapped into the previous swing low liquidity and appears to be forming buy-side liquidity above the current price action. With this structure, we anticipate a potential move toward the Fair Value Gap (FVG) zone marked on the chart. A clean breakout above this FVG, followed by a retest and successful hold of that level, would serve as a strong confirmation of continued bullish intent.
Should this scenario play out, our next upside targets lie in the 3320–3330 range. Traders are advised to monitor price action closely and wait for confirmation signals before making entries. Strategic decision-making is key—avoid emotional trading and prioritize high-probability setups.
Disclaimer: This analysis is for educational and informational purposes only and does not constitute financial advice. Always conduct your own research (DYOR) before making any investment decisions.

USOIL: Expecting Bearish Movement! Here is Why:
The charts are full of distraction, disturbance and are a graveyard of fear and greed which shall not cloud our judgement on the current state of affairs in the USOIL pair price action which suggests a high likelihood of a coming move down.
Disclosure: I am part of Trade Nation's Influencer program and receive a monthly fee for using their TradingView charts in my analysis.
❤️ Please, support our work with like & comment! ❤️

GBPUSD: Bearish Continuation is Highly Probable! Here is Why:
The analysis of the GBPUSD chart clearly shows us that the pair is finally about to tank due to the rising pressure from the sellers.
Disclosure: I am part of Trade Nation's Influencer program and receive a monthly fee for using their TradingView charts in my analysis.
❤️ Please, support our work with like & comment! ❤️

We're looking for the market to revisit the support zoneWeekly Gold Analysis: XAUUSD
Gold is currently trading at its highest high, showcasing a strong bullish trend. Recent price action has formed a bullish pinbar candlestick pattern, indicating potential buying interest.
Key Support Zone:
- Daily timeframe support zone: $3192.70 - $2168.70
- 50% Fibonacci retracement level, adding confluence to the support zone
Trading Strategy:
1. Buy Setup: We're looking for the market to revisit the support zone ($3192.70 - $2168.70) for a potential buying opportunity.
2. Alternative Scenario: If the market doesn't revisit the support zone, we'll wait for consolidation at current prices and look for bullish signs before entering a long position.
Weekly Outlook:
We'll monitor gold's price action closely and provide updates on any developments. Stay tuned for our analysis and guidance on potential trading opportunities.
Key Levels to Watch:
- Support zone: $3192.70 - $2168.70
- Current price:
- Fibonacci levels: 50% retracement level
Let's see how gold performs this week!

CAD/JPY Bearish Setup Near Resistance – Rejection Incoming?📉 Trend Analysis:
The pair is in a downtrend, confirmed by the descending trendline.
Lower highs and lower lows indicate bearish momentum.
📌 Key Levels:
Resistance Zone (104.5 - 106.0): Marked in purple, this area has previously acted as support and is now a key resistance zone.
Support Area: Around 100.0 - 101.0, a psychological level where price may find demand.
📊 Trade Scenario:
Bearish Rejection Expected: Price is approaching the resistance zone and trendline confluence. If rejection occurs, a downward move towards 100.0 is likely.
Break Above? If price breaks above the resistance zone and trendline, bullish momentum could invalidate the bearish setup.
🔍 Conclusion:
Watching for rejection near 105.0-106.0 to confirm a short opportunity.
If rejection happens, next targets are 102.0 → 100.0.
A bullish breakout above 106.0 could shift momentum upwards.

XAU/USD Analysis: Bearish Pullback Towards $3,000 SupportXAU/USD (Gold Spot vs. U.S. Dollar) Technical Analysis - 1H Chart
1. Price Action & Trend Analysis
The market has been in a strong uptrend, characterized by higher highs and higher lows.
Recently, the price faced resistance near the $3,040 level, leading to a rejection.
A pullback is currently in progress, suggesting a possible retracement to a demand zone.
2. Key Levels
Resistance Zone (Supply Zone): Around $3,040 - $3,045 where price has been rejected multiple times.
Support Zone (Demand Zone): Around $3,000 - $3,005, a previous accumulation area.
Current Price: $3,023.695
3. Market Structure & Expected Move
The price tested the resistance zone, failed to break above, and is now reacting downward.
A bearish projection (as shown in the chart) suggests a potential move toward the $3,000 - $3,005 support zone.
If the price reaches this level and finds buying pressure, we could see a reversal or continuation of the uptrend.
4. Indicators & Confluence Factors
Support-Resistance Flip: The previous support at $3,000 could act as a strong support again.
Bearish Momentum: Short-term price action suggests sellers are gaining control after rejection at resistance.
Liquidity Zones: The highlighted purple zones represent institutional order blocks where significant buy/sell orders exist.
5. Trading Plan & Strategy
Bearish Scenario: If price breaks below $3,000, we could see further downside pressure.
Bullish Scenario: A bounce from $3,000 could provide buying opportunities for another attempt at breaking $3,040.
6. Conclusion
The market is currently retracing from resistance, and a short-term bearish move is expected toward $3,000.
Traders should watch for price reaction at $3,000 to determine if it holds as support or breaks for further downside.

Gold (XAU/USD) – Possible Reversal from Resistance XAU/USD (Gold Spot vs. U.S. Dollar) on the 1-day timeframe and shows an ascending channel with key price levels and technical annotations.
Key Observations:
Trend Direction:
The price has been in a strong uptrend since late 2024.
It is currently near the upper boundary of the ascending channel.
Liquidity & Market Structure:
INT.LQ (Internal Liquidity): This suggests an area where liquidity is expected to be taken before a potential move.
MB Unfilled (Market Balances Unfilled): These indicate inefficiencies in price movement that the market may revisit.
Projected Price Action:
The chart shows a potential short-term pullback from the upper boundary.
Expected retracement towards the "fair value range" around $2,800–$2,850.
If this scenario plays out, it would align with price rebalancing and a healthier uptrend continuation.
Key Levels:
Resistance: Around $3,050, which aligns with the upper trendline.
Support Zones: Around $2,950 and deeper at $2,800.
Potential Trading Strategy:
Bearish Case: If rejection occurs at $3,050, short opportunities could exist targeting $2,900–$2,850.
Bullish Case: If price retraces and finds strong support in the fair value range, it could resume its uptrend.

EUR/USD 4H Analysis – Bearish Reversal Toward Key Demand Zone📊 EUR/USD 4H Analysis – Bearish Reversal Setup
🔸 Market Structure:
The chart indicates a Change of Character (CHOCH) at the recent high, signaling a possible shift in trend from bullish to bearish. The buy stop liquidity appears to have been grabbed before the price reversed, suggesting smart money may be positioning for a sell-off.
🔸 Key Levels:
Resistance Zone: Near 1.0900, where liquidity was swept.
Support Zone: Marked in purple between 1.0450 - 1.0500, acting as a potential demand area.
🔸 Price Action Expectation:
A minor pullback or retest of the CHOCH zone before further downside.
A bearish continuation towards the 1.0500 demand zone, aligning with liquidity objectives.
🔸 Trading Plan:
Bearish Bias: Potential short opportunities if price confirms lower highs.
Invalidation: A sustained break above 1.0900 would negate the bearish thesis.
Target: 1.0500 zone for potential long-term buy interest.
📉 Conclusion: If the price respects the CHOCH level and fails to reclaim liquidity above, sellers could dominate, driving EUR/USD lower toward the 1.0500 liquidity pool.

Future DJT move prediction by the end of may(wave3)using Elliott wave+ fibs to draw the prediction, if DJT can hold the low now, and see an uptrend coming, then this is what i can see in the near future. please do correct me and offer your ideas, thanks

BTCUSD 8H: Trendline Pressure and Key Support Test🔥 BTCUSD 8H Deep Dive
1️⃣ Trendline Pressure: Bears controlling the market with a strong descending trendline.
2️⃣ Support Zone Strength: $77,500-$80,000 is a key demand area. Previous bounce shows buyers stepping in.
3️⃣ Liquidity Hunt? Price might sweep the support zone before reversal.
4️⃣ Volume Check Needed: Low volume = fakeout risk. High volume = potential breakout.
🎯 Targets
Bullish Breakout: $85,000-$87,500
Bearish Breakdown: $77,500-$75,000
📍 Eyes on next 8H close.

NZDJPY 4h chart analysis: Key levels Trends SetupThe NZDJPY pair is showing slight bullish momentum but the key level to watch is 86.000 A breakout above this level could signal further upside. while rejection could lead to retest of lower support levels, Stay alert and trade with cautions.

XAUUSD Analysis: Bearish Reversal with Potential for Liquidity📉 XAUUSD (Gold Spot vs USD) Analysis - 3H Chart
🌟 Shooting Star Pattern Detected: The market has formed a shooting star, a bearish reversal candlestick, signaling potential weakness at the top.
📍 Key Resistance Zone (Purple Box): Price action has been rejected from this area, showing strong selling pressure.
🔍 If Break Scenario: Should the price break below the 2,949 support zone (🔵), we can expect a bearish drop 📉 with potential liquidity grab before a pullback for a new all-time high (ATH) 🚀.
🧐 Market Sentiment: Bearish bias for now, but watch for a potential reversal after liquidity is swept.
✅ Trader's Tip: Wait for a clean break and retest before entering a short position. 🎯

BTC Major Pullback - Before Huge Upside PotentialI anticipate a significant retracement in Bitcoin over the next 12 to 24 months. If the price falls below $50,000, it may decline further to around $25,000, followed by a period of consolidation.
Renewed interest from new investors and institutional funds could ignite the next bull run.
What are your thoughts?

XAUUSD 4H Analysis: Rejection at Resistance – Drop to $2,850?📉 XAUUSD (Gold) 4H Analysis – March 5, 2025
Key Levels:
Resistance: Around $2,920 - $2,940 (price is testing this zone)
Support: Around $2,850 - $2,860 (marked as a demand zone)
Market Structure & Projection:
Gold is currently at a resistance level, which has previously acted as a strong supply zone.
The price is showing signs of rejection at resistance, indicating a potential bearish move.
The chart suggests a drop towards the $2,850 support level if price fails to break above resistance.
Indicators & Confluence:
200 EMA (Red Line): Located below the price, showing an overall bullish trend, but short-term correction is possible.
Bearish Structure: The recent push to resistance followed by rejection hints at a potential sell-off.
Liquidity Grab? If price briefly spikes above resistance and then reverses, a deeper drop could be confirmed.
Trading Bias & Strategy:
📉 Bearish Scenario: If rejection at resistance holds, price could head towards $2,850 support.
📈 Bullish Breakout?: If price breaks & closes above resistance with strong volume, upside continuation could be possible.
⚠ Watch for price action at resistance before taking trades. A breakout or rejection confirmation is key.
🔥 What’s Your Take? Bullish or Bearish? Let me know! 🚀📊

XAU/USD Weekly Outlook: Potential Pullback or Breakout?XAU/USD Weekly Chart Analysis 🏆📉📈
1️⃣ Current Price: $2,919.35
2️⃣ Key Observations:
Distribution on H4: Potential sign of a short-term reversal. 📉
Divergence: Suggests weakening momentum at the highs, increasing the probability of a pullback. ⚠️
Multiple Unfilled Mitigation Blocks (MB): Areas of interest where price may retrace for liquidity grabs. 🧐
Fair Volume Ranges: Notable levels around $2,700 - $2,500, where price might stabilize if a correction occurs. 🔄 3️⃣ Potential Scenarios:
If price breaks down from the H4 distribution, expect a retracement toward the nearest MB unfilled levels (~$2,700).
If bulls hold momentum, breaking above current resistance (~$3,000) could push prices into price discovery. 🚀
💡 Conclusion: Watch for price action around the unfilled MBs and fair volume ranges. A correction seems likely unless buyers step in aggressively.
🔥 Trade Wisely & Manage Risk! 🔥

GOLD BIAS CONFIRMED!GOLD BIAS CONFIRMED!
We're thrilled to report that our earlier GOLD bias, shared in our FREE market update, has played out with precision!
Gold prices have successfully broken through our target levels, validating our analysis. Missed the update?

Bitcoin Breakdown: Bearish Retest or Further Crash to $60K?Bitcoin (BTC/USD) Daily Chart Analysis 🧐📉
Key Observations:
Major Breakdown Below Support 🚨
BTC has broken below a key support zone around $85,000 (which also aligns with the 200 EMA at $85,602).
This signals further downside potential if price fails to reclaim this level.
Bearish Retest Expected 🔄
The price may attempt to retest the broken support (~$85,000–$90,000) before continuing downward.
If rejected, BTC could drop to lower demand zones.
Next Major Support: $70,000 & $60,000 Zones 📉
The chart suggests a downside move toward $70,000, with a final target around $59,932.
These levels have historical significance as support zones.
RSI Shows Oversold Conditions 📊
The RSI is at 24.86, which is deep into oversold territory.
This could mean a temporary relief bounce, but overall momentum remains bearish.
Possible Scenario 📍
If BTC fails to reclaim $85,000, expect a move down to $70,000–$60,000.
A reclaim of $90,000+ would invalidate the bearish structure, leading to another attempt at $100,000+.
Conclusion: Bears in Control! 🐻⚠️
The trend remains bearish unless BTC reclaims key resistance zones.
Short-term bounce possible, but lower targets remain valid unless $85,000–$90,000 is reclaimed.
🔥 Trade Smart! Use Risk Management! 🔥 Let me know if you need specific trade setups! 🚀

Gold (XAUUSD) 4H Analysis: Bearish Breakdown with Potential PullGold (XAUUSD) 4H Chart Analysis 📉✨
1️⃣ Price Action
Gold is in a downtrend, recently breaking below a key support zone (purple).
It is trading below the 200 EMA (2,841.953), confirming bearish sentiment.
A minor pullback to the broken support zone is expected before further downside.
2️⃣ Support & Resistance
Resistance Zone: Around 2,875 - 2,900 (previous supply area).
Immediate Support: 2,800 - 2,810 (highlighted demand zone).
3️⃣ RSI (Relative Strength Index) 📊
Oversold at 19.98 ⚠️ → This suggests a potential short-term bounce, but trend remains weak.
32.46 level is a key resistance on RSI; breaking above could signal a recovery.
4️⃣ Bearish Bias 📉
If price retests the broken support and rejects, we could see a drop towards 2,800.
RSI suggests possible relief before further downside.
Trading Outlook 🔥
✅ Bearish Scenario: Sell on a rejection of the broken support, targeting 2,800.
🚨 Bullish Case: If Gold reclaims 2,850+, it might retest the 200 EMA and higher levels.
Would you like an updated analysis if the price action changes? 🚀📊

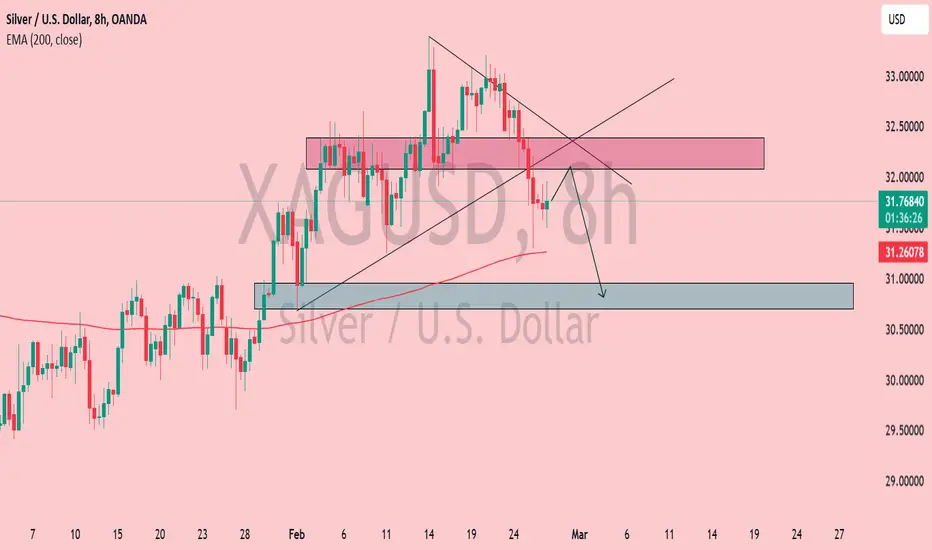
Silver (XAG/USD) Bearish Retest – Drop to $31 Incoming?Silver (XAG/USD) - 8H Chart Analysis
📉 Bearish Setup in Play
Breakout & Retest: Price broke down from a wedge pattern and is currently retesting the supply zone (highlighted in red).
EMA (200) Support: The 200 EMA (31.26) is acting as dynamic support. If price holds below, further downside is expected.
Bearish Target: A move towards the demand zone (30.80 - 31.00) (blue area) is anticipated.
Key Resistance: The rejected zone around 32.00 remains crucial for trend direction.
💡 Trade Idea:
If rejection is confirmed at the supply zone, short positions targeting 31.00 look promising.
A break above 32.00 could invalidate the bearish outlook.
🔥 Watch for confirmation! 🚀
XAU/USD Pullback or Reversal? Key Support Zone in Focus!📊 Gold (XAU/USD) Daily Chart Analysis – Feb 16, 2025
🔹 Current Price: $2,882.48 (-1.57%)
🔻 Recent High: $2,939.98
🔻 Recent Low: $2,877.03
🔴 200 EMA: $2,562.04 (Long-term support)
🧐 Key Observations:
✅ Strong Uptrend: Price has been in a bullish trend since late 2024.
✅ Support Zone: A key demand zone around $2,850 - $2,870 (highlighted in blue).
✅ Trendline Retest: The price is testing the trendline, which could act as support.
📉 Possible Scenarios:
🔹 Bullish Case: If buyers step in at the support zone, we could see a bounce towards $2,950 - $3,000 🚀.
🔹 Bearish Case: A breakdown below $2,850 may trigger a deeper pullback to $2,800 - $2,750 ❄️.
🎯 Trading Plan:
📌 Buy Setup: Look for bullish confirmation (e.g., reversal candles) in the support zone before entering long.
📌 Sell Setup: If the price closes below $2,850, short positions could be considered with targets near $2,750.
🔥 Final Thoughts: Despite today’s pullback, gold remains bullish unless key support levels break. Watching price action around the blue zone will be crucial!
📢 Traders, what’s your take? Are we bouncing or breaking down? Let’s discuss! 👇💬 #Gold #XAUUSD

Bitcoin (BTC/USD) Analysis: Consolidation Before Breakout?Bitcoin (BTC/USD) Daily Chart Analysis
Market Structure and Price Action
The Bitcoin (BTC/USD) daily chart exhibits a consolidation phase, with price movements constrained within a well-defined range. This range is highlighted by the blue rectangular area, indicating indecision in the market as neither buyers nor sellers have established clear dominance.
Key Technical Levels
1. Resistance Levels:
$100,000 - $103,787: Upper boundary of the consolidation zone, serving as a key resistance level. A breakout above this level could indicate renewed bullish momentum.
$108,734 - $110,266: Potential upside targets if resistance is breached.
2. Support Levels:
$96,484 - $97,065: Lower boundary of the consolidation zone, acting as short-term support. A breakdown below this level could signal increased selling pressure.
$89,533 - $84,773 (200-day EMA): Critical long-term support zone. The 200-day Exponential Moving Average (EMA) at $84,773 serves as a major technical support level, historically acting as a strong demand zone in trending markets.
Technical Indicators and Market Outlook
200-Day EMA: The 200-day EMA at $84,773 reinforces long-term support, making it a key level to watch in case of a market correction.
Trendline Analysis: The chart indicates a previous uptrend, followed by a sideways consolidation. A breakout from this range will determine the next directional move.
Highlighted Zones:
Green-shaded areas suggest historical demand zones, indicating potential buying interest.
Orange-shaded areas represent previous supply zones, which may act as resistance in case of a price increase.
Potential Market Scenarios
1. Bullish Breakout:
A break above $103,787 could trigger a continuation of the upward trend, with potential price targets at $108,734 and $110,266.
Sustained bullish momentum may push the price towards new all-time highs beyond $120,000.
2. Bearish Breakdown:
A break below $96,000 may indicate increased selling pressure, leading to a potential decline towards $89,533 - $85,000.
If Bitcoin loses support at the 200-day EMA ($84,773), further downside momentum could materialize, leading to an extended correction.
Conclusion
Bitcoin is currently in a range-bound phase, with price action indicating market indecision. A breakout above $103,787 would signal a resumption of the bullish trend, whereas a break below $96,000 could lead to further downside movement. The 200-day EMA remains a critical long-term support level, and traders should closely monitor price action around these key areas to determine the next market direction.

Crypto Total Market Cap Consolidation: Imminent Breakout Ahead?Key Observations:
1. Symmetrical Triangle Pattern:
The price is consolidating inside a symmetrical triangle, with lower highs and higher lows.
A breakout in either direction is imminent.
2. Exponential Moving Average (EMA 200):
The 200-period EMA is at 3.26T, currently acting as resistance.
A breakout above this level could indicate a bullish trend continuation.
3. Relative Strength Index (RSI 14):
Current RSI: 49.34, slightly below the neutral 50 level.
This suggests neutral momentum, with no clear overbought/oversold signals.
A move above 55-60 could indicate increasing bullish momentum.
Potential Scenarios:
1. Bullish Breakout:
If TOTAL breaks above the triangle resistance and EMA 200, the next targets could be 3.3T - 3.5T.
Confirmation requires high volume and RSI above 55.
2. Bearish Breakdown:
A break below the triangle support could push TOTAL toward 3.0T or lower.
RSI dropping below 40 would confirm bearish momentum.
Conclusion:
The market is in a consolidation phase, awaiting a breakout. Watch for volume confirmation and EMA 200 reaction to determine the next move.
