EUR/USD Breakout Imminent? Key Resistance in Focus!📊 EUR/USD Daily Chart Analysis – Bullish Breakout Incoming? 🚀
🔹 Key Levels:
Resistance Zone (Blue Box): Around 1.0450 - 1.0500
Support Zone (Red Box): Around 1.0250 - 1.0300
200 EMA (Red Line): Acting as a dynamic resistance near 1.0663
🔹 Price Action & Structure:
Price is testing a strong resistance zone (blue box) after multiple failed attempts.
A clean breakout above this level could trigger a bullish rally towards 1.0600 - 1.0700 (next resistance).
If rejected, a pullback towards 1.0300 before another attempt is possible.
🔹 Market Sentiment & Bias: ✅ Higher lows forming = bullish pressure building. ✅ Break and retest scenario likely, as indicated by the projection. ✅ 200 EMA remains a key target for bulls.
📈 Potential Trade Setup:
Breakout above 1.0500 → Buy opportunity
Rejection → Short-term pullback before another attempt
🎯 Bullish Confirmation Above 1.0500 📊💹
Predictions

XAU/USD Breakout – Targeting $2,950?XAU/USD (Gold) 1H Chart Analysis 🏆📊
🔹 Current Price: $2,926.285
🔹 Recent High: $2,927.305
🔹 Recent Low: $2,923.840
🔹 200 EMA Support: $2,870.242 (far below current price)
Key Observations & Setup
✅ Breakout Confirmed: The price has broken out of a descending trendline, signaling bullish momentum.
✅ Target Zone: The red resistance zone near $2,945 - $2,950 is the next potential target.
✅ Potential Move: Price is expected to climb toward this resistance area before facing rejection or continuation.
✅ Support Levels: If the breakout fails, the previous resistance (now support) around $2,915 - $2,920 could be tested.
Trading Plan 📈💡
Bullish Play: If price holds above the breakout level, targeting $2,945 - $2,950 could be a solid setup.
Bearish Rejection: Watch for rejection at the resistance zone for possible short opportunities.
EMA Support: The 200 EMA remains far below, reinforcing overall bullish sentiment unless a major pullback occurs.
📢 Final Thoughts: This is a classic breakout & retest scenario. If momentum sustains, we could see a push into the resistance zone. Stay cautious for any rejection signals! 🚀🔥

Gold Bullish Setup | Demand Zone Rejection & Upside Potential📈 Bullish Setup:
The price recently touched a demand zone (orange box) and reacted upward.
A large blue arrow indicates an expectation for price to rise towards the target area (gray box).
📊 Technical Indicators:
200 EMA (red line) at 2,894.263: The price is hovering around this level, which could act as dynamic support.
Current Price: 2,897.660: Above the EMA, indicating a possible short-term bullish momentum.
Key Support: 2,889.708 (orange label): If price breaks below, bullish bias might weaken.
🚀 Potential Trade Idea:
Entry Zone: Around 2,895–2,897 (just above demand).
Target: 2,912 (upper resistance).
Stop Loss: Below 2,889.

XAU/USD Bullish Breakout – Gold Eyes $2,928 & Beyond!🔥 XAU/USD Analysis – February 4, 2025 🔥
📈 Current Price: $2,842.18 (+0.98%)
📊 Trend: Bullish momentum inside an ascending channel
🔍 Key Levels to Watch:
🔵 Resistance: $2,928.75 – If this level breaks, expect further upside movement! 🚀
🔵 Support: $2,729.13 – Strong demand zone; watch for pullbacks.
🔴 EMA 200: $2,534.85 – Long-term bullish confirmation above this level! ✅
📉 Possible Scenarios:
✅ Bullish Case: Price continues the uptrend, targeting $2,928.75 next. If broken, gold could see $3,000+ soon! 🎯🔥
⚠️ Bearish Case: A rejection from resistance could lead to a pullback towards $2,800-$2,730.
💡 Final Thoughts:
The bullish momentum is still strong, and dips could be buying opportunities! 📊👑 Watch for price action near key levels.
📢 Gold bulls, are you ready for new highs? 🚀💰

EURUSD: Market of Buyers
Remember that we can not, and should not impose our will on the market but rather listen to its whims and make profit by following it. And thus shall be done today on the EURUSD pair which is likely to be pushed up by the bulls so we will buy!
❤️ Please, support our work with like & comment! ❤️

XAUUSD WEEKLY WRAP UP
This week, Gold (XAU/USD) continued its upward trajectory, achieving a sixth consecutive weekly gain. The metal reached a new record high above $2,880, reflecting sustained bullish momentum.
Key Influencing Factors:
Federal Reserve Commentary: Remarks from Federal Reserve Chair Jerome Powell contributed to market optimism, supporting the rally in gold prices.
Technical Levels: Gold approached the significant psychological level of $3,000 per ounce, with analysts suggesting that surpassing this threshold could be a potential game-changer for the metal.
Outlook:
The market's focus is now on upcoming U.S. economic data, particularly the Consumer Price Index (CPI), which could serve as a catalyst for further price movements. A higher-than-expected CPI reading may bolster expectations of a more hawkish Federal Reserve, potentially exerting downward pressure on gold. Conversely, a softer CPI could support continued gains in gold prices.
Traders are advised to monitor these developments closely, as they will play a crucial role in shaping gold's trajectory in the near term.
FOLLOW US BOOST US FOR MORE MARKET RELATED NEWS ANALYSIS AND UPDATES

EUR/GBP Bearish Momentum – Eyes on Support Zone!📊 EUR/GBP Daily Chart Analysis (28th Jan 2025)
🔹 Overview:
Pair: EUR/GBP
Current Price: 0.83855 📉 (-0.10%)
Key Indicators:
200 EMA (Red Line): 0.84129 (Price is below the EMA, indicating bearish sentiment)
Resistance Zone (🟠 Orange Box): ~0.84200 - 0.84400
Support Zone (🟢 Green Box): ~0.83200 - 0.83400
🔻 Bearish Outlook:
Price recently rejected the resistance zone and started declining.
It is now trading below the 200 EMA, suggesting potential further downside.
Next Target: The support zone (~0.83200 - 0.83400) is likely the next major level.
📉 Possible Scenarios:
1️⃣ Bearish Continuation ⬇️
If the price maintains momentum, it may head toward the support zone (~0.83200).
A break below support could trigger further downside.
2️⃣ Bullish Rebound 🔄
If the price finds strong buying interest at support, a rebound toward the resistance (~0.84200) is possible.
A breakout above 200 EMA could shift momentum back to bullish.
🎯 Trading Considerations:
Short Opportunity: Below 0.83800, targeting 0.83400.
Long Opportunity: If support holds around 0.83200, aiming for a move back to resistance.
Breakout Watch: A move above 0.84200 could trigger bullish momentum.
🔥 Conclusion: Currently, the trend is bearish, and price action suggests further downside toward the support zone. Keep an eye on price behavior around 0.83400 for potential reactions.

AUD/JPY At a Breaking Point – Big Move Loading!AUD/JPY is sitting at a crucial level right now. We're seeing a descending triangle pattern forming, with price getting squeezed between lower highs and key support around the 200 EMA (94.64).
A breakdown below this level could trigger a sharp drop, with targets around 90 and possibly 85-87 in the coming weeks. The bearish momentum is building, and today's red candle isn't looking too promising for bulls.
On the flip side, if buyers step in and push it back above 97.50, we might see a recovery towards the 100 level. But for now, the bias leans bearish unless we get a strong reversal signal.
Keep an eye on that 94 level – a breakdown could mean more downside ahead. 🔻

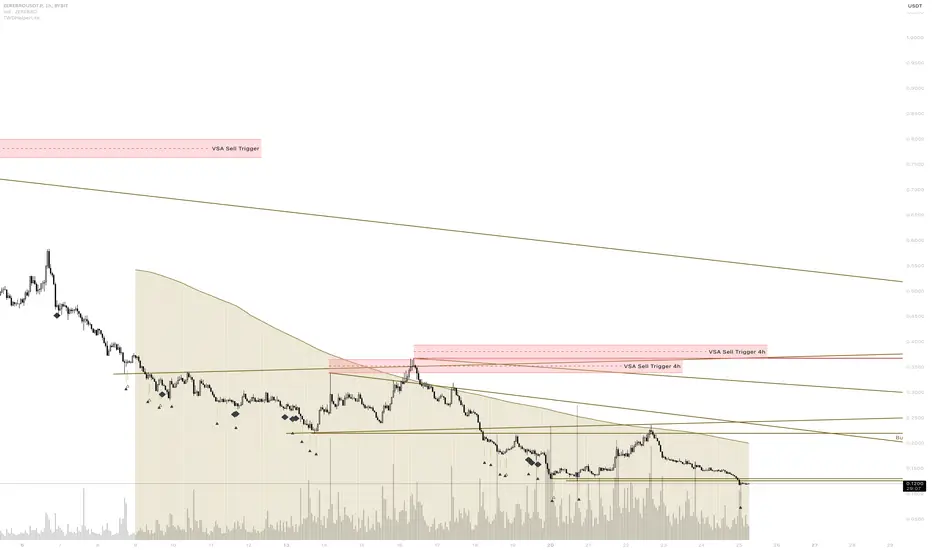
The Critical Rebound: Is ZEREBROUSD Ready for Its Next Big Move?Navigating the Rebound Zone: A Make-or-Break Moment for ZEREBROUSDT.P
ZEREBROUSDT.P has captured the spotlight as it hovers near its recent lows at $0.1166, marking a mere 3.08% deviation from this critical support level. With the price currently at $0.1202, the asset has retraced a staggering 84.97% from its absolute high of $0.8 earlier this month. These numbers signal an oversold condition, further reinforced by the RSI at 27.18, deeply entrenched in bearish territory.
The question arises: Is the market poised for a bullish reversal or further decline? Recent patterns suggest a tug-of-war. The "Increased Buy Volumes" pattern hints at growing demand, but the low MFI of 26.38 shows liquidity concerns are still holding back momentum.
Meanwhile, macroeconomic factors like subdued liquidity flows and ongoing market corrections across broader crypto assets are critical to watch. For traders and investors alike, this is not just another moment—it’s the moment to decide. Will ZEREBROUSDT.P hold its line and spark a rally? Or is the support too fragile, leading to a new bottom?
Brace yourselves—today's technical signals and market narratives may chart the path ahead. If you’re seeking an edge, the time to act is now.
Roadmap: Tracing the Journey of ZEREBROUSDT.P Patterns
Here’s the roadmap of ZEREBROUSDT.P’s recent market patterns—a timeline of events that confirms how well the trends held up and where they faltered. Buckle up as we trace the pivotal moments and assess their impact!
2025-01-22, 22:00 UTC: VSA Buy Pattern Extra 2nd
This pattern signaled a Buy direction with a setup for a major upward swing. However, the follow-up movement did not confirm the prediction. Price closed at $0.1834, but subsequent sell pressure suggests the trigger point failed to hold. This pattern, while textbook, missed its chance to deliver.
2025-01-24, 20:00 UTC: VSA Buy Pattern Extra 1st
A low at $0.1353 and a close at $0.1365 indicated potential bullish momentum. This time, the main direction aligned as prices pushed higher in the next bars, validating the predicted Buy signal. Traders catching this move could have enjoyed a steady climb.
2025-01-25, 00:00 UTC: Sell Volumes
This pattern hinted at Sell pressure. Price indeed dropped from $0.1277 to a close of $0.1178, solidifying the bearish sentiment. It was a textbook confirmation of the downward trend.
2025-01-25, 01:00 UTC: Buy Volumes
Finally, a glimpse of bullish resurgence. The price rebounded from $0.1167 to close at $0.1216, marking a solid recovery. The alignment with the Buy direction showed a reliable follow-through, confirming trader confidence.
Takeaway for Traders :
Patterns that align their direction with subsequent movements are the goldmine for traders. This roadmap shows how ZEREBROUSDT.P offered moments of clarity amid market noise. Keep your eyes sharp for those key validations—when patterns hit, they hit big!
Technical & Price Action Analysis: Key Support and Resistance Levels
Here’s the rundown of the hot zones where price action has been playing its game. Traders, these levels are your go-to for decision-making—whether to jump in or step back. Remember, if these levels don’t hold, they’re likely to flip and act as resistance. Let’s dive in!
Support Levels:
The market is testing support zones with precision, but nothing is etched in stone here. Eyes are on these levels to hold or flip.
Resistance Levels:
Resistance is where the sellers show their teeth. Watch how price reacts to these caps:
0.1312 – The first wall. Break this, and you’re in the game.
0.256 – A mid-level hurdle; momentum traders will love a clean breakout here.
0.3535 – Major resistance. If bulls smash through, this could pave the way for explosive moves.
0.3791 – A level not to ignore. It’s where the action could get intense.
0.4082 – The ultimate test. Conquer this, and the sky’s the limit.
Powerful Support Levels:
No notable “brick walls” of support have shown up just yet. Keep an eye out for developments.
Powerful Resistance Levels:
Still waiting for big players to draw the line here, but don’t take your eyes off the existing resistance points.
Pro Tip for Traders :
If these levels crack, don’t panic. Instead, watch for flips—they’ll become your new resistance zones, giving you a roadmap for the next move. Stay sharp and trade smart!
Trading Strategies Based on Rays: Dynamic Fibonacci-Level Trading Concept
The "Rays from the Beginning of Movement" concept uses Fibonacci-based dynamic levels to map price action with precision. Rays act as guides, marking zones of potential reversals or continuations, while intersections with Moving Averages (MAs) and Volume Spread Analysis (VSA) patterns provide further confirmation.
Core Idea :
Rays are derived from the origin of a trend or corrective movement. They define dynamic support and resistance channels, allowing traders to identify opportunities as price interacts with these levels. The strategy focuses on probability, not certainty, providing adaptable scenarios to traders.
Optimistic Scenario :
Price continues its upward trajectory after successfully interacting with key rays and dynamic supports like the Moving Averages. Targets align with resistance levels and Fibonacci-based zones.
Pessimistic Scenario :
Price breaks downward through dynamic supports, triggering a move to test lower rays and Fibonacci-calculated levels. This sets up potential short trades with clearly defined risk-reward zones.
Trade Scenarios and Levels
Each trade begins upon price interaction with a ray and confirmation of direction. Targets progress ray-to-ray, ensuring systematic profit-taking opportunities.
Trade 1: Long from $0.1202
First Target: $0.1312 – Initial breakout through resistance and interaction with an ascending ray.
Second Target: $0.256 – Continuation along the dynamic channel, reflecting bullish sentiment.
Trade 2: Short from $0.1202
First Target: $0.1166 – Testing the absolute low.
Second Target: $0.1100 – Further decline beyond the ray intersection, signaling bearish momentum.
Trade 3: Long from $0.1166
First Target: $0.1202 – Recovery after dynamic interaction with the ray.
Second Target: $0.1312 – Continuation of bullish movement.
Trade 4: Short from $0.1312
First Target: $0.1202 – Reversal after rejection at this key resistance ray.
Second Target: $0.1166 – Retesting the lower dynamic boundary.
Key Takeaways :
Wait for price interaction with rays and dynamic indicators like MAs and VSA patterns.
Enter positions only after a clear direction is established, and ride the move from one ray to the next.
Dynamic adjustments ensure adaptability, and each ray serves as the next logical target in either bullish or bearish scenarios.
Stay disciplined and let the rays guide your trades from one level to the next. Success lies in patience and precision!
Your Move: Let’s Keep the Conversation Going!
Got questions or thoughts about this analysis? Drop them straight into the comments below—I’m here to chat, clarify, and brainstorm with you. Let’s make trading smarter together!
If you’ve found this roadmap useful, don’t forget to hit that Boost button and save this idea to track how price moves according to my setup. Seeing how levels play out is one of the best ways to sharpen your trading edge.
Curious about the tools behind this analysis? My proprietary indicator automatically maps these rays and levels, making it easier to pinpoint trades. It’s currently private, but feel free to reach out via direct message if you’re interested in accessing it.
I’m also happy to craft analyses for any asset you’re following. Whether it’s something you want to keep private or share with the community, let’s discuss your needs. Just comment your asset and any preferences, and I’ll do my best to deliver.
Remember, these rays work on all assets, and price action respects them beautifully. If there’s a specific chart you’d like mapped out, Boost this post and let me know in the comments—I’ll add it to my list!
Finally, don’t miss out—follow me here on TradingView to stay updated on my latest ideas. Let’s grow together and make trading not just profitable, but enjoyable! 🚀
Is SWARMUSDT Ready for a Breakout?
SWARMUSDT has entered a fascinating phase, trading at $0.11341, far below its historical peak of $0.62689—a stunning 81.91% deviation from the highs recorded just 18 days ago. Yet, with the asset rebounding 25.1% above its recent low, the question arises: Is this the calm before the storm?
Current technicals suggest a potential setup worth watching. The RSI sits at 36.39, hinting at oversold conditions, while a series of VSA Buy Patterns on recent candles signal accumulation at these levels. With the MA50 trending downward to $0.13403, SWARMUSDT remains under pressure—but could this be the catalyst for a breakout as bulls test new resistance?
In a market swayed by macroeconomic shifts and investor sentiment, now is the time to stay vigilant. Is this your opportunity to ride the wave, or will the market pull back for one last consolidation? Keep an eye on this volatile mover—every second counts.
Roadmap of SWARMUSDT: From Signal to Momentum
Dive into the timeline of recent SWARMUSDT patterns to decode how the asset’s price movements align with key signals. Let’s analyze the most relevant patterns that hit the mark and proved their predictive power.
VSA Buy Pattern Extra 1st: January 25, 2025
Direction: Buy
The opening price of $0.11491 and closing at $0.1109 didn’t fully deliver immediate upside action. While the pattern aimed for a bullish push, the subsequent VSA Buy Pattern Extra 1st on January 24 also signaled Buy—validating a short-lived reversal that held potential. Prices stayed in a tight range but hinted at incoming accumulation.
Increased Sell Volumes: January 24, 2025
Direction: Sell
Here’s where things get spicy. The asset opened at $0.141 but sharply closed at $0.12597—a classic example of heavy sell-side pressure. This sell pattern succeeded in directing the market downward, confirming a clear alignment with the downward trajectory.
VSA Buy Pattern Extra 1st: January 23, 2025
Direction: Buy
This time, the Buy signal partially delivered. Opening at $0.15108, the price closed only marginally lower at $0.15101. However, it’s the interaction with the subsequent Buy Volumes pattern on January 22 that confirmed this pattern's intent, as the price rallied from $0.2026 to $0.22059—an undeniable proof of accumulation feeding the fire.
Increased Buy Volumes: January 22, 2025
Direction: Buy
This is the breakout you dream of. The market opened at $0.2026 and closed strongly at $0.22059, proving the upward bias was no fluke. What followed was a confirmation that this momentum marked a reversal point, supported by the next sequence.
VSA Manipulation Sell Pattern 2nd: January 21, 2025
Direction: Sell
The bears momentarily gained control here, with the price falling from $0.17216 to $0.1641. This retracement set the stage for the next accumulation phase, aligning perfectly with the Buy Volumes pattern that came to fruition soon after.
Buy Volumes Takeover: January 21, 2025
Direction: Buy
Boom. The market rebounded, closing at $0.17529 after an opening of $0.16161, signaling a firm buyer's grasp. This aligned perfectly with the trendline’s trajectory and set up a bullish consolidation period.
Key Takeaways for Traders
The Buy Volumes pattern consistently validated itself, signaling effective accumulation and trend reversals. Sell patterns like Increased Sell Volumes confirmed bearish phases, ensuring traders were aware of short-term downward movements. The roadmap suggests that combining VSA patterns with volume indicators amplifies accuracy. Future opportunities lie in identifying similar setups and leveraging momentum for entry/exit strategies.
This sequence is your guide to understanding how predictive signals can transform trading outcomes. Stay tuned and keep an eye on the next wave of SWARMUSDT patterns!
Technical & Price Action Analysis: Key Support and Resistance Levels
Let’s break it down with pinpoint accuracy. These levels are the battle lines where bulls and bears will clash, and price action will reveal its hand. If these levels don’t hold, they’ll flip into resistance zones, so keep a close watch.
Support Levels:
These levels are where buyers might step in to defend the trend:
0.09065 (recent absolute low)
If broken, expect this level to act as a brick wall of resistance for any bullish recovery attempts.
Resistance Levels:
These are the ceilings that price needs to smash for a breakout:
0.14784
0.24552
0.3642
If momentum fizzles out here, these levels will flip, becoming tough hurdles for the bulls.
Powerful Support Levels:
Currently, no standout zones are in play, suggesting the price is testing buyers’ resolve near dynamic supports like moving averages.
Powerful Resistance Levels:
Major areas to watch where the bears are likely to stack their sell orders:
0.24552 (also aligns with a key fib retracement zone).
Once the market closes above this with volume, a significant bullish run could ignite, but failure will likely spell trouble for any recovery momentum.
The game plan is simple: watch how the price reacts at these zones. A breakout or failure will guide the next move. Always trade with a plan—respect the levels, and let the market show its hand before diving in.
Trading Strategies Based on Rays: Fibonacci Meets Market Dynamics
The "Rays from the Beginning of Movement" concept integrates Fibonacci-based geometric principles with dynamic price action, creating a robust framework for trading SWARMUSDT. By leveraging these rays, traders can identify high-probability zones for interaction and subsequent movement, supported by dynamic factors such as Moving Averages and VSA (Volume Spread Analysis) rays.
Concept of Rays
Core Idea: Rays, based on Fibonacci angles, are drawn from the start of movement patterns to define channels and dynamic interaction zones. Unlike classical analysis relying on extremum points, this method adapts to market dynamics in real-time.
Dynamic Factors: Interaction with key Moving Averages (MA50, MA100) provides additional confirmation of trends and support/resistance zones.
Interaction Scenarios: When the price interacts with a ray, traders should wait for confirmation of reversal or continuation patterns. This ensures trades are placed at moments of high probability. Targeting Zones: Each ray transition creates a roadmap of price objectives, with the price typically moving from one ray to the next, offering clear entry and exit strategies.
Trading Scenarios
Optimistic Scenario:
Key Interaction Zone: Price bounces off the ascending Fibonacci ray near $0.11341 and interacts with MA50 at $0.13403.
Targets:
First target at $0.14784, aligned with dynamic resistance and the next Fibonacci ray.
Second target at $0.24552, achievable upon breaking MA100 at $0.1545.
Third target at $0.3642, signaling a significant trend breakout.
Strategy: Enter long after confirmation of the bounce from $0.11341, supported by volume and bullish VSA rays. Maintain trailing stops as the price moves toward each target.
Pessimistic Scenario:
Key Interaction Zone: Price fails to hold above the Fibonacci ray at $0.11341 and breaks below the critical level of $0.09065.
Targets:
First target at $0.09065, turning into resistance if broken.
Second target at $0.081, representing a potential oversold zone if significant bearish pressure emerges.
Strategy: Enter short after confirmation of a breakdown below $0.11341 and a bearish crossover of MA50 and MA100. Look for VSA sell signals to reinforce the decision.
Suggested Trades
Long from $0.11341 to $0.14784: Entry after interaction with the Fibonacci ray and confirmation of bullish momentum.
Short from $0.11341 to $0.09065: Entry upon bearish break below the ray, confirmed by sell-side volume dominance.
Continuation Long from $0.14784 to $0.24552: Add to positions after a breakout and interaction with MA100.
Trend Reversal Short from $0.14784 to $0.09065: Reevaluate bias if price fails to hold above the ray and reverses significantly.
These strategies offer traders flexibility to adapt to either direction, leveraging the synergy of Fibonacci rays, MAs, and VSA dynamics. Plan your entries wisely, and let the rays guide your trades from level to level!
Your Questions and Ideas Matter!
Hey traders! Let’s keep the conversation alive—drop your questions, thoughts, or requests right here in the comments. I always enjoy hearing your insights and discussing how we can navigate these markets together.
If you found value in this idea, don’t forget to hit Boost and save it to revisit later. Watching how the price respects the levels and rays over time is a game-changer—it’s all about nailing those key zones for entry and exit. Let’s see how this setup plays out together.
By the way, my indicator draws all these rays and levels automatically, making analysis smoother and more accurate. If you’re interested in accessing it, shoot me a private message—I’ll be happy to explain how it works. Whether you’re new or experienced, I can help tailor strategies to your needs.
Have an asset in mind that you’d like analyzed? Leave a comment with the ticker, and if it resonates, I’ll do my best to share a breakdown. For more detailed, private analysis, let’s chat directly—we can work out the perfect solution for your needs.
If you enjoy this content, hit Follow to stay updated with my latest ideas and strategies. It’s here on TradingView that I’ll continue sharing insights, so let’s grow together! 🚀
Trade smart and stay inspired!

Big Time (BYBIT-BIGTIMEUSDT.P): A Hidden Giant Poised for ActionThe Market's Crossroads: Ready for the Next Big Wave?
Imagine holding an asset that’s down over 90% from its historical highs yet brimming with subtle signs of revival. Big Time (BYBIT-BIGTIMEUSDT.P) is trading at $0.09929, a far cry from its $0.9995 peak, but its deviation creates a golden window for both opportunistic traders and long-term investors. With RSI hovering near a neutral 47, the market appears undecided, creating an atmosphere thick with potential.
Adding intrigue, the "VSA Buy Pattern Extra 1st" and other bullish patterns from recent trading sessions highlight momentum brewing below the surface. The asset seems primed to break past resistance levels of $0.11624 and higher, while the moving averages suggest this consolidation could be the calm before a storm.
Could this be the moment the market pivots? With fundamentals steady and technical signals aligning, Big Time may just be living up to its name. Are you ready to ride the wave? The clock is ticking.
Roadmap: Big Time's Pattern Analysis and Market Journey
January 23, 2025, 21:00 UTC: VSA Buy Pattern Extra 1st - The Setup The market flashed a VSA Buy Pattern Extra 1st with a main_direction: Buy, aiming for a breakout above key resistance levels. However, the subsequent candle failed to align with the bullish projection as the price closed lower, nullifying the pattern’s expected trigger. This pattern was skipped as it did not deliver on its forecast.
January 24, 2025, 11:00 UTC: Increased Buy Volumes - A Bullish Signal Emerges This pattern signaled heightened buying pressure, with the price closing higher at $0.10378, a decisive move aligning with the bullish direction. The increased volume reinforced the strength of the move, setting the stage for a potential trend reversal. This pattern validated its signal and established a positive market tone.
January 24, 2025, 22:00 UTC: VSA Buy Pattern Extra 2nd - Momentum Builds As the price rallied from the earlier Increased Buy Volumes, this pattern continued to support the bullish narrative. The price hovered above the $0.09916 low, confirming the strength of the prior setup. The trend gained traction, with the next bars maintaining the upward trajectory—a textbook example of pattern validation.
January 25, 2025, 00:00 UTC: VSA Buy Pattern Extra 1st - The Breakout Play Closing at $0.09567, this pattern projected another main_direction: Buy. The subsequent movement saw the price stabilize, with no significant downward corrections, proving the resilience of the bullish momentum. As the price tested key levels without breaking the upward trendline, traders had a clear signal to ride the wave.
Takeaway
Big Time's recent patterns reflect a game of patience and precision. By sticking to validated setups like the Increased Buy Volumes and tracking the interplay of price and direction, traders can navigate with confidence. Whether you're looking for short-term pops or longer-term positioning, the roadmap above provides clarity on when to jump in and ride the action. Are you ready to capitalize on the next big move?
Technical & Price Action Analysis: Key Support and Resistance Levels
Support Levels
The current playbook for support shows price flirting with soft zones that could act as springboards if the market behaves. These include:
Support 1: $0.0727
Support 2: $0.0657
If the price slices through these levels without any bounce, they flip to resistance—tough barriers that could choke any upside attempts.
Resistance Levels
Where the bulls need to show up big to clear the air:
Resistance 1: $0.11624
Resistance 2: $0.12546
Resistance 3: $0.12934
Resistance 4: $0.13203
Resistance 5: $0.13467
If the market can't sustain above these levels, expect them to act as headwinds, keeping prices boxed in.
Powerful Support Levels
Stronger levels that could hold the fort if volatility spikes:
Powerful Support 1: $0.11475
Powerful Support 2: $0.3138
Powerful Support 3: $0.6463
Break these, and it’s game over for the bulls, with these levels flipping to powerful resistance zones.
Powerful Resistance Levels
Big dogs on the chart—the ones to break for a breakout run:
Powerful Resistance 1: $0.0727
Powerful Resistance 2: $0.0657
If these get tested and fail to crack, they’ll anchor the market to lower trading ranges.
Summary
These levels are your roadmap—play them right, and they’ll be your guide. But remember, in trading, what doesn’t hold as support becomes the wall to climb as resistance. The market doesn't owe anyone, so trade smart and stay nimble!
Concept of Rays: Trading Strategies and Scenarios
The "Rays from the Beginning of Movement" concept provides a unique approach to identifying dynamic levels where price interaction signals potential reversals or continuations. Built on Fibonacci principles, these rays adapt to new trends, offering traders actionable insights.
How Rays Work in Practice
Fibonacci Rays and Their Dynamic Role
Constructed from the start of movement patterns, rays provide dynamic support and resistance zones. Unlike traditional methods, rays adjust in real-time, defining boundaries for trend channels and helping traders anticipate movements.
Moving Averages as Dynamic Factors
Key MAs (e.g., MA50, MA100, MA200) interact with rays, confirming potential entry points. When price crosses a ray near a critical MA, it’s a signal for possible trend continuation or reversal.
From Ray to Ray Movement
Once price interacts with a ray, traders can expect movement toward the next ray, offering clear trade targets. Entry occurs after confirmation of interaction, with the first target being the next ray, followed by subsequent levels.
Optimistic Scenario: Bullish Trade Setup
Price is currently trading near MA50 ($0.10033) and a key ascending ray. If interaction occurs and the price breaks upward:
First Target: $0.11624 (Resistance Level)
Price interaction with this resistance may trigger further bullish momentum.
Second Target: $0.12546 (Next Resistance)
A continuation beyond the first ray indicates strengthening bullish sentiment.
Third Target: $0.12934 (Final Ray for Trade)
This would signal an extended move, reaching the boundary of the current bullish channel.
Pessimistic Scenario: Bearish Trade Setup
If price fails to hold above the MA50 and descends through the ray:
First Target: $0.0727 (Powerful Support)
A breakdown here could reinforce bearish pressure.
Second Target: $0.0657 (Next Support)
Price continuation toward this level suggests a deeper corrective phase.
Third Target: $0.0548 (Absolute Low)
A breach of this ray signals a potential long-term bearish trend.
Sample Trade Ideas
Long Trade
Entry: Upon confirmation of interaction with ascending ray and MA50.
Targets: $0.11624 (T1), $0.12546 (T2), $0.12934 (T3).
Stop Loss: Below the ray and MA50.
Comment: Bullish momentum driven by ray alignment and MA support.
Short Trade
Entry: After price breaks below descending ray and MA50.
Targets: $0.0727 (T1), $0.0657 (T2), $0.0548 (T3).
Stop Loss: Above the ray and MA50.
Comment: Bearish continuation fueled by interaction with descending rays.
Conclusion
These strategies are built on precise ray alignments and dynamic MA factors visible on the chart. Every level becomes a crucial step in managing trades effectively. By following the movement from ray to ray, traders can capitalize on high-probability setups while adapting to changing market dynamics. Let the rays guide your way!
Let’s Keep the Conversation Going!
Have questions or thoughts? Don’t hesitate—drop them in the comments! Your insights and ideas matter, and I’m here to discuss them with you. Whether it’s clarifying levels, refining strategies, or just sharing perspectives, let’s connect and grow together.
If you found this analysis helpful, hit Boost and save the post to revisit later. Watch how the price respects the rays and levels we’ve outlined—because nailing those key zones is what trading is all about.
For those curious about my indicator-strategy that automatically maps out all the rays and levels: it’s available privately. If you’d like access, just send me a direct message, and we’ll figure something out. It’s a game-changer for precise trading on any asset.
Need analysis for your favorite asset? Let me know in the comments or DM me. Some ideas I share openly, while others can be personalized if you prefer to keep them private. The rays work universally, and I can create a tailored setup for you, no matter the market.
Lastly, don’t forget to follow me here on TradingView. This is where all my updates, insights, and new strategies land first. Let’s build a trading community that thrives on knowledge and results. 🚀
Looking forward to your comments and boosts—let’s make trading smarter together!

First 2025 prediction Cloud/usdt $0.65prediction Cloud/usdt $0.65 with time
this coin has a good chance to gain $0,65, after studying the data of this coin.
The best way is to follow this coin's low day frame with the day trend.
This update is not a trading update, but a prediction update.
Know that there is no guarantee that this price will become a reality, our study is based on the data study which can be confirmed.
There is also a day trading follow updates by this update
Let the time show us if this coin is going to get the expected break.
Markets going on their way, and it can take time before this coin can show a result. also, this update depends not on the small time frame changes. it's a large picture for the coming times.

Variation of last chart but daily. Alt scenario guess from here This here is a variation of my last but just on the daily instead and another wishful thinking price scenario guess for the altcoins from here. Came up with this scenario guess by using an amalgamation of different ta principles i picked up here and there like described on last chart mixed with a little bit of just intuition guessing, moon cycle theories, and real world time events. Could be totally wrong, not an expert, just throwing my guess based on my level of knowledge, just in case it turns out to be spot on.

Parabolic Patterns: ETH/BTC and SOL/ETH Trends into 2026The parabolic move for ETH/BTC could extend well into 2026. The SOL/ETH chart appears to be losing steam, much like the ETH/BTC chart did. The similarities are striking. Does this mean SOL will start losing steam from here?

Nightly $SPX / $SPY Predictions for 12.04.2024🔮
⏰8:15am
ADP Non-Farm Employment Change
⏰9:45am
Final Services PMI
⏰10:00am
ISM Services PMI
⏰10:30am
Crude Oil Inventories
⏰1:45pm
Fed Chair Powell Speaks
#trading #stock #stockmarket #today #daytrading #swingtrading #charting #investing

EURUSD Trading Opportunity! BUY!
My dear followers,
This is my opinion on the EURUSD next move:
The asset is approaching an important pivot point 1.0777
Bias -Bullish
Technical Indicators: Supper Trend generates a clear long signal while Pivot Point HL is currently determining the overall Bullish trend of the market.
Goal - 1.0797
About Used Indicators:
For more efficient signals, super-trend is used in combination with other indicators like Pivot Points.
———————————
WISH YOU ALL LUCK

Top of Our Channel Tagged to the Dollar!Here we are again traders. Tagged the top of our channel to the dollar. What precision! Big resistance pressure up here. I am not sure the bulls have the strength to finally break us out and above. Therefore, be ready to start taking profit (if you haven't already). It is quite possible that we come back down to the bottom of our channel or even lower, especially with all that is going on in the world. Never rule out another black swan or flash crash.

EURGBP: Bulls Will Push
The charts are full of distraction, disturbance and are a graveyard of fear and greed which shall not cloud our judgement on the current state of affairs in the EURGBP pair price action which suggests a high likelihood of a coming move up.
❤️ Please, support our work with like & comment! ❤️

Crypto's Bullish Talk, Bearish Trades: A Swarm Intelligence AlgoHello,
Artificial Swarm Intelligence
I wrote an Artificial Swarm Intelligence algorithm to run on popular prediction platforms, and Swarm AI reported more than 80% of traders believe in a BTC crash. That's strange because the same algorithm on social media wrote that BTC was a trending topic. Everybody talks about Satoshi Nakamoto, and these talks often diverge into bullish ideas about BTC. According to the swarm, people claim to believe in a bullish outcome for BTC, but they trade to expect a bearish future. I leave the conclusion to you. Who to believe, what people say, or what people trade? And will people lose, or will they make a self-fulfilling prophecy?
Technical Analytics
Technically, MACD demonstrated bearish power until 05 August and slightly weakening bullish momentum by 28 September. At the moment, however, both sides seem powerful. Since 01 October, there's been a bearish cross on MACD, but recently, bears haven't picked up the momentum.
Conclusion
I'd wait until one of the sides starts to exhaust itself before making a trade. The setup suggests possible targets in the white zone, but also that the market can become volatile. If I traded now, I'd use strict stop losses.
Regards,
Ely

EURCAD: Long Trading Opportunity
EURCAD
- Classic bullish pattern
- Our team expects retracement
SUGGESTED TRADE:
Swing Trade
Buy EURCAD
Entry - 1.4946
Stop - 1.4900
Take - 1.5028
Our Risk - 1%
Start protection of your profits from lower levels
❤️ Please, support our work with like & comment! ❤️

SPX Key $ Levels | 70%+ Accuracy! | WednesdayNew price targets for Sep 25 using Statistics and Data to drive a 70%+ historical accuracy.
Topics:
- Today's Targets
Overall we use stats and data pulled from a wide array of TradingView indicators and scripts so that I can have as much data as possible - even if it's unstructured or uncorrelated data. I then use AI and SOP's to systematically calculate a weekly and daily framework. My predictions are never 100% but ALL of them are mathematically proven to be 70%+ accurate historically or I wouldn't use them.
Most indicators I use on my Data Dashboard chart has the stats in their associated boxes that I show during the recording if you'd like to verify yourself.
Please leave me feedback as I am new to creating content and would like to improve.
Personally I use these targets in combination with ICT Concepts to trade.
Nothing I say is Financial Advice - Previous performance does not guarantee future success.

EURUSD: Bearish Continuation & Short Signal
EURUSD
- Classic bearish setup
- Our team expects bearish continuation
SUGGESTED TRADE:
Swing Trade
Short EURUSD
Entry Point - 1.1160
Stop Loss - 1.1191
Take Profit - 1.1096
Our Risk - 1%
Start protection of your profits from lower levels
❤️ Please, support our work with like & comment! ❤️

SPX Data Market Analysis | ICT | Sep 19Pre Market Analysis for Sep 19'th using Statistics and Data to drive a 70%+ historical accuracy with all analysis methods.
Inner Circle Concepts Trader using Stats to analyze the stock market.
Topics:
- Yesterday's Results
- Today's Projections
