SPX Shorts History repeating itself from last weeks bounce History is repeating itself on both indexes. $SPX500 & $DOW seems to be rejecting today's earlier move up on vaccine news with #Covid-19 cases still on the rise we will be selling off on this news for the remainder of the week we already got a major buy move this morning which is more than enough to sell off until at least Wednesday and from Wednesday on we should be looking at some buys perhaps.
Predictions


Trust The Trend, Until The Trend Breaks I got close with my plot predictions! Made pretty good money, but don't trust myself when I should.
Bears tried to break the bottom of the channel several times Friday, but ran out of steam. I was nervous about it, but kept buying TQQQ 10 shares at a time under 11k, swung up 80 pts at close for a sweet $600 profit. Left 50 .
Like the title say, trust the trend until it breaks... it's been on this bear channel for 3 weeks, so prolly due for a change, but who knows? Nobody thought we'd have a 12yr bull market and people would still cry about the President. Until it breaks that bottom channel line good and proper, it's a buy. I expect a pump to midpoint of the channel around 11230 in Sun/Mon Pre-market. Then a sell-off, perhaps happening very earlier, referencing the last two Mondays, 26th & 19th.
Still... follow the trend lines. Yellows the supp/res zones of interest. Red is the bear channel, blue dot the mid point. Till it breaks strong, its to be trusted.

Contrarian View - Bitcoin Overbought - About to Crash Hard - 8kI'm going to put this out there, like I often do. I don't see this recent Bitcoin move as a breakout. Yet. $12,500 must be breached AND confirmed on the daily. As you know this requires (2) two candles, (1) one to break above and (1) one to stay above that area which is currently huge overhead resistance.
Also. See that slightly downward sloping BLACK trend line? Yeah. We have NEVER confirmed a break above that since Jan 2918! Yeah that's right. 2018. Almost (2) two years! Yes, we have broken above. But, NO, we have not ever confirmed with a second candle on the daily. This statistic is extremely important to note.
My feeling (and I could be completely off on this), is that the U.S. stimulus resolution does not get passed today, OR some other negative news is revealed, and the market collapses by close of business tomorrow. As you know, Bitcoin has been correlating it's moves tightly with the broader market.
If we do start to move down, target area remains at $8000 as I charted in September. Though, we may not hit 8k by the end of November. This U.S. election crap/confusion could move us all the way into the Jan 2021 time frame.
This is just my gut prediction. Too early to call at this point. But I thought I'd throw this idea out there as a contrarian possibility for you all to consider. We'll know by tomorrow for sure.
And if I am wrong, I'll be publishing a whole new chart. At that point, I see 17k+ in the charts by Jan. As for me, I remain mostly in cash at this point until the market reveals which way it will go.
Best of luck traders. Be safe! A lot is up in the air. A lot is at steak. And there are a lot of unknown variables which could rapidly change at any moment. So, please be careful.

Bloomber Commodity Index - Monthly; Despite all the noise...... the song remains the same.
It is (still) all about the USD and Gold!
... because otherwise the world is swimming in over-supply!

Big short opportunity after correctionInteresting trendlines intersection that highlights an interesting point where a lot is happening. (third major resistance point, start of the last elliot thrust and second fibonacci point). you can even trade a long posittion from elliot point a to point b but i suggest to just wait and go short. Happy trading!

Breaking Trends!I laid down at 1:30 this morning at the underlined point. When I woke up at 6 the bigger circle had already took place.. many people in class missed and some got a little piece of it.
I'm glad I missed it, I seen the drop coming so basically most classmates broke even if they got in during this entire mess of 5 hours.. the waters are settling back down for now.
I predict price to rise up the lower trend line and fall thru floor again if not today then Friday(10/2) before noon.
What are your predictions?

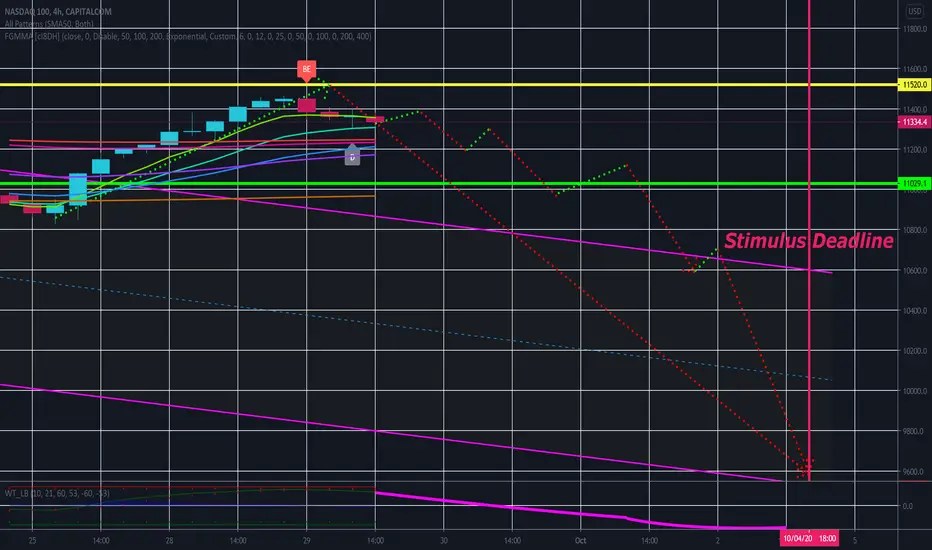
No Stimulus NASDAQ PlotThis is an update to the Island Gap post. I attempted to plot a path to meet my target. I used a rough timeline of events and hypothetical sentiments in the week ahead. Should the house fail to pass a much lower stimulus bill by Friday, I expect a limit down event this week, or early next. These things are very hard to predict, so take it with a grain of salt; but October is notorious for being bearish even without such circumstances.
Nifty50 anylsis 25 sep 2020Nifty is bullish in 15 min because little correction
And bearish in day time frame
Small correction at green support
yellow support is major support

BTC will continue uptrend upon support. Target 12,927 - 17,146!Greetings dear traders,
Here's what I see happening on the charts. BTC market has gotten ahead of itself. We are now consolidating and entering back into the "Larger Uptrend Channel". We will still reach our targets or 12,927 and 17,146 after that. It will simply take a little more time if we reside in this channel.
As you can see from the chart, we should find support soon (maybe by the end of the week).
Good luck traders! Many blessings to you all.

Would you buy this?BTC I meeaannn come on? would you? looks like a nice cup just need confirmation of the handle lets see how it plays out id like to hear what you all think.

DXF will be a big winner on Monday!This is is my first posted idea and it is a future prediction completely based on my proprietary stock market ai program that predicts future prices. It predicts DXF will make around 50% profit compared to the latest close price by the next market day which is the upcoming Monday. It predicts DXF will reach a high of 1.25 and the estimate has a std error of 0.12 and a r squared of 0.938.
As you can see in the chart, the demark reversal points thinks it is a selling point but I believe the uptrend will continue and the roofing filter shows a clear uptrend.
Be sure to like my idea and follow me! I will try to publish more of these upon request but I wanted to go ahead and make this my first idea.

Should i sell it?? I am beginer.I am trying to learn fx and i dont know if my strategy is ok. Plz tell me if i made any mistake and if i predicted the eur/usd right.

BTC projection for 2021February and March 2021 will be historic for BTC, on this date there will be a break from the historic top towards 30,000 USD.
Analysis done on 05/23/2020.
Fevereiro e Março de 2021 será histórico para o BTC, haverá nesta data o rompimento do topo histórico rumo a 30.000 USD.
Analise feita em 23/05/2020.

TOWN < LONG > 100 YEAR OPPORTUNITY^Wave5CompletionAs the title suggests. Towne Bank is currently at the best price you're likely to see. A long term investment to carry you into the next century.
Expecting elliot wave 5 completion in the Summer of the Year 2098.

The psychology of price patternsWe have said before that changing attitudes determine price and price moves in trends that tend to perpetuate. So, how can a trend be defined?
Simply, it is the movement of price in an irregular but persistent direction. When you zoom out your chart and watch price movement, whatever is obvious is the trend. The USDZAR chart below illustrates some trends you will encounter.
For those that are familiar with watching charts, then we can say price moves in either of 3 ways: upwards, downwards, or sideways. When it is moving upwards or downwards, people say either the buyers are greater than the sellers, or the sellers are greater than the buyers. But thinking this way has errors. They are saying that the market is not in equilibrium. The correct interpretation of such upwards or downwards movement is that the buyers are either more aggressive or enthusiastic than sellers for uptrends, or the sellers are more aggressive or enthusiastic than buyers for downtrends.
For the third case, the sideways movement, we can say that this is a transitional period, a period where the aggression of buyers and sellers are evenly matched. It is at these periods that price patterns develop. This is a period of consolidation between both sides of the market and it is of two types:
a. Consolidation or continuation patterns: this is where the preceding trend before the consolidation is seen continues after the consolidation. That is uptrend to consolidation to uptrend vice versa. The chart below shows an example.
b. Reversal pattern: this is where the opposing trend to the preceding trend before the consolidation is achieved. This pattern separates an uptrend from a downtrend, and a downtrend from an uptrend.
These patterns are the bread and butter of the setups we trade in price action.
These patterns sometimes don’t work in line with the fundamental news such that they might appear unbelievable. That is what makes them powerful. I have seen so many traders who saw a reversal pattern in an asset but who read that the fundamental news says the trend will continue. Because they chose to follow the crowd, rather than listen to price, they placed a trade in line with the fundamental news only to lose money in the process.
This is why in my trading I don’t follow the fundamental news or what the crowd is saying. I listen to the crowd but don’t follow them. I follow price and the patterns that price gives. This is because every news in the market is already factored in the price. Therefore, it is better to follow price.


Looking at a few of the WORSE calls of the past."We all gunna die! Listen to me"
This has kept being repeated for at least tens of thousands of years.
Those calls age like a fine milk, and when it does, the prophets of doom are nowhere to be found.
Here are some of the most ridiculous and sad calls made in the past:
> The millennium bug
Also called year 2000 problem.
This one is only 20 years old, but I'm sure some people haven't even heard of it.
20 years later the idiotic calls made back then are not advertised. Wikipedia has a page on it but they have not mentionned all of the terrible calls that were being made and repeated over and over in particular in the media. It's as if no one was stupid back then and the world acted rationally. See? You can't trust history.
No, history books and wikipedia and sites that talk about it are wrong. It's not that they are wrong it's that they left the best bits out of the story?
What? To not make people that feel ashamed look stupid?
On tv some nuts were calling for the end of the world, literally. Some christians were claming this would be Jesus second coming. And they were getting attention.
I was a kid and I already thought this was dumb.
From an UN release:
www.un.org
"Some computer companies were beginning to be optimistic about the Y2K event and some were making a lot of money from devising ways of "fixing" problems related to the issue. Some were referring to a "Y2K boomlet" in the economy as a result of the Y2K fear."
Suckers were becoming fearful and were getting fleeced. Haven't heard much from them. None have been giving speeches on their hiring of "experts" to "protect them from the mighty Y2K bug". People that compared those braindead sheep to nuts looking for exorcists and talismans weren't taken seriously, but they were right. The suckers that hired experts and bought "special software" (pun intended) to protect from the mighty Y2K bug were the modern version of suckers buying expensive talisman to protect against evil ghosts and spirits.
The UN, these masterminds, these lights in the darkness, those beacons of hope, were expecting riots in the streets, wars, governments to be overthrown.
1 small article about some of this:
www.wired.com
AND NOW. IF YOU THINK THIS IS A JOKE. IF YOU THINK I AM EXAGERATING. "It wasn't that bad". 20 years later people have forgotten. People think it wasn't that stupid. Oh yeah? Then listen closely. The whole country of CANADA 🤡 PREPARED FOR A COMPLETE BREAKDOWN OF CIVILIZATION.
"Canadian leaders were preparing for the possibility that civilization would break down"
This article enters into more details about Canada reaction, and shows a few example of the measures that were taken:
www.theglobeandmail.com
There have been a handful of little bugs, and a few were avoided in advance. No biggie. Collapse of civilization lmao they're so bad.
Aged like fine milk.
> The 2020 coronavirus cold pandemic & governments reactions
Too early? 😉
Can also add the "apocalyptic CO2 calls muh gLoBAl WArmINg"
I'm eagerly waiting for those to age so I can say "told you so" and rub it in their faces.
> Quick one: "Commodities will never go to zero"
"The price of a commodity will never go to zero. When you invest in commodities futures, you're not buying a piece of paper that says you own an intangible piece of company that can go bankrupt."
Jim Rogers.
What's this Jim? You'll come in my office I want to have a word with you.
> Gordon Brown bottom. Never forget.
Former Prime Minister of the United Kingdom Gordon Brown, UK Chancellor of the Exchequer at the time (head of her Majesty Treasure, french equivalent I think I can say is "ministre des finances" "financial minister"), so basically the "financial expert", the head of the part of the government in charge of finance, made this wonderful sale in 1999-2002:
Clearly a very competent man, which expertise is not just "knowing how to get elected".
Ah, Mr Brown today is giving us his advice on how to deal with covid-19. Wonderful. Let's listen closely so we can do the exact opposite 😊
2009. Gordon Brown warning us of a Climate Change™ global catastrophe. Hahaha. No surprise here.
www.telegraph.co.uk
Gordon Brown. Losing tens of billions with horrible trades, and then asking tens of billion to taxpayers for some unproven illogical extremely exagerated dogma:
www.independent.co.uk
Absolute POS moronic politician.
"My idea of a perfect government is one guy, in a small room, sitting at a desk, and the only thing he's allowed to decide is who to NUKE."
- Ron Swanson
Well said Ron.
> "The Titanic is unskinkable"
I don't think I have to explain :D
Ye... It was being advertised as being "Titanic" and invincible. Aged well.
Maybe the quote was taken out of context, I don't know every thing, I know that the other 2 titanic ships (HMHS Britannic, RMS Olympic, RMS Titanic) were used in the war and had their own issues.
And I know that the Titanic just went straight for an Iceberg. So someone must have thought of it as nearly unsinkable.
> "In 10 years Oil will cost $380 a barrel" (2005)
"Experts economists" (yawn) were explaining that because of world consumption Oil prices would go up, impossible they would not go up, and would probably be around $380/barrel, and we needed renewables. And ye they explained they looked at sound science and clean facts and it was absolutely impossible for the price not to soar and we had to quickly forget cheap Oil YAAAAAAAAAWN! Dumb economists. So wrong all the time.
This didn't pick up worldwide attention I think it's quite local.
Article is in french...
www.liberation.fr
> "Prosperity will never end"
1929, 2000.
In 2020 the sheep npcs updated their firmware. Now they're saying "stonks will always go up".
> "I hope that with fast foods the french won't get fat like americans" - 1985
Whole world eats 20 grams of a salt a day and eats 1 meal a day. 1 meal that lasts all day long.
> "Enron is the most innovative company" and "Share price will go to 1000" and "Retail is buying at these cheap price"
Innovative in what sector? Fraud?
I posted and laughed about Zoom investors, I laughed about USO (Oil Fund) buyers, I laughed about Carnival (cruise) and airline company buyers.
But the medal really belongs to Enron -99% buyers.
Yes. AFTER bankrupcy and the fraud was publicly known and on every news show over and over.
Yes really. Retail investors REALLY bought Enron shares AFTER the collapse. Since then Enron got delisted so good luck selling, and they can't claim they got caught in a fraud got lied to or anything, since these masterminds bought AFTER the fraud went full public. Absolute genius. "Buy cheap".
And regulators whine about Forex and restrict it and ban ads and are annoying.
K that's enough for a single idea.
> BONUS
People can believe anything... By upvoting a non existant restaurant in London pranksters got mainstream to believe it existed, and it was the best restaurant in London, and people started looking for it.
In 1996 Alan Sokal, a physics professor published a paper where he proposed that quantum gravity is a social and linguistic construct. A few weeks later he told every one he published a hoax.
I think we can blindly trust "science" no problem 👍
In the late 2000s university students in France were whining about some law (in France universities are generally where the tourist students go, there are no famous french universities, french elites go to small ultra selective "schools").
I was going to my school and university participation trophy students warned they would block the access to our school.
Our math teacher cracked up and she told us not to worry, because those kind of students "typically didn't wake up early".
So basically for the next months these masterminds were standing in front of our school while we were in. Classes began BEFORE they got there, and classes ended AFTER they had already left.
They stood in front of our doors for weeks of months, every day! And we couldn't care less and we were dying of laughter. They were just standing there for nothing, probably patting themselves on the back "aha! No one is coming no one is leaving they are not even trying to enter we have frozen this school" 🤣
LoL I wonder why these geniuses ended up in garbage universities and failed the selective schools admissions. Nothing to do with cognitive abilities I'm sure.
"Miley Cyrus has many fans around the world. Young girls look up to Miley and her character Hannah Montana because they both set a good example for girls."

Strong support on the 1.050 level ?strong support on the 1.050 level, looking for a bounce to new highs 😁

Is it SDT for Bitcoin?Could Bitcoin pull above the 21 EMA and perhaps spring to a new ATH? Considering the 21 EMA has been very supportive in the past there is no reason to believe it couldn’t happen. Especially this close to the halving, Right? Of course from where we are right now in the area of 6800 we would have to see a rise of just over 190% to reach a new ATH. That's not a bad return!
Staying with the trend however we can see we would only need to drop off about 43% to see a new phase low or; about 54% to see a new low in this Elliott Wave correction cycle that began in December 2017. At a 60% drop we should see support from the 100 EMA and hopefully it will be off to the races once we get that support.
What is the ADX trying to say? It would appear that the breadth line (W) continues changing from holding steady to just a small pick-up meaning more people are becoming interested. Unfortunately the divergence (B) indicates the support of that interest in the sense of investment strength is waning. Les cash coming to the table. Also waning is the bullish sentiment (G) while the bearish strength (R) is certainly picking up strength, perhaps to take us to our soon to be told destiny.
Remember. This is not trading advice. Follow with me if you like, engage the like button and please add your comments below.


Halving TheoryHere is my Halving Theory
On the facts and data of history I try to find the bitcoin code of all time highs in future
Every time and everywhere in history we see allways things happend again and again
So we see it even in Bitcoin charts there are some things they are allways coming again
alltime highs, halving, hype time, depression time, more or less interesting
If WE know THES time frames it would be much easier to trade btc in future with this knowlegde.
So - let us see if the Bitcoin Code is crackable
Stay Crypto
