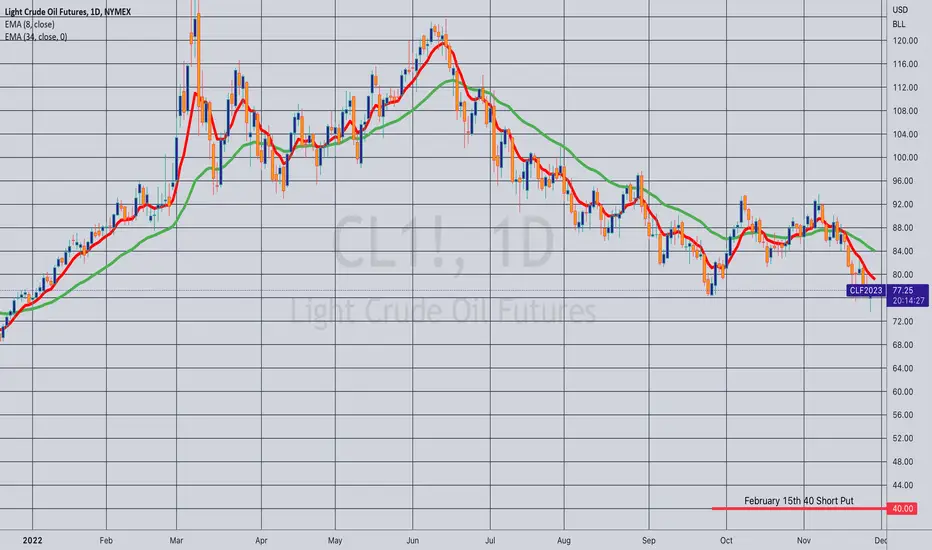
Opening (Margin): /CL February 15th 40 Short Put... for a 1.70 credit.
Comments: Taking a small, far out-of-the-money trade on weakness here, targeting the strike paying around 10% of buying power effect in credit. 1.70 credit on BPE of 16.32; 10.4% ROC at max; 5.2% ROC at 50% max as a function of buying power effect.
Premiumselling
Opening (IRA): SPY June 16th 230 Short Put... for a 2.31 credit.
Comments: Part of a longer-dated strategy in SPY targeting the <16 strike paying around 1% of the strike price in credit to emulate dollar cost averaging into the broad market. Will generally look to roll at 50% max, whenever that occurs.
Naturally, I'll deploy into shorter duration if we get weakness plus a higher implied volatility environment.

Opening (IRA): SPY January 20th 356 Short Put... for a 3.70 credit.
Comments: A 2023 starter position, targeting the <16 delta strike paying around 1% of the strike price in credit.

Opening (IRA): QQQ January 20th 244 Short Put... for a 2.50 credit.
Comments: Starting to deploy a smidge into the new year, targeting the <16 delta strike paying around 1% of the strike price in credit.

Rolling (IRA): QQQ Nov 18th 273 to Dec 23rd 264... for a 2.77 credit.
Comments: Total credits collected of 5.94 (See Post Below) plus the 2.77 here for a total of 8.71.

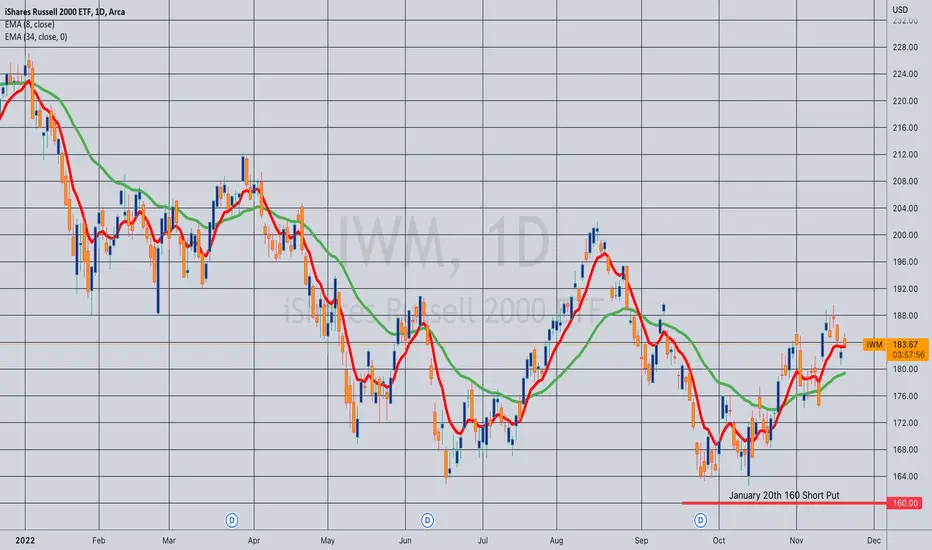
Opening (IRA): IWM January 20th 160 Short Put... for a 1.67 credit.
Comments: Targeting the <16 delta strike paying around 1% of the strike price in credit. Not exactly "ideal" conditions of higher IV/weakness, but haven't got much left on ... .
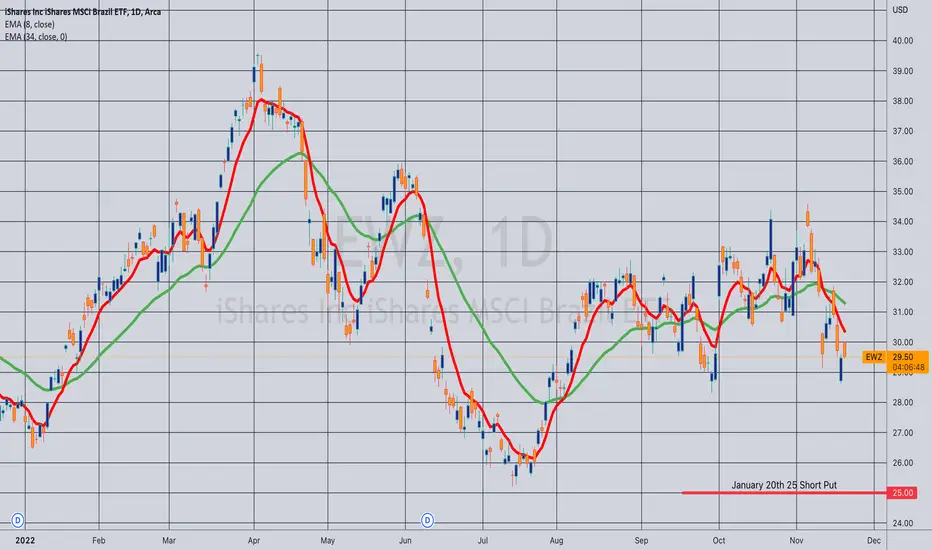
Opening (Margin): EWZ January 20th 25 Short Puts... for a .95/contract credit.
Comments: High IVR/IV at 79/58. .95 credit on buying power effect of 2.52. 37.7% ROC at max, 218.4% annualized; 18.8% at 50% max, 109.2% annualized. Will generally look to take profit at 50% max.
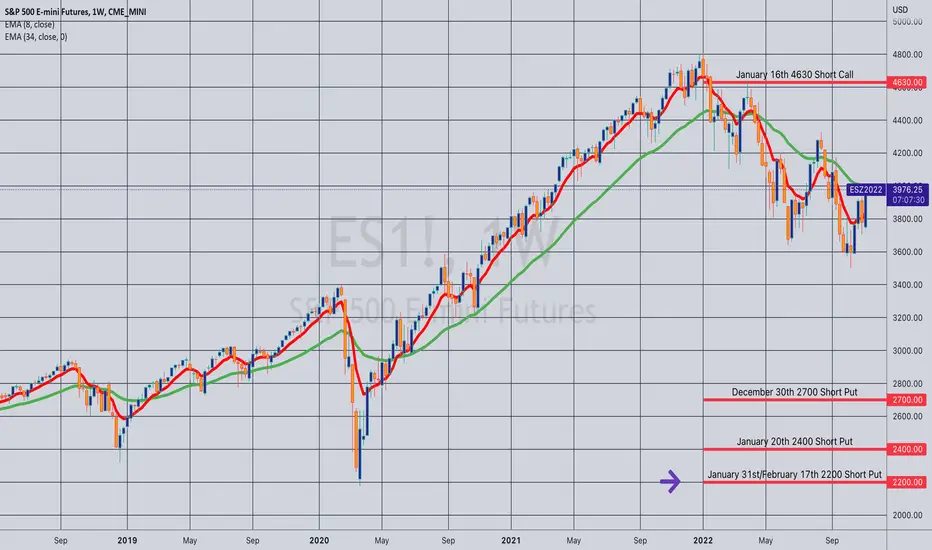
Rolled (Margin): /ES Jan 20th 4630 Short Call to Feb 17th 4730... for a 1.35 credit.
Comments: Rolling for a realized gain and a credit. Total credits collected of 3.10, plus the 1.35 here, for a total of 4.45.

Opened (Margin): /ES February 17th 2200 Short Put... for a 3.20 credit.
Comments: SPAN margin lets you do weird things on occasion. Added this rung nearly buying power free Thursday night, probably because the SPAN margin calculation evaluated the risk of this addition and thought that it increased my "holistic" or "global" risk only marginally (the BPE was < the credit received).
Rolling (IRA): HYG November 18th 69 to December 16th 69... for a .35/contract credit.
Comments: With the November 18th 69 converging on .10, rolling it out for a credit about equal to the monthly dividend. Total credits collected of .42 (See Post Below) plus the .35 here for .77 ($77) per contract.

Opening (Margin): /ES January 20th 2400 Short Put... for a 3.10 credit.
Comments: Adding a second rung to my short put ladder, targeting the <75% of current price strike paying around 3.00 in credit. Will generally look to take profit at 50% max.

Opened (Margin): /ES January 31st 2200 Short Put... for a 3.15 credit.
Comments: 12:30:03 PM. Added a rung on weakness, targeting the <75% of current price strike paying around 3.00 in credit.

Opening (IRA): SPY March 17th 280 Short Put... for a 2.81 credit.
Comments: Part of a longer-dated premium selling strategy in broad market to keep theta on and burning while I wait for shorter duration to be more productive. Targeting the <16 delta strike paying around 1% of the strike price in credit. Will generally look to roll either intraexpiry or for duration at 50% max.
I'm also looking to attempt to remain more maximally deployed, which can be difficult if you're going to do things primarily this way versus some mix of long stock positions (which tie up oodles of buying power) with premium selling positions as an add-on or as an acquisitional approach (i.e., short put, acquire, cover). One way to look at these longer-dated positions is that they're small stock positions (which people are generally more comfortable with holding for extended periods of time), even though they differ in one fundamental way, and that's they're dynamic (as opposed to being static delta, as stock would be).
Additionally, the ROC as a function of buying power effect (annualized or otherwise) isn't exactly fabulous out of the box, which is why you'll want to roll these at 50% max to collect additional credit (without extending duration if you can) to bring in more of "the fabulous."

Opened (Margin): EWZ December 16th 25 Short Put... for a .75 credit.
Comments: Weakness plus high IVR/IV at 64/50. .75 credit on buying power effect of 2.53. 29.6% ROC at max; 14.8% at 50% max.

Opening (IRA): SPY February 17th 306 Short Put... for a 3.15 credit.
Comments: Re-erecting a rung out in February, targeting the <16 delta strike paying around 1% of the strike price in credit. I stripped off quite a bit of long delta over the past few weeks and want to make sure I have at least some theta on and burning, while reserving quite a bit of dry powder on for future deployment.

Rolling (IRA): IWM Nov 18th 173 Short Put to Dec 16th 164... for a .13 credit.
Comments: The last of my IWM rungs ... . Taking an opportunity to strike improve this while it's still out-of-the-money. Total credits collected of 3.82 (See Post Below) plus the .13 here for a total of 3.95.

Rolling (Margin): XOP November 18th 127 Short Straddle... to the December 16th 128C/133P inverted short strangle for a 4.02 credit.
Comments: Rolling out at 21 days to go to reduce "random" assignment risk on the short call. Total credits collected of 21.96.
I've gone slightly inverted here as well as improved the short call strike a smidge to keep the short delta metrics similar to what they would be were I to be in a covered put with a 40 delta short leg. This results in delta/theta -60.27/15.68 with a call side break even off 149.96. A "perfect" finish would be in between the strikes, but I'm looking to basically scratch this out or make something small on it.

Rolling (IRA): QQQ October 21st 278 Short Put to December 2nd... 261 for a 2.83 credit.
Comments: Filled this for a 2.78 credit. (See Post Below). Rolling down and out for a small realized gain and a credit. Total credits collected of 2.78 + 2.83 = 5.61.

Opening (Margin): /ES December 30th 2700 Short Put... for a 3.10 credit.
Comments: Targeting the <75% of current price strike paying around 3.00 in credit. Will add rungs if we experience further weakness ... .

Opening (IRA): SPY January 15th Short Put... for a 3.19 credit.
Comments: Part of longer-dated strategy to emulate dollar cost averaging into the broad market when "local" (<45 days until expiry) IV isn't paying. Targeting the strike paying around 1% of the strike price in credit. Will look to take profit and/or roll at 50% max.

Opening (IRA): QQQ December 23rd 230 Short Put... for a 2.67 credit.
Comments: My weekly broad market short put in the exchange traded fund with the highest 30-day IV, targeting the <16 strike in the expiry nearest 45 days paying around 1% of the strike price in credit.

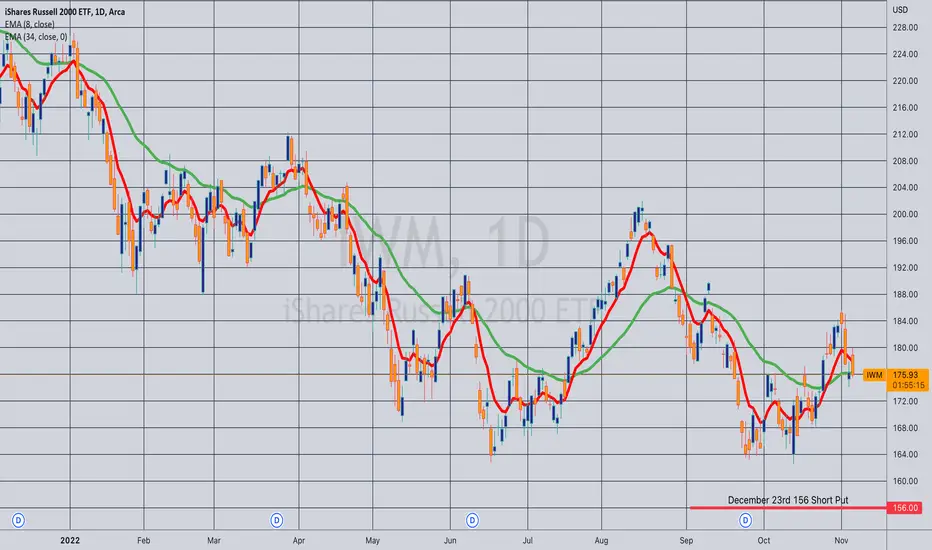
Opening (IRA): IWM December 23rd 156 Short Put... for a 1.67 credit.
Comments: Targeting the <16 strike in the expiry nearest 45 days paying around 1% of the strike price in credit.
This is more about not letting my IWM position get too short delta than about putting on an "ideal" premium selling trade. I still have an IWM short delta hedge on that is marking at around -60 delta (See Post Below) and had only one IWM short put rung on at the December 16th 164 (+23 delta at the moment), so the position was leaning more net delta short than I would like. This long delta additive trade will make my IWM position "net delta flatter."
Opening (Margin): /ES January 20th 4630 Short Call... for a 3.10 credit.
Comments: Short delta hedge against my short put ladder on strength.
