EURJPY Eyes New Highs After Pullback?What I see!
EURJPY Technical Outlook –
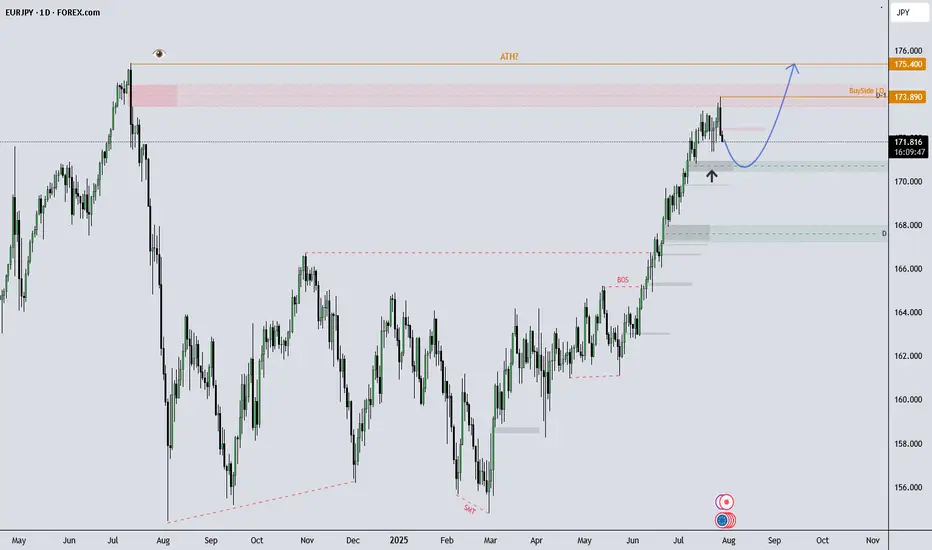
EURJPY remains in a strong uptrend and recently tapped into buy-side liquidity at 173.89, which now marks the All-Time High (ATH). After a brief rejection from that level, price is currently showing signs of a healthy pullback.
I’m observing the 170.00–171.00 zone, which aligns with previous demand. If price continues to respect this area, the overall bullish structure remains intact, with potential for a move back toward (and possibly beyond) the ATH.
A sustained break below 170.00 could indicate room for a deeper pullback, potentially toward the 168.00s, which would be a key area to monitor.
This analysis is shared for educational and discussion purposes only.
Pricaction
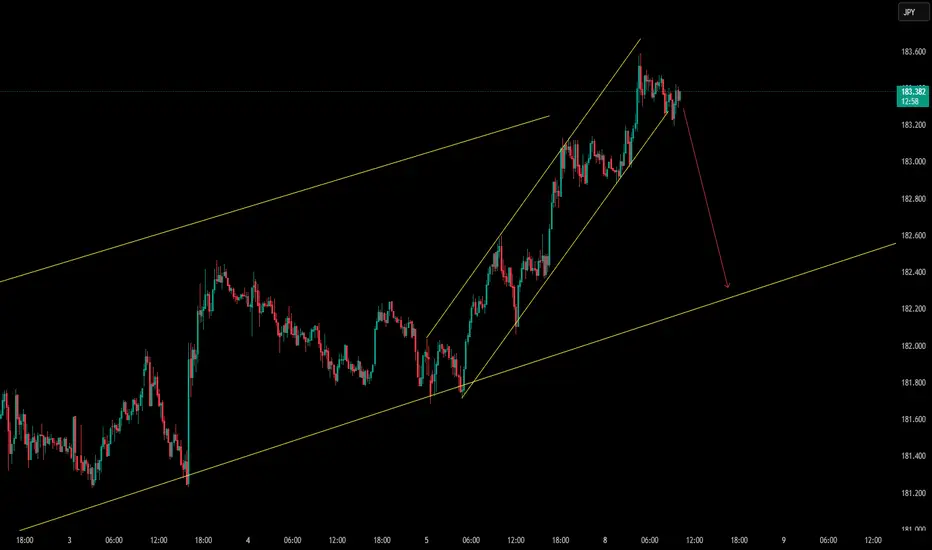
This pullback is necessary to maintain the channel structure.OANDA:CHFJPY
We're in an ascending channel on the higher time frame, and based on candlestick patterns, I expect a minor crash as the market tests the bottom of the channel.
Stay with me so we don't miss the move. ✅
Bitcoin Analysis: Risk under 108k, aiming 111k+ in continuation__________________________________________________________________________________
Technical Overview – Summary Points
__________________________________________________________________________________
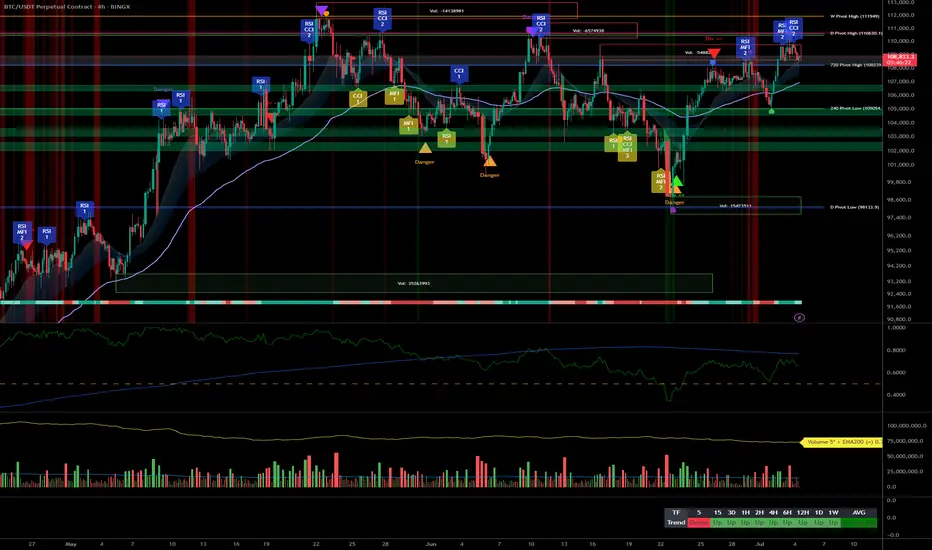
Momentum: Strong uptrend across all major timeframes (MTFTI “up”). Buyers remain in control; daily/4H/1H structure robust.
Key supports: 108,239.1 (720min Pivot, critical transversal support), 105,054.7 (240min Pivot), 99,581 (240min Pivot). Active defense seen on 108,239.1 at all timeframes.
Main resistances: 110,630.1 (1D), 110,483.1 (240min), 111,949 (W). The 110–111k area acts as the short-term ceiling.
Volume: Moderate activity, no spikes or climaxes, slight intensification noted on the 30min during key tests.
Risk On / Risk Off Indicator: “STRONG BUY” signal on all Tfs ≥30min, contributing to marked bullish momentum. Minor short-term divergence only on 15min.
Multi-TF behavior: ISPD DIV and Investor Satisfaction are neutral, no extreme behavioral stress; psychology is balanced, neither panic nor euphoria.
__________________________________________________________________________________
Strategic Summary
__________________________________________________________________________________
Overall bias: Bullish, synchronized multi-timeframes, dominant bullish liquidity.
Opportunities: Optimal long entries on validated pullback to 108,239.1, add on breakout of 110,630–111,949. Gradual partial take profit recommended in the 111k area.
Risk zones: Invalidation below 108,239.1 (confirmed H2 close), risk of further correction toward 105k then 99.5k; suggested swing stop under 108,000.
Macro catalysts: No major event, global markets stable. Geopolitical tensions monitored, low short-term impact.
Action plan: Prioritize “buy the dip” on pivots, active monitoring for any breakout/failure. Dynamic stop management, partial profit-taking on extension.
__________________________________________________________________________________
Multi-Timeframe Analysis
__________________________________________________________________________________
1D: Very strong daily structure, high momentum, intermediate supports near 98k/100.5k. Watch for major resistances at 108–111k.
12H/6H/4H: Ranging below 110–111k resistance, no fragility. Supports 108,239.1 and 105,054.7 holding, no selling pressure detected. Watch for breakout/impulse.
2H/1H: Buy zone if maintained >108,239.1, risk of sell-off below this pivot toward 105k. Price is ranging, momentum remains positive.
30min/15min: Consolidation on supports. 15min: temporary divergence on the Risk On / Risk Off Indicator but bullish structure intact unless a clean break below 108,239.1.
Risk On / Risk Off summaries: Dominant “strong buy” tone, synchronized momentum, only weak short-term divergence. No behavioral stress (ISPD DIV neutral everywhere).
__________________________________________________________________________________
Cross-analysis and recommendations
__________________________________________________________________________________
Momentum: Bullish environment sustained as long as >108,239.1. Continued upside bias if breakout above 110–111k is confirmed.
Risks: No major vulnerabilities detected. Very low probability of a local top, except in the case of exogenous macro shock.
Macro & On-chain: Stable newsflow, no distribution from HODLers or significant new inflows. Preferred strategy: swing trading in trend direction, tight stop under the main pivot.
__________________________________________________________________________________
Decision summary
__________________________________________________________________________________
Preferred scenario: Hold long >108,239.1, add on validated pullback, look for breakout with volume extension to 111k+.
Risk management: Stop under 108,000, partial profit-taking in the 110,630–111,949 area.
No immediate macro constraints: Use this calm window to ride the trend.
Monitoring: Resilience of the main support, any sudden geopolitical shocks.
BTC/USDT keeps a clear bullish bias, favoring swing or trend-following strategies as long as key pivots hold. Buy the dips remains optimal while technical structure holds; strict stop management is advised pending any “breakout fail”.
BHARTIARTL : Took a position for 1% riskEntered the position on a breakout above the all-time high, confirmed by a strong momentum candle and no immediate signs of retracement. The risk is of 1%.
📢📢📢
If my perspective changes or if I gather additional fundamental data that influences my views, I will provide updates accordingly.
Thank you for following along with this journey, and I remain committed to sharing insights and updates as my trading strategy evolves. As always, please feel free to reach out with any questions or comments.
Other posts related to this particular position and scrip, if any, will be attached underneath. Do check those out too.
Disclaimer : The analysis shared here is for informational purposes only and should not be considered as financial advice. Trading in all markets carries inherent risks, and past performance is not indicative of future results. It’s essential to conduct your own research and assess your risk tolerance before making any investment decisions. The views expressed in this analysis are solely mine. It’s important to note that I am not a SEBI registered analyst, so the analysis provided does not constitute formal investment advice under SEBI regulations.

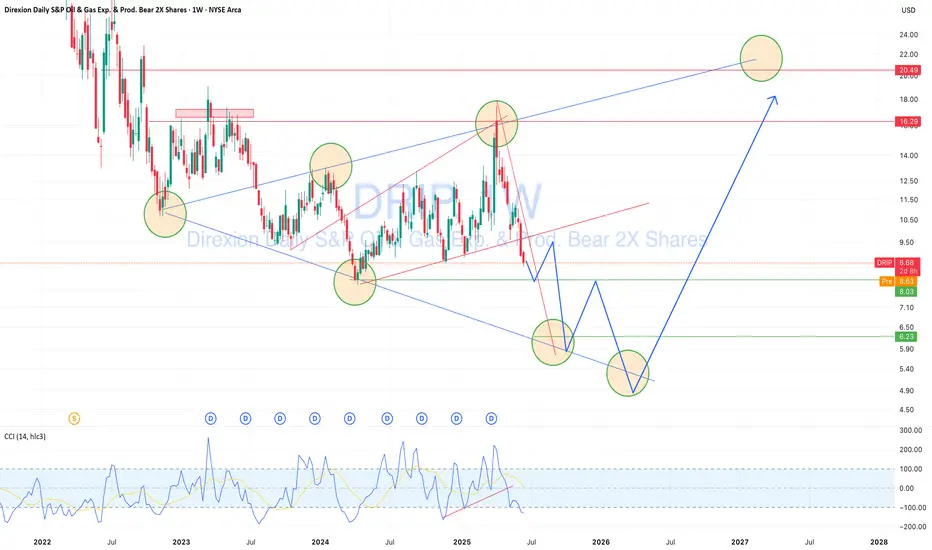
DRIP — Geopolitical Oil Risk Creates a Buying OpportunityDRIP (inverse 2x ETF on US oil & gas exploration/production) is approaching a key technical support zone.
While oil may continue rising short term due to geopolitical tensions — especially US-Iran risks and Middle East instability — this short-term pressure could push DRIP lower toward the $5.00–6.00 area. That zone aligns with strong historical reversal points and trend support. From there, a rebound toward $12.00–20.00 is technically and fundamentally possible, offering 30–50%+ profit potential. I’m planning staged entries in the marked range, managing risk with awareness of commodity market volatility and global uncertainty.
Is This the Calm Before the Storm on AUD/USD?The AUD/USD pair is currently consolidating within a sideways range, indicating indecision in the market. Price is fluctuating between key horizontal support near 0.6150 and resistance around 0.6450.
A rising trendline is providing strong dynamic support, keeping the pair from breaking lower, while a descending resistance line continues to limit upside momentum. As long as the pair remains within this range, no clear trend is confirmed.
A breakout above resistance could signal a bullish shift, while a breakdown below the trendline may open the door for further downside.
If you find our analysis helpful, don’t forget to like and follow us.
THANK YOU
DYOR, NFA

Bitcoin’s Next Move Major Breakout or Breakdown ?Chart Pattern
The chart displays range-bound trading between key levels of $91,535.66 (support) and $95,752.48 (resistance).
A recent pullback from the upper resistance indicates potential consolidation before the next significant price movement.
Key Insights
1.Current Price Action
Bitcoin is trading near $94,181.41, below the immediate resistance zone of $95,752.48.
The price has been rejected multiple times at the upper resistance, signaling a strong supply zone.
2. Potential Breakdown Scenario
If BTC breaks the $91,535.66 support, the next potential downside target could be $90,000 or lower.
Volume confirmation and momentum indicators would be crucial for validating a downward continuation.
3.Bullish Reversal Possibility
If BTC holds above $91,500, it may bounce back to test $95,750 again.
A breakout above $95,750 could target higher levels, with $100,000 being the psychological resistance.
Trading Plan
Bearish Setup
Short below $91,500 with a target of $89,500–$90,000.
Bullish Setup
Long above $95,750, targeting $98,000–$100,000.
Market Sentiment
Neutral to Bearish, Caution is advised until clear breakout/breakdown confirmation is observed.
The market remains unstable, with both upside and downside risks. Stay alert for macroeconomic news and BTC dominance trends.

Trade idea - EURAUD Short4H
Bearish impulse: indication.
Head & Shoulders pattern: confirmation.
Clear support & resistance zone is there.
Corrective approach towards entry zone.
= Instant market execution Sell.
1.5% risk.

Trade idea - NZDCAD Long4H
Corrective approach towards entry zone.
-68 Fibonacci completion aligning with entry zone.
= Buy limit set.
0.75% risk.

Preferforex Analysis on USDCADUSDCAD is currently in an uptrend based on both the daily and 4-hour views. The short-term break of the structure occurred at the 1.3745 level. Currently, the price is retracing downwards and heading towards a strong point of interest (POI)/demand zone. A further bullish movement is expected once the price touches and reacts from this demand zone.


EURNZD - Wait For The Bulls ↗️Hello TradingView Family / Fellow Traders,
📈 EURNZD has been overall bearish, trading inside the falling channel in red and it is currently approaching the lower red trendline.
Moreover, the zone 1.73 is a robust support level.
🎯 Therefore , the highlighted red circle represents a significant area to consider for potential buy setups, as it marks the intersection of the blue support and lower red trendline.
📚 As per my trading style:
As EURNZD approaches the red circle zone, I will be actively searching for bullish reversal setups to capture the next bullish impulse movement.
📚 Always follow your trading plan regarding entry, risk management, and trade management.
Good luck!
All Strategies Are Good; If Managed Properly!
~Richard Nasr

SELL TRADE SETUP ON USDCHFHey Traders,
Check out this technical analysis on USDCHF.
USDCHF is currently trading with bearish momentum, so anticipate a retest of the broken support level and consider entering SELL positions.
Keep a close eye on this; it could play out in either direction.

SasanSeifi 💁♂ BTC/USDT 4H🔹 as you can see, after a bit of back-and-forth around the resistance zone, the price took a bit of a breather and is currently hanging out in the $36,400 range. No major trend shift is happening – it's more of a side-to-side dance at the moment. Here's the scoop: If the price manages to chill between $36,000 and $35,500, giving us a nod with positive vibes, we might see some good moves ahead.
Now, keep an eye on how the price reacts around those support zones for a better feel of where it's headed. On the flip side, if the price decides to dip below $35,500 and hangs out there, brace yourself for a potential medium-term correction down to around $34,000 and maybe even down to the liquidity Void at $32,000. Stay tuned for the market's next move!! 📈✨
🟢 Keep in mind, it's essential to perform your own analysis and take into account additional factors prior to making any trading choices. Best of luck! ✌️
❌ (DYOR)
Sure, if you have any more questions or need further clarification, feel free to ask. I'm here to help!
if you found my analysis helpful, I would appreciate it if you could show your support by liking and commenting. Thank you!🙌✌

USDJPY WEEKLY PLAN UPDATEHI all
I was aiming for a 50% retracement between the high (151.946) and the low (127.220)
The USDJPY is currently slightly bullish following a breakout from the consolidation area. which has a highest price of 132.908 and a lowest price of 130.570
My trading strategy isn't intended to be used as a signal service. It's a process of gaining knowledge of market structure and improving my trading abilities.
Like and subscribe and happy trading to all. cheers

AUDCAD 1HHello friends
Considering that I think the gold market is bearish, I think this movement is possible for this currency pair

Market Cycle (EUR/USD) MARKET CYCLE - EUR/USD - BACK TEST - PRICE ACTION 05.13 - 20 july 2022 ( how to create your own strategy) first step!


EURNZD SELL trade active EURNZD double top rejection
Price approached double top zone within a bearish pattern
Price had an impulsive move to the downside and a bearish wedge pattern on the LTF.
EURNZD SELL
Entry: 1.66278
Sl:1.6672
Tp:1:6365
RRR: 1:6.32

CAD/CHF - 1H/4H - Short !FX:CADCHF
Dont forget Money Managment !
Dont Forget Risk Free !
this position is a little High Risk !

COTI | Next MoveWe have a breakout from the resistance. It can go up fast.
Entry : about 0.123
Targets : from 0.154 to 0.161
Stop : 0.121
❤ Thanks for your attention ❤

US30 Price action Breakdown 3/10/22I think US30 can continue bullish until it reaches the 4H TF trendline where there could be a huge rejection and the continuation of the bearish trend. With the increase in prices due to inflation and recent sanctions, the economy could take a hit and lead to a huge sell off in the markets. We will see what price decides to do during the NY open tomorrow.
1.Price is forming higher lows
2. A break below 33040, can continue bearish until the bottom of the range at 32900
3. A break and close above 33275 can continue bullish until the high at 33420
