Eur/UsdI can see a good head and shoulders and the perfect resistance so let's go to use fibonacci to know how much going to low
Priceaciton

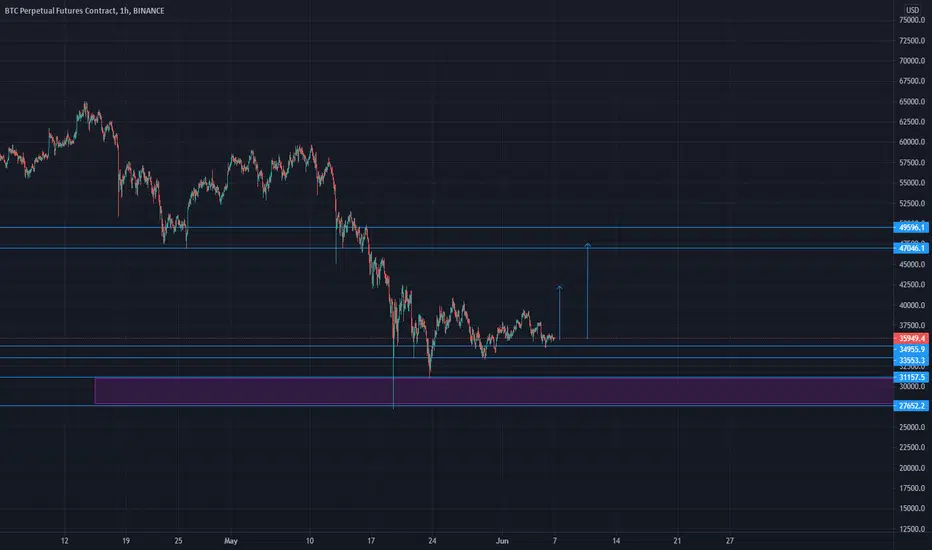
Bitcoin is making baseHello friends
According to supply and demand theory, due to strong rejection in Bitcoin, I think the price of this currency will increase.
Bitcoin analysis(BTCUSD ) on 4 hour chart
__There is an inverted head and shoulders pattern (black color)
__ Exceeding the descending channel and forming an ascending channel (red)
__ He broke through the neckline at 55134 and scored the first goal 56780, then the second goal 58514, correcting it to 56999 and returning back.
__ He now has three Buying Goals: (green clip)
1) = 58514, which is the same as the second target previously
2) = 59559
3) = 60720, which is the fourth and last target
__ May reverse at 59559.
__ Do not forget that it is difficult to exceed 61,455 on the daily chart in the Wyckoff stage

Price Action analysis of USDJPYThis currency has been in an uptrend for weeks now. there's a strong resistance @ 109.600 and 109.150. THESE TWO LEVELS HAS BEEN RESISTING THE BULLS FROM RALLYING. ACCORDING TO MY ANALYSIS THE PAIR IS GOING TO RALLY THE DOWNSIDE SOON TO 106.1. THERE'S A REJECTION @ THESE LEVELS. LETS KEEP OUR EYES ON TIS PAIR.


Could the Bears Push the CAD/JPY to the 81.16 Level?💡 Trade Idea
📈 Sell Order CAD/JPY @ 81.16
🎯 Target Profit 80.61
🛑 Stop Loss 81.31
❌ Do not risk more than 1 % of your account on each trade
🙂 Good Luck !
Description:
The price was trading withing a wedge formation after showing a head and shoulders on higher time frame indicating a potential reversal from upward movement to a downward one. The price managed to break the trendline, by posting a bearish candlestick signaling a potential downward movement.

it's time to sell US NAS 100after a a flat formation and a push down we expect a move down for Nasdaq index

EOS BitMEX Analysis - Possible Trade Set-upPrice is rejecting the Resistance Zone. I expect price to go atleast go down till the mid.
We can see price is sideways after a Bear Leg.
Disclaimer
Trade at your own risk. This is not a financial advise. We are not registered/licensed organisation for Financial Services.

GBPUSD Idea for next week
Wait for a LH Formation to take a sell if it is presented
Wait for Price action to do its thing


GOLD H4: Potential sell opportunity?Hello guys!
Gold ist currently testing an interesting area of resistance on H4. We got a first rejection candle there. Now I´ll look at lower time frames for a short opportunity.
Best Regards,
Becker Investments

EURGBP PRICE ACTIONpossible bull rally,
entry based on reversal candle
set SL/CL 30 -40 pips from entry price depend on your risk tolerant
set BE when price move over 30 pips from entry
cut losses run winners
RM,MM is a must
good luck and happy trading. TQ

EURUSD bullishBased on market crash a few weeks ago, USD from a personal perspective is looking bullish as it is trying to pick up with Trump pumping 2 trillion USD to prevent a market collapse. Eurusd looking bullish.
Look for entries in the blue zone.


Softbank Japan PricewatchThere is room for short-term SHORT positions
Long Term LONG Entry is after the realization of short-time selldown to3784.
This is not a financial advice.


ORB Nr4 CANDLESTICK PRICE ACTION DAILY STRATEGYStep #1 How to Identify the ORB Nr4
The ORB pattern is defined as a trade taken at a fixed value of the opening range.
The Opening range Breakout trade is more effective if taken after an inside day that has its daily range smaller than the previous 3 days, which is where the Nr4 stands for. You have three candles followed by another candle with a daily range narrower than the previous three days.
Note #1: The 4th day doesn’t necessarily need to be an inside day, it only needs to have its daily range smaller than the previous 3 days. However, inside days tend to produce a higher success rate.
The ORB Nr4 pattern can be the best candlestick patterns for intraday trading too. You simply have to apply the same rules outline in this guide on your favorite intraday chart
What if we told you that, 40% of the time the first trading hour can tell you what is the high and the low of the day. Our candlestick patterns strategy incorporates this price behavior so you can better manage your risk and set your targets.
Basically, you can become a proficient trader.
Like with all our trading strategies we’re going to give you first the trading rules by going through an actual live trade example that uses the best candlestick patterns mentioned through this PDF guide.
Step #2: Identify the best candlestick patterns and mark the high and the low of the 4th candle
When you search for the ORB Nr4 candlestick chart pattern keep in mind two things:
The Daily range of the 4th candle needs to be narrow and smaller than the previous 3 candles.
The 4th candle price range also needs to be inside the candle number 3.
The ORB Nr4 pattern in the chart above is a bullish candlestick patterns because it leads to a bullish move.
Narrow daily trading ranges suggest contraction. And contraction always leads to expansion. This is kind of a general rule because the markets do move from periods of contractions to periods of expansion.
This is the reason why this ORB Nr4 candlestick pattern is so powerful.
Step #3: Switch to 1h TF and Buy if we break the high, Sell if we break the low of the Nr4 candle.
Our trade is taken the next day after the Nr4 pattern showed up. In order to have a clear view of the short-term price action we need to switch our focus to the 1 hour time frame.
Note #2: Only Buy or Sell if the breakout happens during the first 5 hours of the new trading day.
We use the Opening Range Breakout technique to time the market and have an effective trade entry.
Trades based on the ORB – Nr4 candlestick chart pattern will show you a profit instantly.
Now, if the trade is not showing you a profit right away than your trade becomes more vulnerable. As a general rule, if after the first trading hour your trade is not in the green, you can safely close the trade at the market.
Of course, you can only do that if your stop loss hasn’t been triggered in the meantime.
Step #4: Place SL below NR4 day low,
Step #5: Take profit using a trailing SL below each 1h candle low/high
For buy trades, hide your stop loss below Nr4 day low. The ORB – Nr4 pattern tends to precede strong trend day activity, so your stop loss should be rarely hit.
Our take profit strategy is fairly easy and it’s slightly modified from the original strategy highlighted in the “Day Trading with Short Term Price Patterns and Opening Range Breakout” book written by Toby Crabel.
Even though the ORB nr4 pattern tends to lead to trend trading days we’re more conservative and want to quickly
take profits. We would trail our SL below each 1h candle low and wait for the market to reverse to take profits.

audjpy short scenario1- 0.8200 and 0.830 support/resistance round levels rejection
2- Objective Trendline IN BLUE
3- one histogram divergence on MACD in blue
Waiting for a momentum candle close below our last swing standing to sell

USDCHF Rising/Bearish Flag Expectation (H&S completion)We expect this pair to fall because of the BEARISH FLAG,
there will be 2 things that we expect when we reach 0.7470
1. Rejection that will form double bottom with target 0.7860
2. Breakout that will satisfy the bearish flag continuation with target 0.7235
OANDA:USDCHF
CHECK OUT & LIKE FACEBOOK PAGE facebook.com
whatsapp: +267 71738431
