07.08.25.25 Morning ForecastPairs on Watch -
FX:CADJPY (Live position)
FX:EURNZD
FX:EURCAD
A short overview of the instruments I am looking at for today, multi-timeframe analysis down to what I will be looking at for an entry. Enjoy!
Priceaction

AUDCHF - Already Overbought!Hello TradingView Family / Fellow Traders. This is Richard, also known as theSignalyst.
📈AUDCHF has been overall bullish trading within the rising channel marked in red and it is currently retesting the upper bound of the channel acting as an over-bought zone.
Moreover, the blue zone is a strong weekly resistance.
📚 As per my trading style:
As #AUDCHF approaches the red circle zone, I will be looking for bearish reversal setups (like a double top pattern, trendline break , and so on...)
📚 Always follow your trading plan regarding entry, risk management, and trade management.
Good luck!
All Strategies Are Good; If Managed Properly!
~Rich
Disclosure: I am part of Trade Nation's Influencer program and receive a monthly fee for using their TradingView charts in my analysis.

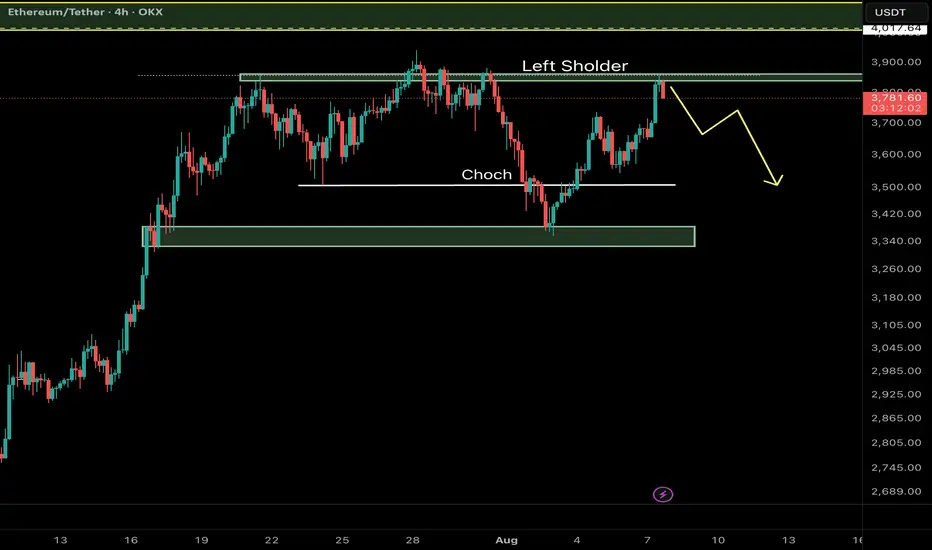
Ethereum (ETH/USDT) – Key Reversal Zone RetestAfter a major CHoCH (Change of Character) on the 4H timeframe, Ethereum has shown a strong bullish move from a high-probability demand zone and is now retesting a critical resistance area aligned with the Left Shoulder of a classic RTM pattern.
⸻
🔍 Key Technical Elements:
• CHoCH confirms the shift from a distribution phase to accumulation.
• Strong reaction from a demand zone near $3,340–$3,380.
• Price is now testing the Left Shoulder, which often acts as a reaction zone before continuation.
⸻
📌 Potential Scenarios:
🔼 Bullish Case (Primary):
If ETH breaks and closes above $3,870, a move toward the next liquidity pool around $4,010–$4,050 is likely.
🔽 Bearish Case (Alternative):
Failure to hold above the current resistance may lead to a pullback toward the $3,340–$3,380 demand zone for another accumulation attempt.
⸻
💡 Educational Note:
In RTM methodology, retests of the Left Shoulder after CHoCH are considered one of the most efficient entry zones — especially when confluence with liquidity voids or imbalance exists.
Follow for more Smart Money & RTM insights.
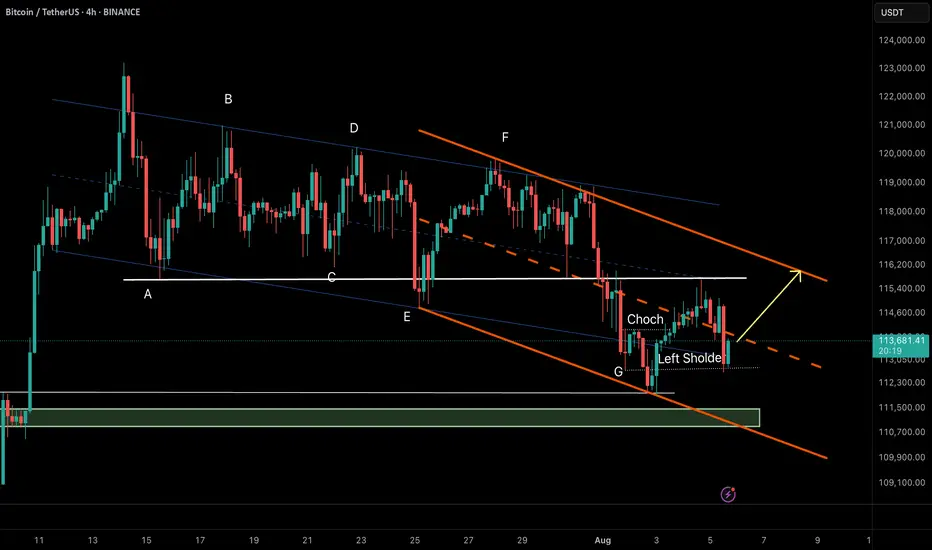
Bitcoin (BTC/USDT) – RTM Reversal Pattern in Action🔸 Market Structure:
Bitcoin has formed a descending channel after a prolonged correction. Recently, price tapped the channel bottom and printed a CHoCH (Change of Character), indicating a potential reversal.
The price has now retraced to the left shoulder of a potential inverse head & shoulders pattern—an RTM classic structure—which held as support, suggesting bullish continuation.
⸻
🔸 Key Technical Signals:
• ✅ CHoCH confirmed at demand zone near $112,300
• ✅ Retest of the left shoulder validates bullish structure
• ✅ Holding above the internal bullish trendline
• ✅ Price aiming toward upper channel resistance
⸻
🎯 Target:
$116,200 – Top of the descending channel & next key resistance.
❌ Invalidation:
Break and close below $112,800 would invalidate the current RTM setup and open room for deeper correction.
⸻
📌 Summary:
This is a textbook RTM reversal:
CHoCH → Retracement → Left Shoulder Test → Continuation
As long as the structure holds, we remain bullish toward the channel top.
Minor Bullish Signs Inside Gold’s Bearish Range▋Observation & Meanings:
▪Price is currently trading within a broader range.
▪After touching the bottom of that range, price bounced and took out the prior high — signaling a potential minor uptrend beginning to take shape within the range.
▋Critical Questions:
🔹 Is the surge reliable?
▪Rather than reacting to a surge, it’s more constructive to wait for a clear uptrend. A valid uptrend only takes shape when price starts forming higher lows .
▪Also, recent behavior within the range suggests bearish pressure remains. Tops are rejected sharply, while bounces from the bottom are slower and more choppy.
🔹 What opportunities might be next?
1. A potential long trade toward the top of the range:
▪Look for price to pull back, form a higher low, then push through the previous high in one clean move.
▪The opportunity comes when the price retests the prior high, confirming a resistance-turned-support level.
▪Interesting finding: $3,387 might act as a strong resistance level . The last two bounces from
the bottom of the range both advanced about the same distance before pulling back. Could this time play out the same way?
2. Short opportunities inside the range:
▪This aligns with the current bearish skew .
▪Potential setups to watch for:
- A consolidation that breaks to the downside.
- When price drops through the bottom of the range without hesitation or buildup, it reinforces the bearish bias .
▋Mental Notes:
▪Range-bound markets can still provide opportunity — if you're clear about risk and structure.
▪Don’t predict the price, trade the price. Have a plan, but not blindly follow.
▪The market will always find ways to surprise. Stay open and follow the flow.
If you find the analysis helpful, drop a 🚀 to show some support — always open to thoughts and discussion!
▋Not Financial Advice:
The information contained in this article is not intended as, and should not be understood as financial advice. You should take independent financial advice from a professional who is aware of the facts and circumstances of your individual situation.

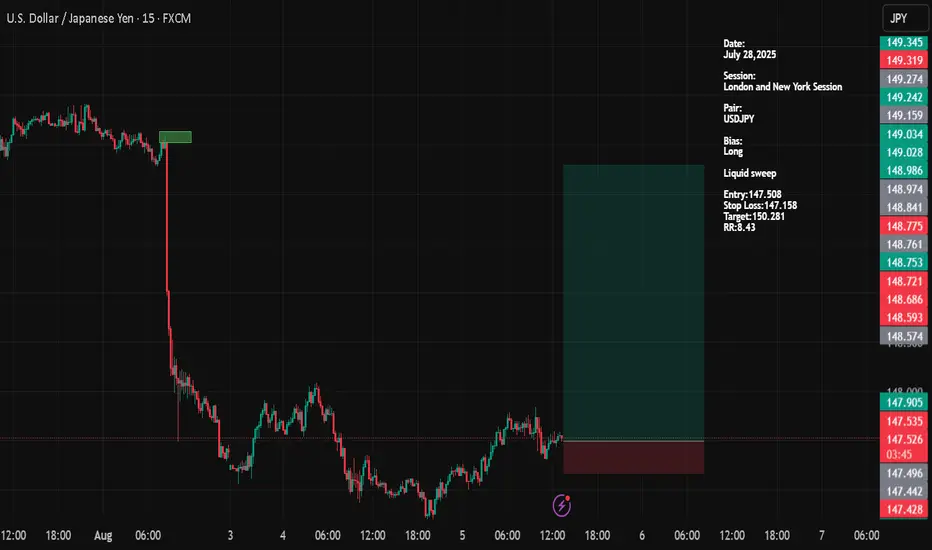
USDJPYDate:
August 05,2025
Session:
New York Session
Pair:
USDJPY
Bias:
Long
Liquid sweep
Entry:147.508
Stop Loss:147.158
Target:150.281
RR:8.43
06.08.25 Morning ForecastPairs on Watch -
FX:GBPAUD
FX:EURAUD
FX:EURUSD
FX:EURCAD
A short overview of the instruments I am looking at for today, multi-timeframe analysis down to what I will be looking at for an entry. Enjoy!

GBPUSD 4H: retest done - bearish continuation beginsOn the 4H chart, GBPUSD has completed a textbook head and shoulders pattern. The neckline has already been broken, and the price is now finalizing a retest around 1.3365–1.3380, where the 0.5 Fibo level also lies. This confirms a trend reversal, with the market preparing for the next leg down.
MA and EMA are above the current price, adding pressure to the downside. RSI remains neutral, and volume is shifting in favor of bears. The key resistance zone at 1.3365 has been tested from below, and the price is beginning to roll over - a classic bearish continuation signal.
Targets: 1.3240 first, then 1.3150 and potentially 1.2 870 if momentum builds. The invalidation point is a close above 1.3365, which is not likely at this stage.
Fundamentals support the move: the dollar remains strong as the Fed holds its hawkish stance, while the UK economy continues to show weakness across services and manufacturing.
Neckline broken ✅
Retest done ✅
Momentum building ✅
The setup is complete — time to follow the structure.

GBPCADDate:
August 7, 2025
Session:
Tokyo Session
Pair:
GBPCAD
Bias:
Short
Targeting liquid from last Friday and Wednesday
Entry:1.83562
Stop Loss:1.83882
Target:1.82453
RR:3.51

BUY USTEC 7.8.2025Confluence order: BUY at M15
Type of order: Limit order
Reason:
- The current top is not touching anything, expected to rise to the sub-key of H1~M15 above.
- M15~FIBO 0,5-0,618 (same position)
Note:
- Management of money carefully at the last bottom (23,,367)
Set up entry:
- Entry buy at 23,339
- SL at 23,317
- TP1: 23,367 (~1R)
- TP2: 23,403 (~3R)
- TP3: 23,459 (~5R)
Trading Method: Price action (No indicator, only trend and candles)

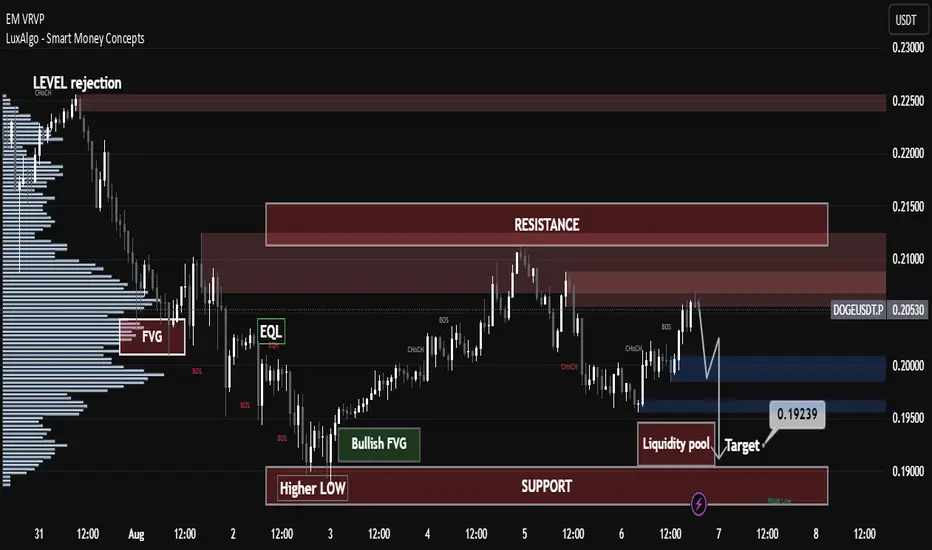
IS DOGE Losing Steam or Gearing Up? Pro-Level Market Structure IS DOGE Losing Steam or Gearing Up? Pro-Level Market Structure
📊 Technical & Trend Analysis
Current Price & Structure:
DOGE is trading around $0.2058 and has recently fallen below both the ascending trendline since late June and the 50‑day EMA (~$0.20), signaling weakening momentum
Resistance & Support Levels:
Major Resistance: ~$0.21–$0.212 — price has repeatedly failed at this zone, forming a possible bearish flag or resistance trap
X (formerly Twitter)
+15
Mitrade
+15
Cryptonary
+15
.
Support Zones: Key levels around $0.196 and $0.18, breach of these may open path to $0.15 or lower short-term
Mitrade
.
Trading Sentiment & Derivatives:
Rising short interest and negative funding rates in futures suggest growing bearish sentiment among traders. Long-short ratio is near 0.86—indicating more shorts than longs
Binance
+1
.
🎓 Technical Setup Summary (Educational Breakdown)
Chart Pattern: Potential bearish continuation forming with flag or descending consolidation after breakdown.
Momentum Indicators: Weak RSI and MACD below zero typically align with this structure—though check live chart from platforms like TradingView or Investing.com
Investing.com
.
Trade Selection Approach:
Short Trade Setup: Wait for confirmation below $0.196 to test trend continuation toward $0.18 or $0.15. Stop-loss above $0.202–$0.205.
Long Trade Setup: If DOGE reclaims $0.21 with volume and breaks above the broken trendline + 50‑day EMA, potential rebound toward ~$0.225 or higher. Stop-loss below $0.20.
🔮 Forecast & Outlook
Short-Term: Likely consolidation or correction toward $0.18 unless bullish momentum resumes. Analysts eye potential targets around $0.199–0.215 in early August, rising maybe toward $0.232 by mid-August if sentiment snaps back
Binance
+2
Indiatimes
+2
Indiatimes
.
Medium to Long-Term:
Some speculative projections place DOGE near $1 by year-end, driven by hype cycles, meme coin revival, celebrity tweets, and ETF optimism. That being said, DOGE’s unlimited supply makes $1 an aggressive target requiring massive capital inflow
Crypto News
+5
Wikipedia
+5
Indiatimes
+5
.
✅ Key Takeaways for Traders & Learners
Concept Insight
Support/Resistance $0.196–$0.18 = bearish supports; $0.21 = strong resistance zone
Trendline & EMA Breaking below trendline/50‑day EMA signals weakening structure
Volume & Funding Increasing shorts and low funding rates hint at bearish pressure
Risk Management Use proper stop-loss zones ($0.196 for shorts, $0.20 for longs)
Catalysts to Watch Whale accumulation, meme hype, ETF news, celebrity endorsements
🚨 Risks & Important Considerations
Volatility & Pump Risks: MEME coins like DOGE are susceptible to pump-and-dump dynamics and social-media driven surges or dumps
Indiatimes
Binance
+1
.
Inflationary Drag: Without a supply cap, DOGE’s price is diluted by thousands of coins mined daily, limiting long-term upward momentum unless demand rises significantly.
Macro Events: Broader economic shocks—such as U.S. tariffs or regulation changes—can rapidly swing sentiment across crypto markets. Recent U.S. tariffs pulled DOGE down ~8% with Bitcoin and Ethereum
Wikipedia
.
🧭 Final Summary
Current Bias: Slightly bearish-to-neutral—downward pressure from technical breakdowns.
Watch Closely: $0.196 support and $0.21–$0.212 resistance; reclaiming one of these defines short-term bias.
Strategy:
Consider short plays below $0.196 toward $0.18.
Consider long plays only after strong breakout above $0.21–$0.212.
Always apply strict risk controls.
—
CADCHF SELLSI entered a sell on CADCHF that I didn’t share earlier. The reason behind the trade was that price mitigated a Daily inefficiency, which caused the 4H bullish structure to flip. After the flip, price pulled back into a well-defined 4H supply zone. I waited for confirmation on the 15-minute timeframe, and once the structure shifted there, the entry was triggered. Price has returned to the entry area, but the trade remains valid as long as the structure is intact. I'm aiming for a nice swing move if price cooperates, and I’ll definitely take partials at the first significant low.

GBPUSD SELL IDEA After seeing the daily timeframe reject the moving average in addition to resistance at1.33125 and also a break of 4hr structure support and also trendline area of support, we could be expecting a push into new lows.

XAU/USD Intraday Plan | Support & Resistance to WatchGold is holding above the $3,369 level after rejecting from the $3,387 resistance zone. Price action remains bullish for now, with structure supported by the rising 50MA, which is acting as dynamic support.
To extend higher, bulls need a clean break and hold above $3,387, which would open the path toward $3,422 next.
If price fails to hold above $3,369, we could see a pullback into the $3,358–$3,344 zone, which remains the first key support. Below that, the next area of interest is the Pullback Zone at $3,329–$3,313 — a former resistance turned support, and a likely area for dip-buying interest.
A break below that would shift focus to the Secondary Support Zone at $3,295–$3,281, where price last launched its breakout.
📌 Key Levels to Watch
Resistance:
‣ $3,387 ‣ $3,422
Support:
‣ $3,369 ‣ $3,358‣ $3,344‣ $3,329–$3,313‣ $3,295–$3,281
🔎Fundamental Focus:
No high-impact data today, but markets may remain reactive.

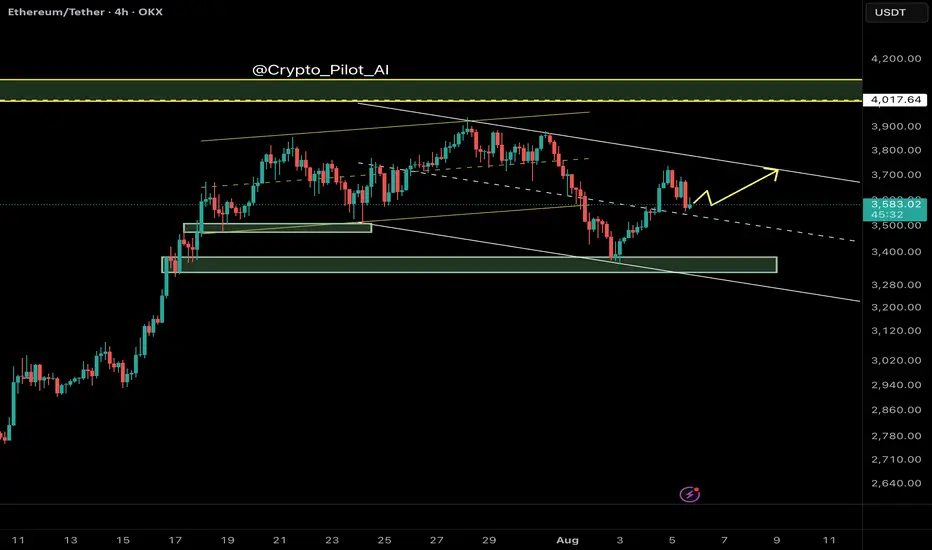
Ethereum (ETH/USDT) – Midline Break Retest and Channel Top in Si🔍 Technical Overview
Ethereum has recently broken above the midline of its descending channel, indicating a potential bullish shift within the short-term corrective structure. The price action suggests that we are currently witnessing a retest of the broken midline, which is now acting as dynamic support.
This behavior is consistent with smart money principles — where a previously broken internal structure gets tested before continuation.
⸻
🧠 NEoWave Context
Structurally, ETH appears to be developing a Contracting Corrective pattern, with the current leg likely evolving as Wave D. This wave typically exhibits strength and complexity, often stretching toward the channel top while still respecting broader consolidation boundaries.
⸻
💡 Smart Money Insights
• ✅ BOS already confirmed on LTF (1H, 4H) with higher lows
• 🔄 Price has reclaimed the internal broken structure (midline) and is retesting it
• 🔋 Bullish OB around $3,480–$3,510 acted as a launch zone for current leg
• 📍 Next resistance is the channel top near $3,740
⸻
📊 Trade Scenarios
🟩 Bullish Scenario (Preferred):
If the retest of the midline holds, ETH is likely to continue its move toward the upper boundary of the descending channel (~$3,730–$3,750). This aligns with Wave D expectations in complex corrections.
🟥 Bearish Invalidations:
A breakdown back below $3,520 and loss of the internal bullish structure would negate this short-term bullish scenario and reopen downside potential toward $3,350.
⸻
⚠️ Trader Tip:
Retests of internal structures like midlines or internal trendlines often provide low-risk continuation setups — if confirmed by bullish internal BOS.
⸻
✅ Conclusion
Ethereum remains technically corrective but with bullish momentum building within the channel. As long as the midline holds, we expect continuation toward the channel top, completing Wave D structure before potential reversal.
💬 Drop your alt counts or thoughts in the comments.
EURGBP – Bearish Continuation in Play?Hello TradingView Family / Fellow Traders. This is Richard, also known as theSignalyst.
📈EURGBP has been overall bearish trading within the falling channel marked in orange.
Moreover, the green zone is a strong structure.
📚 As per my trading style:
As #EURGBP approaches the red circle zone, I will be looking for bearish reversal setups (like a double top pattern, trendline break , and so on...)
📚 Always follow your trading plan regarding entry, risk management, and trade management.
Good luck!
All Strategies Are Good; If Managed Properly!
~Richard Nasr
Disclosure: I am part of Trade Nation's Influencer program and receive a monthly fee for using their TradingView charts in my analysis.

BUY USDCHF 5.8.2025Confluence order: BUY at M15
Type of order: Limit order
Reason:
- The current top is not touching anything, expected to rise to the sub-key of H1 above.
- M15~FIBO 0,5-0,618 (same position)
Note:
- Management of money carefully at the last bottom (0,81005)
Set up entry:
- Entry buy at 0,80878
- SL at 0,80802
- TP1: 0,81005 (~1,5R)
- TP2: 0,81123 (~3R)
- TP3: 0,81299 (~5R)
Trading Method: Price action (No indicator, only trend and candles)

BUY XAUUSD 5.8.2025Confluence order: BUY at M15
Type of order: Limit order
Reason:
- The current top is not touching anything, expected to rise to the H1 above.
- M15~FIBO 0,5-0,618 (same position)
Note:
- Management of money carefully at the last bottom (3,370)
Set up entry:
- Entry buy at 3,364
- SL at 3,360
- TP1: 3,370 (~1R)
- TP2: 3,383 (~4R)
- TP3: 3,391 (~6R)
Trading Method: Price action (No indicator, only trend and candles)

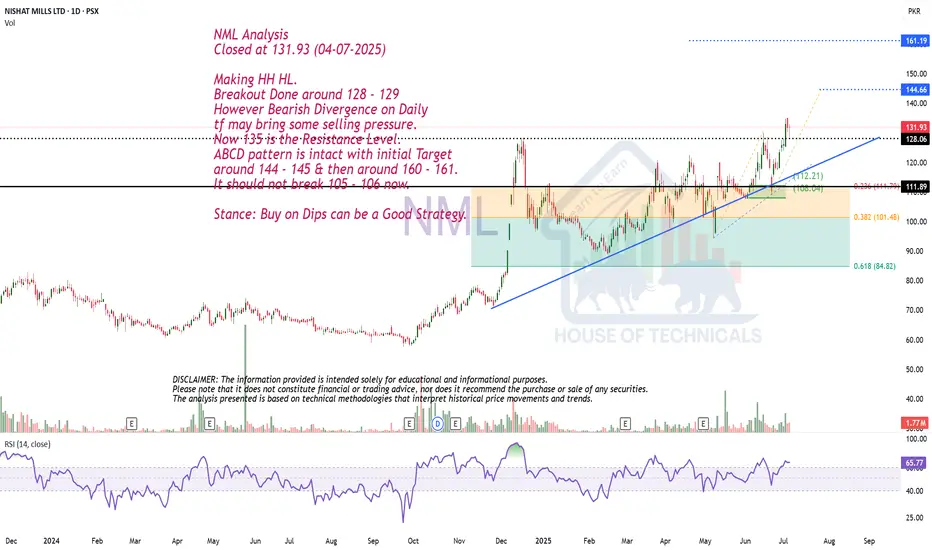
Making HH HL.NML Analysis
Closed at 131.93 (04-07-2025)
Making HH HL.
Breakout Done around 128 - 129
However Bearish Divergence on Daily
tf may bring some selling pressure.
Now 135 is the Resistance Level.
ABCD pattern is intact with initial Target
around 144 - 145 & then around 160 - 161.
It should not break 105 - 106 now.
Stance: Buy on Dips can be a Good Strategy.
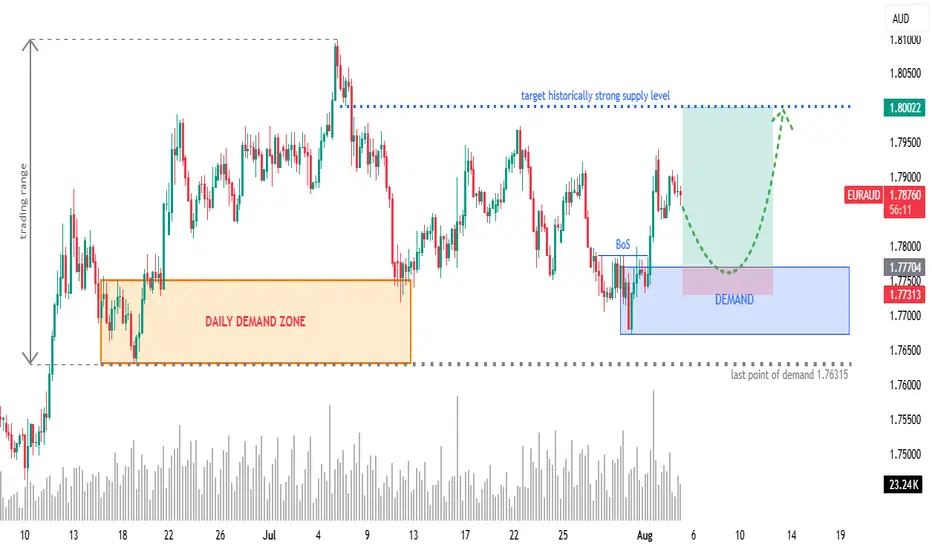
EURAUD 4H: Long Setup from Fresh Demand ZoneOverview:
OANDA:EURAUD retracing into a newly formed 4H demand zone after a bullish Break of Structure (BoS). Eyes on continuation towards a historically significant supply zone at 1.8000.
🧩 Setup Details
• Asset & Timeframe: EURAUD, 4H
• Bias: Bullish
• Entry Zone: 1.77300 – 1.77700 (DEMAND area)
• Targets:
🎯 T1 = 1.7900 (minor reaction level)
🎯 T2 = 1.8000 (historical supply level)
• Stop-Loss: Below 1.77300 (last valid demand)
• Risk-Reward: Approx. 1:6+
🧠 Why Now? (Trade Rationale)
• ✅ Fresh 4H Demand Zone: Price is retracing into a clear demand zone after rejecting lower prices.
• ✅ Break of Structure (BoS): Bullish BoS confirms shift in order flow.
• ✅ Volume Confirmation: Increasing demand near current price levels.
• ✅ Clear Liquidity Sweep: Price likely swept short-term lows before BoS.
• ✅ Target Supply Zone: 1.8000 is a well-respected historical supply/resistance level — clean magnet for price.
⏱ Multi-Timeframe Context
• Daily Chart: Price is reacting off a larger DAILY DEMAND ZONE. Trend bias is bullish.
• 4H Chart: Structure break + demand formation suggest continuation.
• 1H/Entry Level: Monitor price action in the blue zone for lower-timeframe confirmation (e.g. bullish engulfing, flip zones, LQ sweep, etc.) and potentially greater risk-reward.
📉 Risk Management & Duration
• Stop below 1.76315 keeps you protected from deeper invalidation.
• Trade Duration: Short to mid-term (1–4 days).
• Position Size: Scale based on volatility; ideal for swing trade conditions.
📌 Trade Plan Summary
📍 Watch for bullish PA on re-entry into demand (1.77300–1.77700)
📍 Set SL below 1.76315
📍 TP1 at 1.79000 — partials advised
📍 TP2 at 1.80000 — strong historical level
📍 Adjust SL to BE on momentum breakout
XAUUSD – Mid-Channel Rejection Near Key Supply ZoneGold has made an impressive recovery off the $3,250 zone, pushing back into the $3,380–$3,390 region — a key supply area which previously led to strong sell-offs.
We’re now sitting at the upper boundary of a 1H ascending channel and just under a significant resistance area seen on the 4H and daily timeframes.
Although bullish momentum is still present, price is showing early signs of exhaustion at this level — with small rejections forming and volume beginning to taper off.
The key zone to watch is $3,384 – $3,390. If price fails to break and close above this zone cleanly on the 4H, we may see a corrective pullback back toward the midline of the channel — or even a full retest of the lower boundary near $3,305 or $3,268 depending on momentum.
Bias: Short-term bearish / corrective – waiting for confirmation of rejection or bearish candle formation below $3,384.

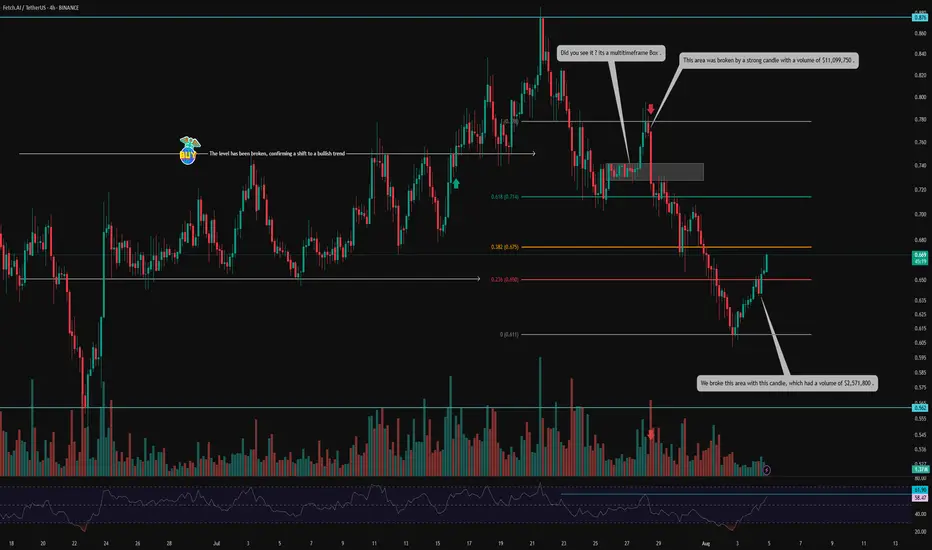
FET on Fire: Volume-Backed V-Pattern Breakout in 4H Structure💀 Hey , how's it going ? Come over here — Satoshi got something for you !
⏰ We’re analyzing FET on the 4-hour timeframe .
👀 After breaking out of its range around $0.75, FET experienced a solid upward move , reaching $0.876 . However , it was rejected from that level and faced heavy selling pressure , eventually forming a consolidation box on the multi-timeframe .
The break of this box, accompanied by rising volume and a total market structure break , led to a move toward the $0.778 resistance , where the price dropped again — this time with significant sell volume .
🎮 The Fibonacci levels in this chart are drawn based on volume-based market activity — specifically from the candle where the sell-off began to the candle where selling pressure ended and a reversal candle formed .
It may sound a bit technical , but the 0.236 Fib level acted as a key V-pattern resistance , which was beautifully broken with a strong $2,571,800 volume, and the candle closed above it .
Following that , traders showed reactions to this level , and the liquidity absorption can be seen in the form of wicks .
🔑 The next important zone is the 0.382 Fibonacci level at $0.675, where we see two possible scenarios :
Reaction and pullback , followed by a breakout .
Breakout first , then a pullback .
You can also place a buy stop at this level — just make sure to use a wider stop-loss .
⚙️ The structure is looking relatively good . The 61.9 RSI region could cause some noise in lower timeframes , but the key area is RSI 70 , which is the entrance to the Overbought zone .
🔼 Volume has been decent , especially considering today is Saturday and a weekend session . This adds more confirmation to the breakout of the V-pattern and the potential end of the correction .
🖥 Summary :
FET is one of those coins with strong recovery potential , operating in the AI sector . It tends to respect classic price action patterns , and with well-drawn Fibonacci levels , volume confirmation , and RSI moving into Overbought , it often activates buy-stop positions cleanly .
💡 Disclaimer :!!! .
BUY GBPUSD 5.8.2025Confluence order: BUY at M15
Type of order: Limit order
Reason:
- The current top is not touching anything, expected to rise to the sub-key of H1 above.
Note:
- Management of money carefully at the last bottom (1,33013)
Set up entry:
- Entry buy at 1,32790
- SL at 1,32597
- TP1: 1,33013 (~1R)
- TP2: 1,33411 (~3,5R)
Trading Method: Price action (No indicator, only trend and candles)
