US Dollar Index (DXY) – Bullish Setup in PlayThe market has spoken and it’s whispering a potential bullish breakout .
As seen in the chart, the US Dollar Index (DXY) recently broke out from a short-term consolidation zone after forming a solid base near the 99.00 region. Currently, it's retesting a minor support level (highlighted by the yellow horizontal line).
Key Observation:
Price is holding above this support zone with strength. If this level holds, I anticipate a continuation to the upside as marked by the white arrow.
Target: The next major resistance zone lies near the 103.00 area, where price previously reversed. This becomes the logical next stop if the bullish momentum continues.
What I’m Watching:
Reaction from the current support zone
Strength of buyers stepping in
Any fundamental catalysts from USD-related news/events
In trading, it's not about predicting, it's about preparing. This chart reflects a classic "break-and-retest" scenario often seen before major moves.
Let’s see how this plays out over the coming days.
Priceaction

GJ-Thu-15/05/25 TDA-Gap is starting to get filled! Interesting!Analysis done directly on the chart
Follow for more, possibly live trade updates!
Keep grinding, only when you are carrying your
own buckets of water, you'll feel every drop significantly!
Not financial advice, DYOR.
Market Flow Strategy
Mister Y

GJ-Wed-14/05/25 TDA-Higher high, higher low to next DR 197.240?Analysis done directly on the chart
Follow for more, possible live trade updates!
Does anybody know if gaps will always be filled or not?
Based on what criteria if it will be filled or not?
Appreciate the responses!
Comment down below!
Not financial advice, DYOR.
Market Flow Strategy
Mister Y

GU-Thu-15/05/25 TDA-Tricky zone, open for both direction!Analysis done directly on the chart
Follow for more, possibly live trade updates!
Knowledge per se won't make you money, it is
applying the knowledge and in this case in trading
doing live trades will make you money.
What's your view on this? Comment down below!
Not financial advice, DYOR.
Market Flow Strategy
Mister Y

EUR/USD Breakdown in May: Seasonality + Smart MoneyEUR/USD Weekly Outlook – May 15, 2025
EUR/USD is showing clear signs of weakness after a sharp rejection from the key supply zone between 1.1450 and 1.1600. Last week’s candle closed decisively below the 1.1250–1.1300 structure, confirming the failure to sustain bullish momentum. The RSI has also dropped below the 40 level, signaling strong downside pressure.
From an institutional positioning standpoint, non-commercial traders are rebalancing: both longs and shorts on the euro have decreased, while spread positions have increased—suggesting hesitation and a lack of clear conviction. On the other hand, commercials remain heavily long on the euro, but this appears to be more of a hedging move than a directional bias. The US dollar is regaining strength, with new long positions added by speculative traders, aligning with the recent EUR/USD decline.
Retail sentiment shows that a majority of traders are short, but not in extreme proportions. There’s a heavy cluster of long orders between 1.1100 and 1.1050, likely serving as liquidity targets for further downside movement.
From a seasonal perspective, May is historically bearish for EUR/USD. All major seasonal timeframes (5y, 10y, 15y, 20y) point to consistent average negative performance in this month. The current 2025 trend aligns perfectly with this historical pattern, providing a statistical tailwind to the bearish thesis.
Macro-wise, today’s key US data releases—PPI and Retail Sales—could significantly impact the USD. A positive surprise would further strengthen the dollar, adding downward pressure on the pair. Market attention is also focused on Fed Chair Powell's speech later today, which could add fuel to the current move.
Conclusion: The macro, technical, sentiment, and seasonal frameworks all converge on a bearish continuation for EUR/USD. A weekly close below 1.1175 would confirm the downside extension, targeting the 1.0850–1.0700 demand zone. A break above 1.1330 would temporarily invalidate the bearish setup.

MKVENTURES CAPITAL – Positional Breakout Setup📈 Buy Above: ₹1,700 (Breakout Zone)
Stoploss: ₹1,630
Target 1: ₹1,790
Target 2: ₹1,880
🔹 RSI is bullish, above 60
🔹 Strong volume build-up
🔹 Near resistance zone – breakout likely
📉 Sell Below: ₹1,630 (Trend Reversal)
Stoploss: ₹1,700
Target: ₹1,550
📊 Chart: Daily
📌 Strategy: Resistance Breakout with RSI & Volume Confirmation
💡 Risk-Reward: 1:2 (Good for swing trade)
For Education Purposes Only

DKNG | $50 UpdatePrice is set to head towards $50. Would like to see a pullback near bullish volume just after we push a little higher.

Gold's Fakeout Into The Trap — Smart Money is Loading Up🟡 GOLD 30-Min Chart Breakdown — May 14, 2025
Gold just gave us a masterclass in Smart Money Concepts (SMC). Let’s dissect the juicy bits of this long setup:
🧩 1. Structure Overview
Market in a defined downward channel
Price taps the order block from previous accumulation zone
A liquidity sweep wick pierces just below the OB (classic SMC trap)
🛠 2. Key Confluences
🔵 Order Block: Held strong, respected on multiple timeframes
🔴 Liquidity Sweep: Deep wick hunts stops below OB, then bullish reaction
📉 Descending Channel: Price bounced off the bottom trendline
✅ Clean RRR Long: Setup has 1:5+ potential if targeting the upper channel
📈 3. Trade Idea
Entry: Around $3,220
Stop: Under $3,206 (below liquidity sweep)
TP: Zone near $3,257
Expecting breakout attempt if momentum breaks structure above $3,240
📉 4. Risk Notes & Management
Keep an eye on Asian session volume — fakeouts are common
Trail stop as price pushes past mid-channel
Rejection at $3,240 = consider partial close
📌 Gold loves a dramatic reversal — this one is no different. Smart money doesn’t chase — they accumulate in fear. This setup screams institutional entry zone.
💬 Drop a “💎” if you caught this with us!
🎥 Follow @ChartNinjas88 for clean SMC breakdowns like this every day!

2025-05-14 - priceactiontds - daily update - daxGood Evening and I hope you are well.
comment: Higher highs and higher lows compared to Tuesday. We are in a triangle and market is refusing to print below 23500. I do think we will see a big move tomorrow. What I don’t think is that we will close Friday at an extreme. If we get to 24000 again, I am very inclined to look to fade it again. Can we close this week below 23000? I gighly doubt that as well.
current market cycle: broad bull channel or trading range - doesn’t matter since you trade them the same
key levels: 23000 - 24100
bull case: Bulls want 24000 again and I think 23500 is the place where they are happy to scale in. Bears will likely give up tomorrow, if we move above 23650 since they tried 3 times since Monday and market is refusing to go lower. I still think bulls will likely not get much more than 24000. Every time we are in a form of a triangle, I will not write much since market is in balance around it’s midpoint and you should not interpret more into it than it is. We are in a clear bull trend and this sideways correction is better for bulls than bears, since sideways is acceptance and it means bears are not making much money.
Invalidation is below 23300.
bear case: Bears can not expect 23500 to break all of a sudden tomorrow. If anything, most have to cover if we go above 23650 because we could do 23750 or higher. I don’t have much for the bears. If they somehow break below 23440, it would open up the possibility of 23000 but for now it’s very unlikely.
Invalidation is above 24100.
short term: Neutral but rather looking for longs than shorts. Clear support 23500 and everyone expects at least a double top or more.
medium-long term from 2025-05-11: So here is my very rough guess about the next months. This short squeeze is clearly overdone and global macro stuff has most likely already deteriorated a great deal. Down to 20000 over the next weeks and form a big trading range. Up through October-Year end. Zero thought about a new bull trend above 24000 or that we have seen the lows for either 2025 or 2026. Good question is always, “How would you allocate 100k right now?”. 50% short dax, 25% of it levered/options and with the rest I would scalp.
trade of the day: Shorting above 23700 has been profitable all week but I expect it to fail either tomorrow or Friday. Market poked enough at it, that the chance of a breakout above is too big for me to continue to fade against that price.

EURGBP - LONG | BUYCALL | Sentiments -Strong Bullish Divergence based on strong sentiments at bullish side and strong bullish divergence, the pair seems to be bullish shortly. Market once breaks the last LH we can enter into the market with defined TPs and SL.
HAPPAY TRADIND GUYZ !

GBPJPY Just Hit the Sweet Spot — High RRR or Fakeout Trap?💷 GBPJPY 30-Min Chart Breakdown — May 14, 2025
This setup is a banger for traders following structure, zones, and risk-reward logic. Let’s dissect the trade logic:
🔍 1. Market Structure
Price has been moving within a well-respected ascending channel (see black trendlines).
We just printed a short-term bearish pullback, with price dipping into a refined demand zone (highlighted pink/red).
The most recent bearish impulse looked like a liquidity sweep, not a structure break.
🧱 2. Smart Money Zone
Demand zone aligns with:
✅ Previous OB (order block)
✅ Mid-channel support
✅ Equal lows & trendline liquidity just below
Dark gray box = the exact entry block
Bulls stepped in right on time — classic mitigation + reaction setup
🎯 3. Risk-Reward
Entry: Around 195.380
SL: 195.110 (tight below the block)
TP: 196.575
RRR ≈ 1:5 — beautiful sniper entry with minimal exposure and max gain
🧠 4. What to Watch Next
Break above 195.900 = confirmation of bullish continuation
If price stalls again below midline, re-entry could come after another liquidity push
Clean break of 195.100 = invalidation (watch for potential short setups below)
🔁 Trade Management Tips:
Trail stops aggressively above 195.900
Scale out partials every 50 pips if you're trading it like a swing
Add confluence from DXY/Yen strength for better context
This one checks all the boxes: structure, zone, confirmation, and a clean RRR.
🚀 Tag a trader who loves tight stop, high-RR plays.
📲 Follow @ChartNinjas88 for more Smart Money scalps & swing setups!

XAUUSD Bearish Pennant Breakdown | Retest in Play – 3090 TargetGold (XAUUSD) has been in a corrective phase after reaching the resistance zone around 3370–3420 USD, where the price was previously rejected with strong selling pressure. Over the past sessions, price action has developed into a Bearish Pennant pattern, typically seen as a continuation pattern in a downtrend.
Following a sharp drop from the highs, the price consolidated between converging trendlines, creating lower highs and higher lows. This structure resembles a pennant or triangle formation, which traders often interpret as a pause before the next leg down.
🔍 Key Technical Features:
1. Resistance Zone (3370–3420 USD):
Strong institutional selling observed here.
Multiple rejections confirm this zone as a significant supply area.
This area also serves as a risk management reference point for stop-loss placement.
2. Support Zone (3210–3230 USD):
The price bounced multiple times from this level, making it a key demand area.
A clean break below this zone would confirm bearish continuation.
3. Trendline Resistance:
A descending trendline has been respected consistently since May 8.
Price recently retested this trendline after a minor pullback, aligning with the bearish pennant structure.
4. Bearish Pennant Pattern:
Forms after a strong downward impulse.
The consolidation is narrowing within converging trendlines.
A breakdown with high volume typically leads to a continuation of the prior trend.
5. Breakout & Retest:
Price has already broken below the pennant's lower boundary.
The current move is a retest of the broken trendline—a classic setup for entering a short position upon rejection.
🎯 Bearish Target Projection:
The measured move from the pole of the pennant suggests a target around 3090 USD.
This level is derived by taking the height of the initial drop before the pennant and projecting it downward from the breakout point.
🛑 Stop Loss Strategy:
A conservative stop loss can be placed just above the 3370 USD resistance zone.
Alternatively, a tighter stop could be placed slightly above the trendline (~3240–3250) for aggressive entries, though this increases the risk of a false breakout.
✅ Trading Plan Summary:
Aspect Level / Detail
Entry Zone After retest & rejection (near 3230–3240 USD)
Target 3090 USD
Stop Loss Above 3370 USD
Risk-Reward Approx. 1:3 or higher
Pattern Type Bearish Pennant
🧠 Final Thoughts:
This is a textbook bearish continuation setup with strong confluences:
Trendline resistance
Bearish pennant formation
Breakdown with retest
Clear resistance and support zones for managing risk
If momentum sustains to the downside after the retest, we could see a swift drop toward 3090 USD, offering a favorable shorting opportunity for swing and intraday traders alike.
Always confirm with volume and candlestick confirmation before execution. Stay updated with fundamental drivers such as CPI, PPI, or FOMC comments, which can inject volatility.

Gravita , 1DPattern is looking very good , Enter if Nifty is in Up Trend , Avoid if Nifty Trend is Reversing ,
Take Risk according to your Capital .
Dont panic in Retracement and pullbacks after entering into trade .
Follow for More Swing Ideas Like this .

GMDC , 1WPattern is Looking very Great and is Ready to Breakout ,
if it broke the upper trendline with Good Volume then we can consider it is the best breakout
Follow for more Swing Ideas Like this

GU-Mon-12/05/25 TDA-Bulls and bears fighting strong!Analysis done directly on the chart
Ahead of GBP claimant count change and
US CPI I'll be cautious and lower my risks or
preserve the capital for more clarity after
the news events.
Not financial advice, DYOR.
Market Flow Strategy
Mister Y

GU-Wed-14/05/25 TDA-US CPI softens slightly, GU is rallying up!Analysis done directly on the chart
Follow for more, possible live trade updates!
Post trade analysis opened on Mon:
-Mistake: setting too wide tp ahead of US CPI
-Lesson learned: 3 types of tp set
1) Strong fundamental back up, wide tp (relying to push through levels)
2) Medium fundamental back up, tp to next major resistances (1h+)
3) No fundamental back up, tight tp and no holding
Always doing post trade analysis is really good and super
useful. By understanding if it was a technical problem, emotional
problem, fundamentally not understanding problem etc.
I advise you to do the same for each trade!
Comment down below what do you think!
Not financial advice, DYOR.
Market Flow Strategy
Mister Y

XAUUSD 4H | Strong Support in Play — Breakout or Bounce?🪙 Gold (XAUUSD) 4H Analysis — May 14, 2025
Gold is tapping into a critical support zone, where multiple SMC elements are aligning for either a massive bullish reversal or a stop-hunt breakdown. Let’s break it down:
🔻 1. Context & Price Action
Price has been in a down-channel, respecting structure and forming LHs (lower highs).
We're now tapping into a historically respected demand zone, clearly marked on the chart.
A large compression move into this level increases the probability of a volatile reaction.
🧱 2. Key Zones
✅ Support Zone: ~3,193 to 3,229 — highlighted in pink
💧 Sell Side Liquidity: rests just below support
🔼 Strong High: visible around 3,450 (target if bulls step in)
This is a textbook “liquidity trap or launch” zone.
📈 3. Possible Scenarios
🔵 Bullish Scenario:
If we see a fakeout and recovery from the yellow highlighted area:
Expect a sharp reversal, targeting the mid-channel and eventually the Strong High at 3,450+.
Smart Money may defend this level to grab external liquidity later.
🔴 Bearish Scenario:
If price closes strongly below support and holds beneath:
Sell-side liquidity sweep triggers, targeting deeper zones like 3,100 or even 3,025.
Trendline break + structure shift = full bearish continuation.
🎯 What to Watch For:
Rejection candlestick patterns near the yellow circle
Volume spikes on the bounce
Clean break + retest if bearish
This is a must-watch area for day traders and swing traders alike.
Stay reactive, not predictive!
🔁 Drop a 🔔 if you want to see how this plays out.
🧠 Follow @ChartNinjas88 for Smart Money insights on Gold and more!

GBP/USD Bulls Are Back? Institutions Are Loading Up1. Price Action & Zone Mapping
GBP/USD is consolidating above 1.3300 after a strong bullish reaction near the demand zone between 1.3040 and 1.3150 — an area that has already rejected price twice in recent months.
While the market structure still shows lower highs, the weekly candlestick formation signals a clear loss of bearish momentum. On the upside, the 1.3500–1.3600 zone remains the key supply area to break for a structural reversal to be confirmed.
2. COT Report – Institutional Positioning (as of May 6, 2025)
Non-Commercials (speculators) added +3,320 long positions and reduced -1,956 shorts, bringing the net long to +7,683 contracts — a strong bullish signal.
Commercials remain net short, but not with increasing aggression.
👉 The net positioning supports continued bullish bias, aligned with the recent technical rebound.
3. USD Index – Opposite Positioning
Non-Commercials increased both longs and shorts slightly on the US Dollar Index, but net positioning remains neutral with a slight bearish tilt.
This suggests a phase of indecision or mild retracement in the dollar, which indirectly supports GBP/USD upside.
4. GBP/USD Seasonality – Historical Behavior in May
According to MarketBulls data, May tends to be neutral-to-weak for the pair:
15-year avg: +0.0023
5-year avg: -0.016
2-year avg: +0.0069
Overall, this supports a ranging or corrective phase — not a high-conviction trending month. A breakout may need more confirmation.
5. Retail Sentiment
Currently, 60% of retail traders are short GBP/USD, with an average price of 1.2959, while only 40% are long from 1.3337.
👉 This imbalance favors a contrarian bullish narrative, especially if the market decides to run stops below 1.3300.
✅ Operational Outlook
GBP/USD is showing bullish consolidation signs, backed by:
Increasing institutional long interest
Contrarian retail sentiment (potential fuel for rallies)
Solid demand near 1.3040–1.3150
However, neutral seasonality and lack of structural breakout advise caution. A pullback towards 1.3200–1.3150 might come before any further upside move toward 1.3500.
🔍 Preferred Play: Wait for a retest of 1.3150 with price action confirmation before entering long. A strong breakout above 1.3350 would be early confirmation of renewed bullish pressure.

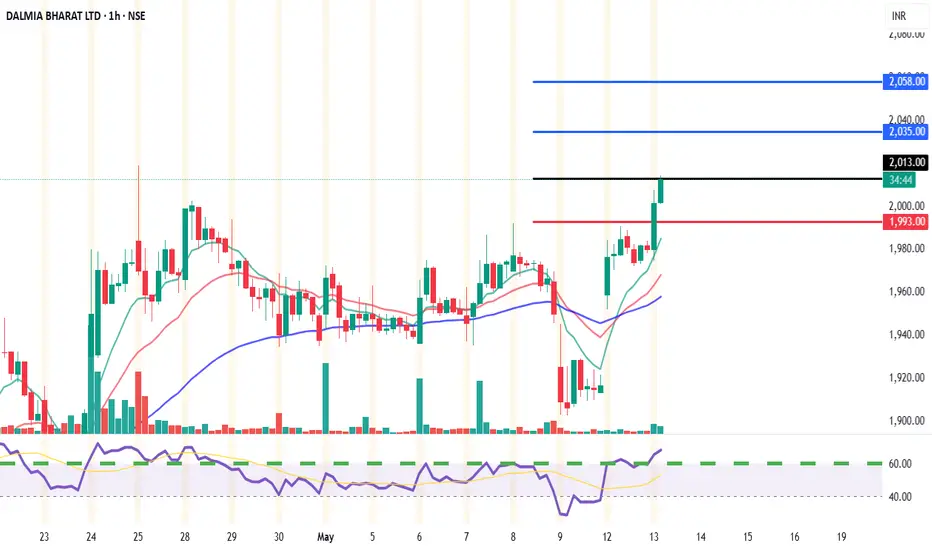
Trade Setup: DALMIA BHARAT (NSE)📊 Chart Summary:
Current Price: ₹2,009
EMA Support: 9 EMA (₹2,003.57) | 26 EMA (₹1,993.31)
Volume: Increasing with bullish candles
Price Action: Sustaining above key pivot and EMA levels
Momentum: Strong with minor consolidation
✅ Intraday Buy Setup (15min & 1h)
Buy Above: ₹2,013.50 (Break of intraday resistance zone)
Targets:
🎯 Target 1: ₹2,035.80 (Pivot R2)
🎯 Target 2: ₹2,058.30 (Pivot R3)
Stop Loss: ₹1,993 (below 26 EMA and pivot zone)
Risk:Reward: ~1:2 or better
For Education Purposes Only
No Clear Break Yet – Bounce or Bigger Correction?There haven’t been any major changes in Bitcoin’s directional structure compared to yesterday.
We saw a rebound while successfully holding the local low set during yesterday’s early morning session, and price action has followed the expected path quite well—reaching into the resistance zone and reacting accordingly.
The recent rebound from the $100,700 low may offer enough of a recovery move, but for a sustained continuation to the upside, we now need to see price hold the first support zone between $103,000 and $102,000, and ideally also preserve the second support around $101,500.
However, even if these support zones hold, failure to break previous highs could still result in another downward leg—potentially leading to a break back below $100K. This is an important scenario to keep in mind.
In short, we still need to determine whether this bounce is:
The completion of a correction wave and the start of a new uptrend
or
Just a temporary rebound before a deeper correction unfolds on the higher timeframe.
Even if we see meaningful bullish movement on the lower timeframes, it must also be confirmed across higher timeframes to be reliable. This is not a zone to hold blindly with blind optimism—whether long or short, if you’re in profit after a solid wave, consider partial profit-taking and manage your position proactively.
At the moment, the market remains in a range-bound structure, with neither the highs nor the lows broken decisively. I recommend using today’s update in conjunction with yesterday’s analysis—it will help you better understand the current structure, improve your positioning, and support your trading decisions.

Gabriel India Ltd (GABRIEL) – Weekly Resistance Breakout Setup✅ Trade Idea:
Price has reclaimed the 0.618 retracement at ₹608.25
Breakout above the ₹612 horizontal level (weekly closing basis)
Volume is rising and RSI shows strong uptrend
💰 Buy Zone:
Entry: ₹610 – ₹613
(preferably above ₹612 on strong 15min or 1H candle close)
🎯 Targets:
T1: ₹630 (previous minor supply zone)
T2: ₹646.65 (Fib 0.786 level)
T3: ₹695.55 (Fib 1.0 extension)
T4: ₹836.85 (1.618 extension for swing positional)
🛑 Stop Loss:
Intraday SL: ₹598 (below 9 EMA on 1H)
Swing SL: ₹581 (Fib 0.5 retracement support)
🔁 Strategy:
Wait for confirmation via volume + RSI > 60
Trail SL to ₹610 once ₹630 is hit
Lock partial profit near ₹646 if market sentiment weakens
For Education Purposes Only

2025-05-13 - priceactiontds - daily update - nasdaqGood Evening and I hope you are well.
comment: Can’t get more bullish than this but I am not willing to buy the exact high but rather would wait for a pullback. The only thing that we turn me neutral right now, would be a > -2% down day and close below 20800.
current market cycle: trading range
key levels: 19700 - 20600
bull case: My lowest measured move target is 22350. Market should stay above 20000 if bulls want to get there and that’s likely all that’s important about the nasdaq for now. Clear breakout and follow-through. Bears gave up and we are again at peak euphoria.
Invalidation is below 20000.
bear case: Bears need a miracle below 20000. That’s it. Could this become a bull trap and an exhaustion gap? Always possible but I think it’s so unlikely that you can not make money betting on those odds. Path of least resistance is up, Opex or not. What I do think is that we could be close to the top of the channel we are in and we go sideways for the next days. I drew potential upper bull channel line but confirmation would only be if we don’t print anything above 21350 tomorrow.
Invalidation is above 20400.
short term: Neutral. Bulls grinding but for how many more tries? If that is bad English, you can suck my Bratwurst.
medium-long term - Update from 2024-04-20: My most bearish target for 2025 was 17500ish, given in my year-end special. We are +18% from the lows and I do think, once this turns again, it will easily be the short trade of the year.
trade of the day: Shorting new highs continues to print money.

GBP/JPY Breaks Above 196.00! Continuation or Distribution?Detailed Techno-Macro Analysis – GBP/JPY
GBP/JPY has just completed a significant weekly structure breakout, pushing through a key supply zone between 195.00 and 196.30 — an area that historically acted as strong resistance. The breakout occurred via a high-volatility daily candle that closed above the zone, indicating strong bullish pressure.
🔍 Structure & Price Action
Price action shows higher lows and higher highs: a clearly defined bullish structure.
The breakout originated from an accumulation base, following a false bearish breakout below 188.50 (bull trap).
RSI is around 70 on the daily timeframe → strong momentum, but signs of potential exhaustion.
🧠 Key Zones Identified
Current weekly supply: 195.00 – 196.80 (being tested)
Next resistance: 198.70 – 199.50 (swing high and monthly level)
Immediate support: 194.00 – 192.80 (ideal area for pullback and long setups)
Structural support: 190.50 – 188.80
Invalidation: Daily close below 191.00 → potential reversal signal
📈 Macro & Fundamental Context
🇬🇧 UK Macro Update
Wages rising: +5.5% (above expectations) → could support further monetary tightening
Claimant count increasing → early weakness in the labor market
Mixed data, but wage growth bias favors GBP strength
🇯🇵 JPY Still Weak
BoJ remains ultra-accommodative
Verbal interventions from Japanese officials haven’t yet had structural impact
🪙 Retail Sentiment
70% of retail traders are short GBP/JPY, with an average price of 190.59
Only 30% are long, with an average price of 194.65
➡️ Current price (196.30) is above both → retail squeeze in play. Contrarian setup confirmed.
🧾 COT Report
GBP (Non-Commercial Speculators):
Long: +3,320 contracts
Short: -1,956 contracts
➡️ Net long positions increasing → favorable institutional exposure
JPY:
Mixed positions, with increases in both long and short → institutional neutrality on the yen
📅 Seasonality – GBP/JPY
May is historically bearish on both 5Y and 20Y timeframes:
5Y: -2.52%
20Y: -0.43%
Only the 2Y pattern shows a positive return
➡️ Negative seasonality vs. bullish technical structure → conflict worth watching
🔍 Execution Summary
The bullish breakout is strong and supported by sentiment and institutional positioning, but price is now entering a potential distribution zone, where profit-taking could increase.
👉 Main scenario: technical pullback toward 194.00–192.80 for possible long entries, targeting 198.50–199.50
👉 Alternative scenario: daily close below 191.00 → bias reversal and bearish continuation
