AUDCAD | Double Top RejectionThe double top rejection mentioned in the last post. We can see that price topped out at 0.90 and is now retesting the breakout from the last swing low.
Priceaction

AUDCAD | HnS Pattern | 500pips DownPrice action has continued selling off after retesting the previous breakout below the neckline and will be looking to hit another 500pips+
When looking at local price action on lower timeframes the double top rejection at ~0.90 has entered a distribution phase which is signaling price to fall further with the first target at 0.88 and so on.
For price to hit the last target around 0.855 I would like to see a break first then a retest/distribution phase.

AUDUSD Asia SessionWe could see bullish momentum during the Asian session pushing price into the upper supply zone around 0.65200. From there, we’ll be monitoring for bearish price action (PA) to potentially confirm a short setup.
If confirmation aligns, the short idea targets the demand zone between 0.64600–0.64500.
This is a forecast — not a signal. Trade execution will depend on what price does upon reaching the supply. We’ll drop to the H1 or M15 to refine entries if bearish confirmations present themselves.
Higher Timeframe Context: clearly marked HTF supply. Price has made a corrective leg up into this zone.
Liquidity & Reaction Area: There's likely resting liquidity above the most recent highs before the 0.65200 zone — perfect for a sweep.
Entry Plan: Smart to wait for CHoCH or BOS on LTF once we enter the supply zone. Avoid rushing — let the zone prove itself.
Target Area: The 0.64600–0.64500 zone aligns with previous structure and a minor FVG — solid short-term TP.

02.06.25 Morning ForecastPairs on Watch -
FX:AUDUSD
FX:USDJPY
FX:EURGBP
A short overview of the instruments I am looking at for today, multi-timeframe analysis down to what I will be looking at for an entry. Enjoy!

Xrp - New all time highs will come next!Xrp - CRYPTO:XRPUSD - is preparing for new all time highs:
(click chart above to see the in depth analysis👆🏻)
Xrp has clearly been trading sideways for the past 8 years. Meanwhile, market structure is respected perfectly and it seems to be just a matter of time until Xrp will create new all time highs. With the recent bullish break and retest, this scenario becomes even more likely.
Levels to watch: $3.0
Keep your long term vision!
Philip (BasicTrading)

BTCUSDT: Strong Risk-On Signal, Optimal Swing Above 103k__________________________________________________________________________________
Strategic Summary
__________________________________________________________________________________
Global bias : Dominant bullish structure, confirmed sector momentum, “risk-on” technical setting.
Opportunities : Favored swing entries above supports (103703.7–107019.9), breakout plays at 104865/106537.
Risk zones : Technical invalidation below 103703.7 or rapid ISPD DIV deterioration (red/orange zone + extreme selling volumes).
Macro catalysts : Rate, inflation/PCE, job numbers publication (48–72h) – to monitor closely for volatility pivots.
Action plan : Tight stops below supports, partial profit-taking on resistances, reduce exposure before key macro events, re-enter post-announcement on confirmed direction.
__________________________________________________________________________________
Fundamental & Macro Analysis
__________________________________________________________________________________
Favorable macro momentum (BTC, ETH, equity indices, institutional trust). Bull-cycle confirmation via technical triggers (bullish cross, MACD divergence).
Risks : Major token unlocks coming (3.3B+), on-chain euphoria (extreme profit/loss, exchange dominance >33%). Dynamic risk management crucial – swing stop-loss < 103703.7 is imperative.
Events to watch : US rates, inflation/PCE, payroll data – periods of heightened volatility expected, necessitating exposure adjustment.
Swing trade plan : Defensive entries on key supports, reduction pre-announcement, gradual profit-taking below 106537, then 109952.8/111949.
Risk/reward : Optimal for swing trades near supports, tactical management required for breakout chasing.
__________________________________________________________________________________
Multi-Timeframe Analysis
__________________________________________________________________________________
1D (Daily) : Bullish structure intact, key supports (107019.9, 81075.6). Risk On / Risk Off Indicator remains “Strong Buy”. No excess in volumes or behavior – buyers’ climate.
12H – 6H : Solid momentum above 103703.7–106537. Risk On / Risk Off Indicator still “Strong Buy”, ISPD DIV neutral, standard volumes.
4H – 2H – 1H : Pivot range (103703.7/104865/106537), buyer momentum, swing/scalp strategies favored. Supports to watch: 103703.7 (main stop trigger).
30min – 15min : Tight range (103703.7/104865), Risk On / Risk Off Indicator “Buy” (slightly weaker on 15min). Tactical scalping on bounce or pivot breakouts – risk zone if range breaks sharply.
Summary : Sectoral outperformance on all timeframes via the Risk On / Risk Off Indicator, ISPD DIV neutral, normal volumes. Key pivots: 103703.7 (support) and 104865/106537 (resistances) frame all action. Swing trading optimality as long as these levels hold.
__________________________________________________________________________________
Conclusion
__________________________________________________________________________________
BTCUSDT market remains bullish on all timeframes, supported by strong sector momentum (Risk On / Risk Off Indicator), steady volume and behavioral stability (neutral ISPD DIV). Preference remains for long strategies on support, with increased vigilance around macro windows (events, unlocks). Strict stop discipline and active profit-taking are key on extension moves.
__________________________________________________________________________________

GU-Mon-2/06/25 TDA-GU pushing up, possible breakout buy!Analysis done directly on the chart
Follow for more, possible live trades update!
Breakout trade:
It's always good to wait for candle closure above
or below certain levels (depending on if you are buying
or selling). Then have lower timeframe structure to
put good sl and be able to manage properly.
Always know beforehand where to put your sl and tp.
Not financial advice, DYOR.
Market Flow Strategy
Mister Y

BTCUSD Mind Mapping Analysis (MMC) + Structure Mapping + Target🕵️♂️ Introduction
Welcome traders! In today’s BTCUSD analysis, we dive deep into the Mind Mapping Concept (MMC) with curve-based support, smart money structure shifts, and mapped liquidity levels. This chart reveals how institutional players moved price through liquidity traps, accumulation zones, and major breakout points, culminating in a reversal zone.
This breakdown is ideal for traders using:
Smart money concepts (SMC)
Curve theory
Liquidity sweeps
Structure mapping
🔍 Detailed Breakdown of the Chart:
🔹 1. Ellipse Zone – Liquidity Trap Phase
The blue ellipse on the left shows a clear area of price compression and indecision.
This is where retail traders often enter prematurely, expecting reversal.
Smart money exploits these zones to collect liquidity — this is not yet a trend shift, but a trap.
You can observe multiple wicks and fakeouts, signaling manipulation and preparation for expansion.
🔹 2. Expanding Channel – Volatility Phase
Following the trap, price enters an expanding pattern (also known as a megaphone).
These structures indicate uncertain market behavior, often manipulated to clear both highs and lows.
Smart money uses this to exhaust both buyers and sellers before deciding the real trend direction.
🔹 3. Previous Target & SR Flip Zone
Price reaches the previous downside target, completing a downward liquidity move.
From here, the market forms a support-resistance flip (SR-Interchange) — a textbook zone for institutional entries.
Once this zone holds, it confirms that buyers are absorbing sell orders.
The curve starts forming, indicating deeper market structure realignment.
🔹 4. Black Curve – Mind Mapping Curve Support
One of the most important elements of MMC — the curve — acts as a psychological and algorithmic support line.
The curve captures the accumulation structure in a flowing manner.
Repeated touches and rejections confirm its strength.
As long as price respects the curve, the bullish momentum remains intact.
🔹 5. Breakout Confirmation
Price breaks through mid-range consolidation and hits Target 1.
This move confirms a shift in market sentiment from indecision to bullish control.
The breakout is supported by volume, structure alignment, and curve acceleration.
🔹 6. Major Breakout Zone
A major resistance line is broken — this marks a shift in macro structure.
At this point, we label the zone as “Major Breakout” — any retest of this can offer a high-RR entry.
🔹 7. Next Reversal Zone (Supply Zone)
Price is now inside the Next Reversal Zone, which is a potential supply area or liquidity magnet.
Institutional traders may use this zone for profit-taking or to initiate a deeper retracement.
Watch for rejection signs, such as long wicks, engulfing patterns, or volume divergence.
If this zone is absorbed (i.e., broken cleanly), expect another leg higher.
💡 MMC Summary (Flow Recap):
Trap → Expansion → Liquidity Target → SR Flip → Curve Accumulation → Breakout → Target Hit → Reversal Zone
Each stage reflects smart money behavior and follows the natural cycle of manipulation → accumulation → distribution.
📊 What to Watch Next?
Confirmation Rejection in Reversal Zone? Short entries could be valid with curve re-entries.
Bullish Continuation? A clean break above reversal zone = new weekly highs likely.
Retest of Curve? If price pulls back, watch for rejections on the curve for safer long positions.
🚨 Trade Tips Based on This Setup:
✅ Use multi-timeframe confluence (M30 + H1 or H4)
✅ Always mark out previous liquidity zones
✅ Place SL below the curve or zone rejections
✅ Avoid entering trades inside expanding zones – wait for structure confirmation
🔖 Conclusion
This BTCUSD setup showcases a masterclass in smart money behavior using the Mind Mapping Concept (MMC). From trap to breakout, every move is cleanly mapped, providing a strong edge to traders who understand institutional footprints.
Whether you're a scalper, day trader, or swing trader, incorporating MMC curve support and liquidity logic can take your trading precision to the next level.

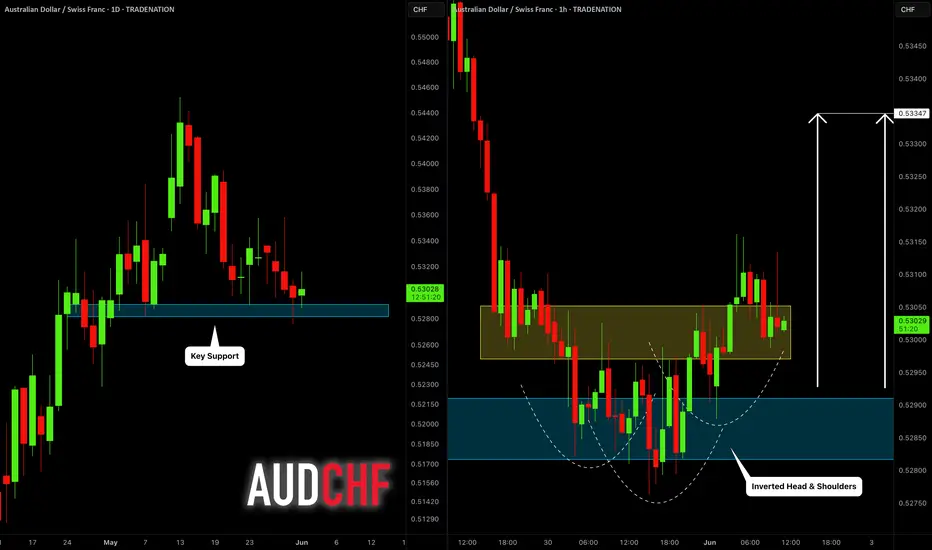
AUDCHF: Bullish Move From Support 🇦🇺🇨🇭
AUDCHF is going to bounce from a key daily horizontal support.
Our confirmation signal is a formation of an inverted head and shoulders
pattern on an hourly time frame and a violation of its neckline.
Goal - 0.5335
❤️Please, support my work with like, thank you!❤️
I am part of Trade Nation's Influencer program and receive a monthly fee for using their TradingView charts in my analysis.
RELIANCE LTD – 1H TIME FRAME ANALYSIS📊 NSE:RELIANCE – 1H TIME FRAME ANALYSIS
A symmetrical triangle pattern is forming on Reliance's 1-hour chart, showing a consolidation phase. This pattern is neutral in nature, meaning a breakout can occur in either direction, but the setup provides a great opportunity for a breakout trade.
The price is now at the apex of the triangle, indicating a potential breakout in the upcoming sessions. Watch for a strong move backed by volume.
TRADE PLAN :
Chart Pattern: Symmetrical Triangle
Timeframe: 1 Hour
Stock: Reliance Industries Ltd (NSE)
🔼 Long Trade (Breakout above 1430.55)
Entry: Above 1,430.55 (candle close with volume confirmation)
Target 1: 1,458.35
Target 2: 1,479.35
Stop Loss: Below 1,417
🔽 Short Trade (Breakdown below trendline):
Entry: Below triangle breakdown with strong red candle
Target 1: 1,397.55
Target 2: 1,368.25
Stop Loss: Above 1,430
Note: Avoid entering during the triangle zone. Trade only post-confirmation of breakout/breakdown with volume.
Disclaimer: This analysis is for educational purposes only. Please consult your financial advisor before making any trading decisions.

XAUUSD Mind Mapping Breakout – MMC Strategy + Target📍 Overview:
In today's Gold (XAUUSD) 30-minute chart, we’re witnessing a flawless execution of MMC (Mind Mapping Concept) strategy combined with SMC (Smart Money Concept) principles. This is a perfect case study for traders who want to understand how psychology, curve-based support, and structural mapping come together to create a high-probability bullish setup.
🔍 Full Breakdown of the Chart
1. Initial Market Behavior: Liquidity Grab & Structural Shift
The market begins with a bearish drop, clearing liquidity below the previous consolidation.
This is followed by a QFL zone (Quick Flip Level), which acts as a smart money accumulation point.
Shortly after, price rebounds from the SR Interchange zone, where resistance transforms into support—a key MMC signal for upcoming structural shift.
🧠 Key Concept: Smart money often grabs liquidity before making a move. These zones are critical for identifying market reversals.
2. Black Mind Curve Support – Dynamic Trend Logic
The Black Mind Curve is a dynamic support curve, not a traditional trendline. It represents how the market naturally flows, mapping out the collective psychology of buyers.
Price respects this curve multiple times, forming higher lows—each one stronger than the last.
This is where patient MMC traders build their positions, aligning entries with psychological market rhythm.
🔥 Why It Matters: While static lines may break under pressure, dynamic curves breathe with the market, providing more accurate structure support.
3. Structure Mapping – Tracking Market Intentions
Structure Mapping is one of the core MMC techniques—tracking the "story" price action is telling through:
BOS (Break of Structure)
QFL traps
SR interchanges
Internal higher-highs and higher-lows
The Major BOS line indicates a key shift in market direction from bearish to bullish, a confirmation point for trend-followers.
📌 Lesson: Once BOS is confirmed, the probability favors continuation rather than reversal.
4. Ellipse Trap – The Psychological Kill Zone
This blue-highlighted ellipse zone marks where retail traders often get manipulated—buying false breakouts or shorting fake reversals.
Price consolidates inside this ellipse before launching upwards.
MMC refers to this phase as the “After Effect”—where true momentum begins after psychological traps are triggered.
🎯 Insight: Never enter a trade inside the ellipse unless you clearly understand market context—it’s where the market “confuses the masses.”
5. VIP Zone – The High-Probability Entry Window
The VIP zone is a small but powerful price area where risk is minimized, and reward is maximized.
It aligns with the curve, inner structure support, and BOS retest. This is your ideal entry zone, especially for those using curve-based confirmations.
🔑 Pro Tip: This is the sniper entry for MMC traders. Small SL, big reward. Enter after internal confirmation like pin bars or bullish engulfing.
6. Target Zone & Next Reversal Area
After the explosive breakout, price hits the projected target marked clearly on the chart.
The move aligns with prior imbalance zones and market inefficiencies, filling previous gaps.
The market is now approaching the Next Reversal Zone, highlighted in blue—this is where MMC traders start watching for signs of exhaustion.
📉 What to Watch:
Slowing bullish candles
Bearish divergence on RSI or momentum indicators
Sudden spikes in volume with no further upside
📚 Key MMC Concepts in This Chart:
Concept Description
QFL Zone Quick Flip Level; a liquidity trap zone before reversals.
Black Mind Curve Curved support line reflecting psychological market flow.
Structure Mapping Tracking HH/HL and BOS to define clear market bias.
Ellipse Trap Market maker zone used to trap and reverse retail traders.
VIP Entry Zone The safest and most efficient entry after structure confirmation.
Next Reversal Zone Anticipated resistance based on confluence of previous S/R and imbalance.
🧠 Strategic Conclusion:
This analysis perfectly illustrates how combining SMC with MMC enhances your trading edge. It’s not about predicting price, but understanding structure, reading psychology, and entering at high-probability points.
Whether you're a scalper, day trader, or swing trader, using curve-based mapping like the Black Mind Curve gives you a fluid understanding of price, beyond rigid lines and lagging indicators.
💡 Final Thoughts:
📈 Follow the Story, Not the Noise.
📉 Enter Where It Makes Sense, Exit Where Others Get Emotional.
⚡ Use MMC to Read What the Market is Really Saying.
✅ Action Plan:
🔍 Monitor price in the Next Reversal Zone.
📉 Look for exhaustion signals before considering shorts.
🟢 If bullish continuation holds above target zone, next micro-level target would be derived from 1.618 Fibonacci extension.

USDJPY Forecast for NFP Week | Price at a Critical Turning PointIn this video, I’m diving into the USDJPY setup ahead of a high-impact week filled with major economic news like the NFP, ADP Employment, and speeches from the BoJ Governor.
We’ll walk through the technical zones I’m watching, discuss potential buyer and seller reactions, and outline the key catalysts that could move the market.
🔔 Don’t forget to like the video in support of my work.
Disclaimer:
Based on experience and what I see on the charts, this is my take. It’s not financial advice—always do your research and consult a licensed advisor before trading.
#USDJPY #ForexForecast #NFPWeek #ForexMentor #TechnicalAnalysis #ForexTrading #BoJ #TradeSetups #PriceAction #MarketBreakdown

GJ-Mon-2/06/25 TDA-GJ in ranging zone!Analysis done directly on the chart
Follow for more, possible live trades update!
My idea is the higher time frame you trade,
the more fundamental analysis you need to be
good at to actually be consistently profitable
trader. And viceversa if you trade lower timeframe
it's more technical analysis but always keeping
in mind the higher timeframe picture, doing the
top down analysis and having the basic necessary
knowledge on fundamental analysis.
Tips for basic fundamental knowledge:
1) Use economic calendar ( I recommend
FXstreet calendar for macroeconomic events
and Financial Juicy for flash news, real live updates)
2) Stay up to date with global news, war, tariffs etc.
As these are key factors that will influence price
currencies.
Not financial advice, DYOR.
Market Flow Strategy
Mister Y

EUR/GBP at a Tipping Point: Key Demand Zone or Breakdown Ahead?The EUR/GBP cross is currently trading in a key technical area, hovering around 0.8427, showing signs of mild recovery after a bullish reaction from a previously tested demand zone.
📊 Technical Analysis
Price action reveals a compression phase within a descending channel (corrective flag), followed by a breakout to the upside last week. Price reached the supply zone between 0.8480 and 0.8535, which triggered a strong bearish candle rejection.
Currently, the pair is testing support around 0.8400–0.8380, a level previously defended by buyers.
The RSI bounced from oversold territory, suggesting the potential for a consolidation phase or sideways movement, rather than a clear divergence.
📌 Key Levels
Dynamic Resistance: 0.8480 – 0.8535
Structural Support: 0.8380 – 0.8285
Upside breakout target (if momentum builds): 0.8660
📅 Seasonality
Historically, June tends to be slightly bullish for EUR/GBP, especially on the 5-year and 10-year seasonal patterns. Curves indicate upward pressure between the second and third weeks of the month, suggesting that any retracement could present a seasonal long opportunity.
💼 COT Report
Euro FX
Non-Commercials reduced both longs (-1.7K) and shorts (-6.7K) → signaling indecision or rebalancing.
Net positioning remains positive, but momentum is fading.
British Pound
Non-Commercials added significantly to longs (+14.2K) and slightly to shorts (+2.8K) → GBP is attracting bullish interest.
This could reduce upside pressure on EUR/GBP in the short term.
Overall, COT data currently favors the British Pound in the near term.
📈 Retail Sentiment
Retail traders are heavily skewed to the long side (74% long), which may create contrarian downside pressure if the market moves against the crowd. The average entry price is around 0.8481, meaning many traders are currently underwater.
🎯 Conclusion & Bias Outlook
Short-term bias: Neutral to bearish down to 0.8380
Mid-term bias: Moderately bullish if price holds above 0.8380 with higher lows confirmation
Ideal long entry could emerge from a retest of 0.8380 with bullish confirmation (candlestick or RSI support)
Alternatively, a clear H4 close below 0.8380 could open space down to 0.8280

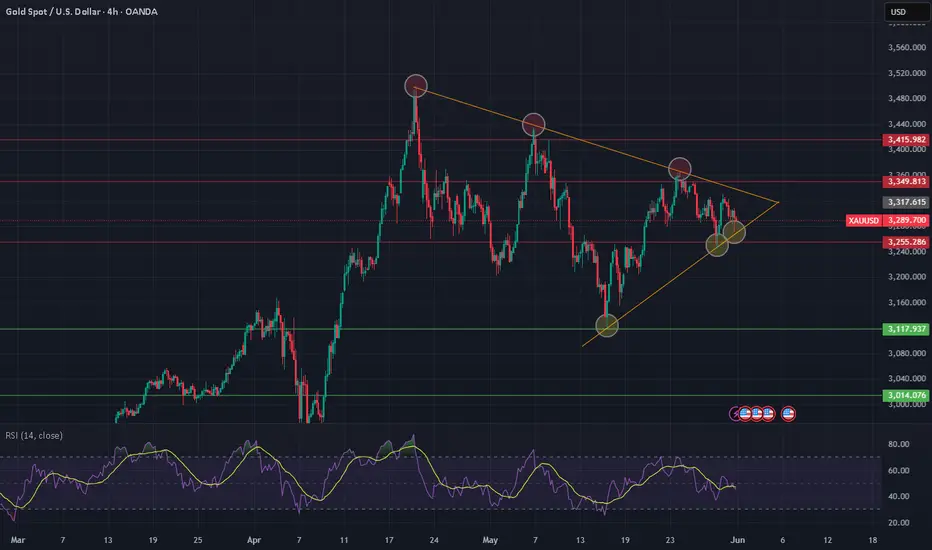
Everybody loves Gold Part 2A good start to Gold Journey
In Part 2, we highlight a cluster of levels around close of Week 21. Price could however gap up or down and that will determine next moves.
At the moment though, we expected price to follow the arrow path for a down week.

XAU/USD (Gold) – Symmetrical Triangle Setup | Breakout Imminent🔶 Chart: 4H timeframe
🔶 Pattern: Symmetrical Triangle
Gold is currently consolidating within a well-defined symmetrical triangle on the 4H chart, marked by a series of lower highs and higher lows — a classic setup indicating a potential breakout is near.
🔍 Technical Breakdown:
✅ Price has respected both trendlines multiple times, confirming the structure.
✅ The apex is approaching, suggesting volatility and a directional move are imminent.
✅ Volume is compressing, aligning with typical breakout behavior.
🧭 Bias: Neutral – Wait for Confirmation
We’re at a decision point. Don’t front-run the move — wait for a clean 4H candle close outside the triangle with volume confirmation. Whichever side breaks, the follow-through could be sharp.
Set alerts at Above and Below triangle to catch the move in real time.
Jindal Steel & Power ,1DPattern is looking very very good , enter into trade after upper trendline is fully broken with Good Volume with strong candle .
Take Risk According to your Capital
Follow for more Swing Ideas Like this .

#202522 - priceactiontds - weekly update - bitcoinGood Day and I hope you are well.
comment: First weekly bear bar since end of March but I doubt we just go down. Much more likely is a trading range until more bulls doubt we get above 112k. Can you buy 103k? Only with a stop maybe 98k since the risk of hitting 99.9k are too big to have a stop there. But that trade is much more likely to succeed than shorting 103k with a stop 112.1k.
current market cycle: Broad bull channel on the weekly and monthly chart. Tight bull channel on the daily chart break this week and we are likely in a trading range before we get the next impulse.
key levels: 100k - 115k
bull case: If you are still long this and have not taken profits at 110k, I don’t know what you are waiting for. Market is clearly not finding buyers above 110k and it’s a perfect double top with 2024-12 and 2025-01. Can we hit 115k oder 120k? Sure but the odds are so low. If you are HODLing for 1mil, will hold through 70k again and buy more? If so, good luck to you. Got nothing for the bulls other than a trading range.
Invalidation is a daily below 100k with follow-through.
bear case: Bears need a gap down and it has to stay open if they want more downside. I think the selling this week was decent and without much resistance by the bulls. Contraire to nq and sp500, Friday did not produce a big reversal, which makes me a bit more bearish than it probably should. We are at bigger prior support and I can only really favor the bears once we close the gap down to 97k and the April high.
Invalidation is above 116k.
short term: Neutral. I expect a trading range and likely another test of 110k or even 115k but this will likely be the double top many are waiting before they will short this. A very rough guess of another two-legged move higher is on the chart but don’t trade based on that as of now. Wait for stronger buying again and be prepared to not get more than 110k.
medium-long term - Update from 2025-05-25: Will update this next week but plan here is the same as other markets. I wait for this to top out and trade it back down to 80k over the summer.

#202522 - priceactiontds - weekly update - wti crude oil futuresGood Day and I hope you are well.
comment: 3 weeks inside a tight range but market keeps getting rejected under the weekly 20ema and it’s consecutive bear bars now. Below 59.8 I favor the bears for more downside.
current market cycle: monthly time frame is a broad bear channel - weekly tf is a bear wedge - daily is a trading range
key levels: 55 - 64
bull case: Bulls need a daily close above 64 to retest the bear trend line of this big bear wedge from the January high 78.1. That’s the whole story for now. Market oscillates around 61 without any momentum, so buy low, sell high until it stops working.
Invalidation is below 59.8.
bear case: Bears need a daily close below 59.8 for more downside but market has been pretty much in balance for 3 weeks around 61. Problem for the bulls is, that we closed lower again and the tails above the weekly bars are much bigger than the ones below bars. So bears are slightly favored but only very slightly.
Invalidation is above 64.4
short term: Neutral. Playing the range until it stops working but mostly only small scalps. Market is likely waiting for an end to the tariff madness which might not come.
medium-long term - Update from 2025-05-25: Need a clear break of the trading range 54 - 64 before we can come up with new targets. Bear trend (wedge) is valid until the trend line breaks.

#202522 - priceactiontds - weekly update - nasdaqGood Day and I hope you are well.
comment: Not much difference to the dax or sp500, so you can skip the text and just watch the chart. Should look similar to you and you should trade it the same. If you have not read my dax update, please go read it.
current market cycle: trading range
key levels for next week: 20700 - 22000
bull case: Bulls are trapping bears into decent looking shorts just to reverse them strongly. Bulls are still hopeful af and until we have a daily close below 20700, the bull wedge is alive and can lead to higher prices. Bulls are heavily favored to continue until then. Target is obviously 22000.
Invalidation is below 20600.
bear case: Bears need a daily close below 22700 and close the giant gap down to 20200. Until then they have been making money shorting new highs but only for scalps. If we get another good move down next week, you should take big profits before they vanish again. Daily 20ema held for 6 weeks now, expect the next touch to get bought as well.
Invalidation is above 22100.
short term: Bullish that we stay above 20700 and hit 22000 next week. The buying on Friday was so strong, that we can expect higher prices. I will need strong signals though since we had bad news after hours Friday and Friday was also end of month, which can always distort the market bias somewhat.
medium-long term - Update from 2024-06-01: Market is refusing to go down but I can not see this going much more up. Maybe we hit 22000 maybe we don’t. My assumption is still that latest around end of June we begin to decline over the summer. If EU tariffs go through next week or there is no really good news before end of day Friday, expect a blood bath if they come into effect. It’s a trade embargo. No one will ship anything with 50% on top of it and markets are trading like everything is literally perfect.

$1 to $7.18 continued to 600% vertical $BMGLIt just didn't want to stop ripping higher, congrats if you got in if not sooner then at least when I posted a chart in $3's there was still time to catch a doubler up into $7's NASDAQ:BMGL

ABOUT PEPE, BEARISH MOVEMENTS WITHOUT GOVERMENTS ^) Hello dear traders! It's Nika...
Today I want to share with you this trading idea, about purpose.
As this technical analysis shows, our indicator has these yellow-marked circles.
This movement of price may happen so easily... So soon.
There are so many support levels that can be checked.
So, my personal opinion is market is bearish, and we can see downfall of a price decline.
Wishing you a profitable day.
Good Luck!

#202522 - priceactiontds - weekly update - daxGood Day and I hope you are well.
comment: Max bearishness last Friday but markets refuse to go down and take tariff risks at face value. Q2 earnings will tell the story so buckle up. Earnings season kicks off in about 3 weeks. Until then the next big event will be in 8 days when 50% EU tariffs may or may not come into play. Until then I don’t expect a big move to the downside, since bears tried couple of times but market refuses to go down. The big upper channel line runs up to 25000 and that is the next obvious big target. For bears it’s a break below the bull wedge and retesting 23300.
current market cycle: bull wedge and on the weekly tf it’s a broad bull channel and we are at the very top
key levels for next week: 23000 - 25000
bull case: 25000 is the next big round number but I highly doubt we get there. I was wrong last week and until we leave bear gaps behind us, bulls are favored for everything because the reality is that buying every dip has been profitable for months now. Bulls have to keep printing higher lows though.
Invalidation is below 23300.
bear case: I doubt we have much more upside in store but we could very well spike to 25000 before we can expect more bulls to stop buying every dip. Bears get spikes and zero follow-through, which leads to many bear traps. Scalping both sides was fine the past 2 weeks but bears have to take quick profits or they vanish quickly. Bears need a daily close below 23300 for more downside and until then, swing shorts are account destroyers. We need a big gap down which does not close to stop the BTFD crowd. So if we get a decent one next week and market only corrects sideways, that will be the trigger for more selling.
Invalidation is above 24500.
short term: Neutral. Scalping both sides but I will only turn full bear with an open bear gap and a daily close below 23300.
medium-long term from 2025-05-25: My rough guess from early May was down over the summer and up into year end. POTUS certainly helped with the 50% tariffs. Markets were not positioned for any risk what so ever. Now we got the atomic trade bomb. This view has not changed, just the time horizon which aligns better with Q2 earnings and my expectation that we will see the tariff madness coming through. Markets can ignore risks for longer than you can maintain your account but that does not change the reality and if you think this tariff war has a happy ending, you have not paid attention to anyone but the US government or their echo chamber.
