GU-Thu-1/05/25 TDA-Possible bounce up from DR 1.32496?Analysis done directly on the chart
React to candles, you get to see how
really price is doing. It requires time and
effort, it's not easy!
Not financial advice, DYOR.
Market Flow Strategy
Mister Y
Priceaction

GJ-Thu-1/05/25 TDA-BoJ rate unchanged, clean move up!Analysis done directly on the chart
We will never catch every single move.
It's true sometimes can be frustrating but,
learn to control yourself and not FOMOing
is a psychological skill. We often times
underestimate how important is psychology
in trading!
Not financial advice, DYOR.
Market Flow Strategy
Mister Y

Gold Trapped? Everyone’s Long… But Price is Going Down!Gold (XAU/USD) is showing signs of exhaustion after its explosive rally that pushed it beyond $3,400. We are now witnessing a pullback phase, with price directly testing a key demand zone between $3,050 and $2,980. From a technical standpoint, this is the last major defense before a potential drop toward the $2,832 area.
The current bearish pressure is supported by a powerful blend of macro, positioning, and behavioral factors:
COT Report – Gold: Non-commercials (speculators) are aggressively closing long positions and opening shorts, which signals a breakdown in the short-term bullish narrative. On the other hand, commercials (hedgers), also known as the "smart money", are steadily increasing their long exposure, hinting at a potential accumulation zone forming.
COT Report – USD Index: Speculative funds are stacking long positions on the dollar, which continues to add downside pressure on gold. As long as this persists, any upside attempt on XAU/USD will likely face headwinds.
Seasonality: May tends to be historically bullish for gold, but June is seasonally weak. The strongest seasonal window opens between July and August, suggesting the possibility of a deeper pullback before the next bullish wave.
Retail Sentiment: Over 75% of retail traders are long on XAU/USD, typically a contrarian signal. This sets the stage for a classic stop-hunt scenario, where price flushes lower to trigger retail stop-losses before a potential reversal.
📌 Conclusion: In true Bridgewater fashion, we’re seeing a divergence between positioning and price action. In the short term, gold remains vulnerable to a move toward $2,832. However, if that zone holds, it could provide a compelling opportunity to accumulate for a potential summer swing rally toward all-time highs.

01.05.25 Morning ForecastPairs on Watch -
GBP / JPY
GBP / CHF
XAG / USD
NZD / CAD
A short overview of the instruments I am looking at for today, multi-timeframe analysis down to what I will be looking at for an entry. Enjoy!

2025-04-30 - priceactiontds - daily update - daxGood Evening and I hope you are well.
comment: Still favoring doing a lower high print but we are close enough to 23000 that market can go higher. No more obvious resistance. A big maybe is the bear gap up to 23050 but that’s a gamble I am not willing to take. Today should have marked the start of the reversal with the huge bear spike but the bull reversal was beyond my comprehension. Can turn bear only below 22300 but I don’t need to long this either. Will only look for shorts on this, that’s why it’s full bear mode from here on.
current market cycle: trading range
key levels: 21000 - 24000
bull case: Bulls printed a higher April high and closed the month at the highs, which is a strong buy signal going into Friday and next week. The bull trend line from 19000 is valid until broken but the move up is so climactic and in a tight channel, that it’s tough to buy the highs but until bears trap late bulls and get follow-through after a sell spike, bulls are in BTFD mode and it continues to be profitable.
Invalidation is below 21300.
bear case: Bears don’t have much. Today could have been the final flag and we top out soon but we will only know once we drop below 22300 and continue down. For me this is a clear 3 legs up now and I have zero interest in buying up here. Big economies are most likely already in recessions and I think Q1 2025 will be the last decent quarter this year and from here on it’s downhill. Hard. Next big bucks will be made to the down side.
Invalidation is above 23100.
short term: Neutral. Could do 23000 or not. Today was end of month and I will wait and see what the us markets do tomorrow. Dax will be closed. Expecting a huge reversal any day now.
medium-long term from 2024-03-16: Bear trend is ongoing but for now I still think 19500 and below is an amazing buy if you can hold for years. Things will have to turn really bad for this market to find acceptance below the bull trend line from the covid lows and right now this trade war is just front running. Markets were not priced for risk 3 weeks ago but this drop was too much too fast. My bearish targets for this year are met and with the current environment I will not call for lower prices than 19000. If the trade war turns real bad, yeah sure but for now it’s not.
trade of the day: Selling 22700, decent double top and was good for 300 points down. Had to be mentally flexible and not try to hold short while market did a v-reversal. I fought it too much today.

#BEARISH MOVE EXPECTEDIn this analysis we're focusing on 1H time frame for gold. In this analyze we are using downward trendline along with the combination of price action. When price enter in our supply area, so our first step is to observe how price will react and if price give any bearish confirmation then we'll execute our trade. Confirmation is very important.
Always use stoploss for your trade.
Always use proper money management and proper R:R ratio.
This is my analysis not a financial advice.
#XAUUSD 1H Technical Analysis Expected Move.

BTCUSD | Bearish Rejection from Order Block Zone | Choch Confirm📉 BTCUSD – 30M SMC Breakdown | April 30, 2025
Bitcoin just printed a clean bearish reaction from a high-probability supply zone, aligned with Smart Money tactics.
📍 Technical Breakdown:
Order Block (OB) marked clearly near 95,474 – 95,756, sitting in a premium price zone.
Price returned to this OB after a previous Change of Character (Choch) to the downside — a clear signal of distribution.
The Strong High remains intact — no structural break = institutional control still active.
Rejection wicks and slow momentum near the OB confirm buyer exhaustion.
🎯 Setup Breakdown:
Entry Zone: 95,474 – 95,756
SL: Above 95,800 (invalidates OB)
TP Zone:
TP1: 94,600
TP2: 94,000
TP3: 93,480 (next liquidity pool near the Weak Low)
Risk:Reward ~ 1:3.5+
🧠 Smart Money Insight:
This is where retail traders start buying the breakout — but Smart Money knows better.
They set traps in the OB, then reverse price for maximum stop hunts.
🔁 Market Psychology:
Choch = shift in sentiment
Price retesting OB = liquidity hunt
Weak Low = magnet for future price sweep
This short setup aligns with mitigation + manipulation + distribution.
📌 What to Watch:
If price fails to break Strong High → short bias remains
If we break below 94,600 → hold for full TP at 93,480
Re-entry possible on LTF pullbacks into new internal OBs
🧠 Execution Note:
Be patient — price might dance in OB before melting. Let it reject, confirm, and flow.
🔥 Final Word:
This setup is clean, logical, and follows institutional flow. If you missed the first touch, wait for a lower-timeframe pullback entry.
Smart traders don’t chase price — they let it come to them. 🧘♂️📉
🗣️ Comment “BTC BEAR ZONE” if you caught this short setup.
📥 Save this post — real case study for Smart Money traders.
📡 Share this with your trading group — gems like this don’t show up daily.

GU-Wed-30/04/25 TDA-Lots of red news ahead, watch out!Analysis done directly on the chart
Sometimes we need to step back and
recharge ourself to continuously do
good and great.
Not financial advice, DYOR.
Market Flow Strategy
Mister Y

GJ-Wed-30/04/25 TDA-Tomorrow BoJ rate decision!Analysis done directly on the chart
When you understand something, it's not
always easy to deliver the message to
others. We all try our best, do you agree?
Comment down below!
Not financial advice, DYOR.
Market Flow Strategy
Mister Y

30.04.25 Morning ForecastPairs on Watch -
GBP / AUD
AUD / JPY
GBP / JPY
EUR / USD
A short overview of the instruments I am looking at for today, multi-timeframe analysis down to what I will be looking at for an entry. Enjoy!

USDCAD | Technical Rebound or Final Stop Before the Crash?USDCAD is currently in a highly delicate phase: the price has reached a key weekly demand zone between 1.3720–1.3820, which overlaps with a strong Fibonacci retracement cluster (0.705–0.78) of the previous bullish leg. So far, the reaction has been muted, but price compression and fading volatility suggest a potential short-term rebound.
However, looking at the bigger picture, the macro and positioning signals are flashing red for the US dollar:
📊 COT Report: Non-Commercials are significantly increasing short positions on USD and reducing shorts on CAD → bearish bias on USDCAD
🧠 Retail sentiment: Most retail traders are long on USDCAD → contrarian bearish bias
🗓️ Seasonality: May is historically negative for the USD and positive for the CAD → further confirms the short thesis
Only a structural recovery above 1.4150 on the weekly close would invalidate the bearish setup. Until then, any retracement towards 1.3980–1.4050 should be seen as an opportunity to sell strength.
🎯 Key Levels:
Sell zone: 1.3980–1.4050
Invalidation: Weekly close > 1.4150
Targets: 1.3720 – 1.3550
🔔 Critical note: When everyone is long, often the only direction left is down.

USDJPY 4h Long Setup | Low Risk High Reward Market broke the descending structure with strong bullish impulse followed by higher lows respecting new trendline
Price retested the previous resistance now turned support zone with a bullish reaction
Entry is taken after confirmation of the retest holding and bullish continuation signs
Entry : 142.494
SL : 140.676
TP : 148.270
RR 1 : 3.2
Price action aligned with short-term bullish reversal structure and clear demand zone defense
Let price do the work

EURGBP Short SetupEURGBP Short Setup
4H Chart Trendline Breakdown and Retest
Entry : 0.84944
Stop Loss : 0.86678
Take Profit : 0.83310
RR 1 to 1.9
Market broke below the ascending support and retested the underside of a broken trendline confluence. Bearish pressure is building as price fails to reclaim 0.85396 zone. Clean structure for continuation to the downside.
Price is now respecting lower highs with momentum shifting beneath structure. This setup targets the previous demand zone near 0.833 region where price consolidated before the last impulse up.
As long as price holds below 0.854 zone, bearish bias remains valid.

UBER Long Breakout Play | 4H ChartUber Technologies Inc. (UBER) just broke out of a long-standing descending trendline, confirming a bullish structural shift.
Entry: $79.43
SL: $70.45
TP: $86.93
R:R : 1:1.8
Technical Highlights
• Clean breakout above descending trendline and horizontal resistance at $77.35
• Retest and hold above previous resistance confirms bullish strength
• Strong bullish momentum and candle close above key levels
• Targeting the next major resistance zone near $87
Bias
Bullish continuation as long as $77.35 holds as support.
Plan
Trail stop if price sustains above $82. Look for volume confirmation on breakout retest.

2025-04-29 - priceactiontds - daily update - nasdaqGood Evening and I hope you are well.
comment: We see big bear spikes but no follow-through. Once every dip stalls, bears are out and bulls take over again and inching this higher. Tomorrow we either get a strong breakout above or below. As of now bulls are in full control, since bears have not traded below the prior’s day low for 6 consecutive trading days. Pain trade is up. Tomorrow is end of month, so I do think bulls want this monthly bar to be a big duck you to the bears and close it above 20000.
current market cycle: trading range
key levels: 19000 - 20000
bull case: Bulls want 20000. As long as they stay above 19379, they remain in control. Not a strong trend up but it’s making higher lows and higher highs. So buy pullbacks until it stops working. Do. Not. Buy. The. Highs.
Invalidation is below 19379.
bear case: Bears need to stop the higher highs and start making meaningful lower lows again. They are trying to get some selling going but on any decent resistance where market stalls, they run for the exits and bulls pump it higher. Bears are making money on selling new highs though. I turn bear again, once we drop below 19200. Neutral range is 19200 - 19700
Invalidation is above 19720.
short term: Can’t be anything but bullish. Bears could come around strongly any day, given that we only get bad news currently but so far, market does not care and we are squeezing hard. 20000 is the price to hit now.
medium-long term - Update from 2024-04-20: My most bearish target for 2025 was 17500ish, given in my year-end special. We are +18% from the lows and I do think, once this turns again, it will easily be the short trade of the year.
trade of the day: Buying the spike down below 19400 and betting on a lower high. Shorting 19600 was decent because you could have down it all day and made a duckton of money.

XAUUSD is UncertainA few of high impact news tomorrow and it will determine if XAUUSD will continue its trend or break further correct itself tomorrow. If it breaks 3300, the probability it will drop further for correction is highly probable. If not then it will continue its trend to the upside.

AUDJPY: H4, H1 Forecasts, Technical Analysis & Trading IdeaTechnical analysis is on the chart!
No description needed!
OANDA:AUDJPY
________________________________________________________________
❤️ If you find this helpful and want more FREE forecasts in TradingView,
. . . . . . . . Hit the 'BOOST' button 👍
. . . . . . . . . . . Drop some feedback in the comments below! (e.g., What did you find most useful? How can we improve?)
🙏 Your support is appreciated!
Now, it's your turn!
Be sure to leave a comment; let us know how you see this opportunity and forecast.
Have a successful week,
ForecastCity Support Team

When Moving Averages Meet the Demand ZoneOne of the simplest ways to identify the market trend is by using the moving average (MA) indicator.
When price moves above the MA, it's generally considered an uptrend.
When price moves below the MA, it's seen as a downtrend.
Aside from showing the trend, moving averages can also act as dynamic support and resistance:
In an uptrend, the MA acts as support — meaning if price retraces into the MA, it often bounces back and continues upward.
In a downtrend, the MA acts as resistance — price tends to reject the MA and move lower.
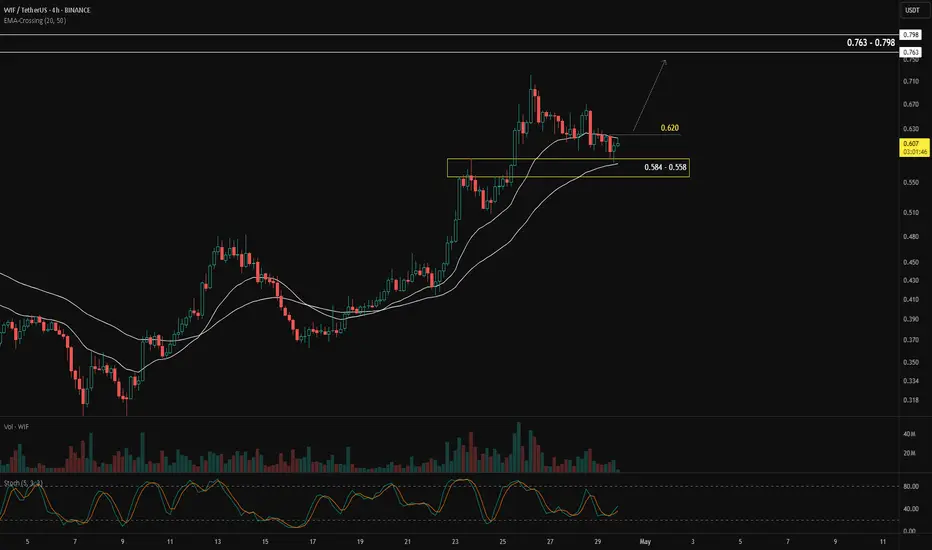
In BINANCE:WIFUSDT , the moving average is currently acting as support, and price is pulling back into a confluence zone between 0.584 – 0.558, where the MA meets a demand zone. This setup increases the probability of the pullback ending and the uptrend continuing.
The confirmation for a bullish continuation would be a break and close above 0.620.
If that happens, the next target zone is between 0.763 – 0.789.
Keep a close eye when price approaches the previous high. The ideal scenario is a strong impulsive breakout. The worst-case scenario would be a rejection or false breakout from that level.
Alright, what's your take on BINANCE:WIFUSDT ?
Pullback's Almost Over — Get In Before It RunsThe best time to enter in a bull market is during a pullback — when price temporarily retraces before continuing its upward trend.
In the case of BINANCE:SUPERUSDT , price is currently pulling back into a demand zone between 0.7178 – 0.7109. The overall structure remains bullish, with the blue arrows showing a series of higher lows and the red arrows indicating higher highs.
We expect the price to bounce from this demand zone and potentially break the previous high, continuing the bullish trend.
To confirm the pullback is ending and a reversal is underway, we’ll watch for candlestick patterns. Here are two possible bullish confirmation scenarios:
Price breaks and closes above the high of the last red candle — a bullish engulfing setup.
Price dips deeper into the demand zone, then forms a bullish pattern such as:
Bullish Engulfing
Bullish Harami
Other reversal signals, like a close above the high of the previous two candles.
These are the scenarios I’m watching for on $SUPERUSDT.
Let me know your thoughts!

Bullish Pennant in ARDR: A Pause Before Another RallyAfter an aggressive surge marked by a big green candle, BINANCE:ARDRUSDT is now moving sideways. This sideways action represents a "voting phase" between buyers and sellers — a battle to decide who will take control next.
Looking at the current price structure, this consolidation is setting up a potential continuation move toward the next target zone at 0.15199 – 0.15900.
Technically, the sideways movement is forming a bullish pennant pattern — a classic sign where price briefly pauses after a strong rally, gathering momentum before continuing its upward trend.
One thing to watch: after breaking the previous high (marked by the red arrow), price should not fall back into the pennant structure. A re-entry would weaken the bullish setup.
As long as price holds above the key support at 0.12273, the bullish scenario remains intact.
What's your view on this setup?

GOLD ANALYSISIn this analysis we're focusing on 1H time frame for Gold. Today I'm expecting bullish momentum and my bias was bullish. On the basis of SMC concept and price action when price reach my zone and give any bullish confirmation, after observing strong confirmation. I'll trigger my trades. Let's see what happens and which opportunity market will give us.
This is a higher time frame outlook. Let's analyze more deeply in smaller time frame for finding ideal and crucial entry point. Confirmation is very important.
Always use stoploss for your trade.
Always use proper money management and proper risk to reward ratio.
This is just my analysis.
#XAUUSD 1H Technical Analysis Expected Move.

GU-Tue-29/04/25 TDA-Interesting GBP strength yesterday!Analysis done directly on the chart
Interesting GBP strength yesterday compared to its peers
USD, EUR. What could possibly fueled this move up?
Amid of US-China trade war potential negotiation and ahead
of next important week of interest rate decisions.
Comment down below your thoughts!
Not financial advice, DYOR.
Market Flow Strategy
Mister Y

GJ-Tue-29/04/25 TDA-More bullish structures, will we go up?Analysis done directly on the chart
Ahead of BOJ interest rate decision,
USD core CPI and NFP. What's your
thoughts on the market?
Comment down below!
Not financial advice, DYOR.
Market Flow Strategy
Mister Y
