Gold – 24 July: Watching H4 OB Zone for Bullish ReversalGold – 24 July Outlook
Watching H4 OB Zone for Potential Reversal
📌 Recap of 23 July Trade:
As outlined in yesterday’s analysis, the M15 Order Block ( 3417–3412 ) held well. The market reacted precisely from this level, and our long setup successfully hit the defined 120-pip target .
However, after reaching a high near 3434 , the price failed to break above and instead rejected sharply, breaking the recent M15 higher low — a key structural sign that signals the start of a possible H4 pullback phase.
🔍 Current Market Context:
Trend Overview:
While the overall bias remains bullish, this break of M15 structure suggests short-term weakness and a corrective move in progress on the H4 chart.
Key Zone in Focus:
H4 Order Block Zone: 3359 – 3345
This is a critical zone to watch today. The market is currently trading around this area, and it could act as a potential reversal point where the uptrend resumes.
🎯 Trading Plan:
– Closely monitor the price action within the 3359–3345 zone.
– If price respects this zone and LTF (e.g., M1) shows signs of structure flip or ChoCH + BoS , it could present a fresh long setup opportunity.
– As always, only act on the trade if multiple confluences align — don’t anticipate, let the market confirm.
📈 Summary:
Bias: Watching for a bullish reversal from the 3359–3345 zone.
Setup Condition: Wait for clear LTF confirmation before entering.
Risk Management: Stick to 1:3 RR — 40 pip SL and 120 pip TP as per system.
Let the market come to your setup. Patience is your greatest edge.
📘 Shared by @ChartIsMirror
Priceaction

EURGBP Analysis : Breakout, Central Zone Flip & Reversal Target🧠 Overview:
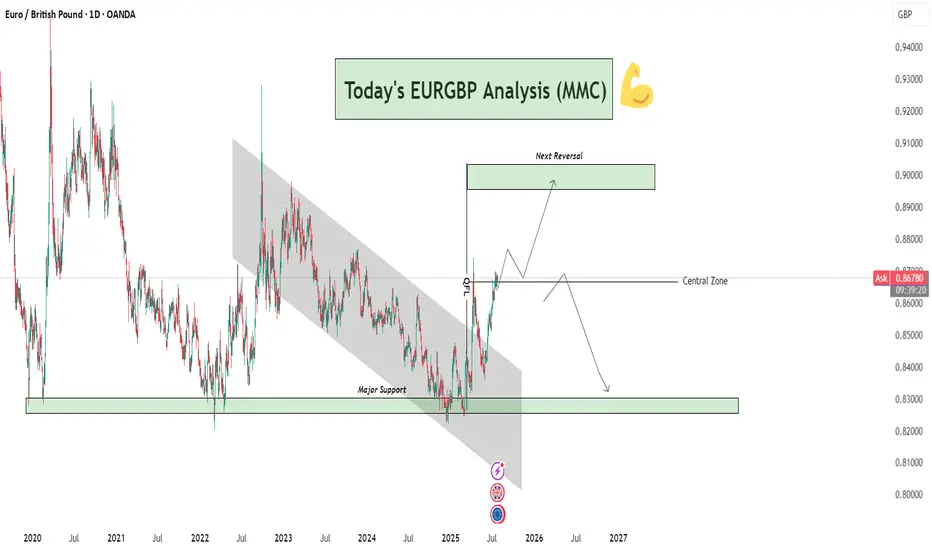
This EURGBP daily chart clearly presents a bullish breakout from a long-term descending channel, a successful reclaim of the central structure zone, and a projection toward a key reversal level. This analysis incorporates Smart Money Concepts (SMC), Market Maker Concepts (MMC), and classic structural behavior.
🔍 Technical Breakdown:
📉 Long-Term Bearish Channel (2021–2025)
For nearly 4 years, EURGBP was trapped in a descending channel, forming consistent lower highs and lower lows.
This long-term bearish phase reflects strong supply-side control and institutional distribution.
The breakout above this structure is significant — marking a potential mid- to long-term trend reversal.
🔁 Major Support Zone (0.8300–0.8350)
Price bounced strongly from this historical demand zone multiple times (in 2021, 2022, and recently in 2025).
This zone is critical and acts as a high-volume accumulation area where smart money has stepped in.
The strong reaction from this level in 2025 triggered the breakout of the bearish structure.
🚀 Break of Structure + Retest
After breaking the descending channel, price retested the upper boundary, confirming a structure shift.
The breakout retest succeeded — marking the transition from a bearish phase to a bullish expansion.
📍 Central Zone Flip
The Central Zone, once a resistance/supply area during the downtrend, has now been reclaimed as support.
This is a powerful MMC concept – where the "central balance" of a structure flips and becomes a base for the next impulse.
Current price is sitting just above this zone, indicating bulls are still in control.
🎯 Next Reversal Zone (Target Area: 0.9000–0.9050)
The chart outlines a projected bullish move toward the Next Reversal Zone marked above.
This is a key supply area, likely to trigger profit-taking or institutional sell orders.
Expect price to range or wick into this zone before showing a possible bearish reversal.
🔄 Future Projection Scenarios:
Scenario 1 – Bullish Continuation:
Price continues to build bullish structure and approaches the 0.90 reversal zone.
Rejection from this zone may trigger consolidation or a minor retracement.
Scenario 2 – Major Reversal:
Upon hitting the next reversal zone, price could reverse and fall back toward the Central Zone or even the Major Support below, especially if macroeconomic fundamentals shift.
🔑 Confluences Supporting This Setup:
✅ Element 🧩 Description
🔹 Major Support Historical demand zone with repeated rejections
🔹 Channel Breakout Structure shift confirming bullish interest
🔹 Retest Success Technical confirmation of breakout validity
🔹 Central Zone Flip Old resistance → new support (MMC principle)
🔹 Reversal Zone Anticipated next profit-taking / supply area
📌 Strategic Insight:
Bias: Bullish short-term to mid-term
Entry Opportunity: Lower timeframe pullbacks into Central Zone (or retest zones)
Target: 0.9000–0.9050 area
Watch for Rejection: In reversal zone for potential bearish shift
⚠️ Risk Note:
Always wait for confirmation at reversal zones. Overextended moves without correction can quickly retrace. Manage your trades with stop-losses below key structural levels and maintain strict risk-reward planning.
🧠 Conclusion:
EURGBP has transitioned from a long bearish cycle into a bullish expansion phase. Smart Money accumulation at the base and a clean breakout with retest confirm a strong directional shift. Keep your focus on the Central Zone retests and the Reversal Zone reaction for optimal entries or exits.
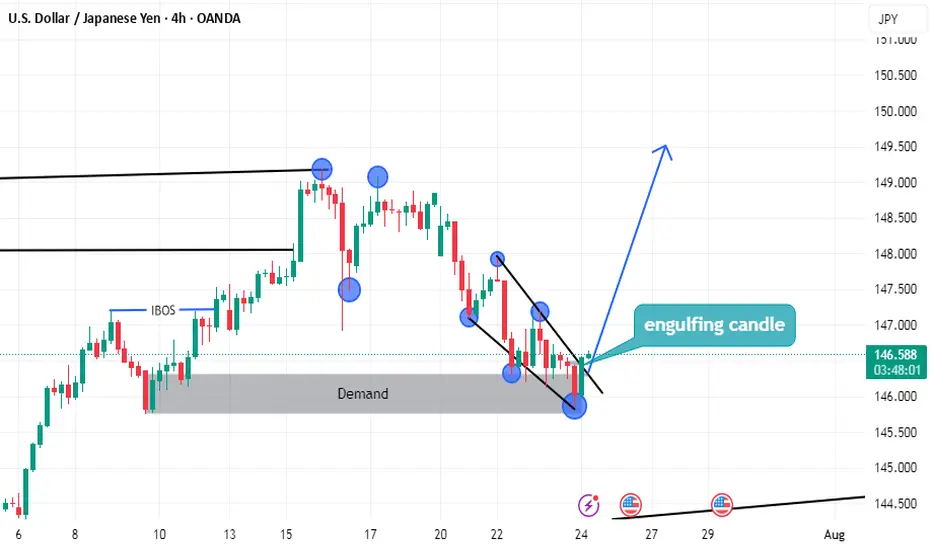
USDJPY LONG setupsimply
we have demand
and the price can't lower low
end we have break of structure on low time frame
and we have more but i don't have enough time to tell you
Look the photo well
BTCUSD Analysis (MMC) : Dual Directional Outlook let's See🔍 1. Overview of Structure & Context:
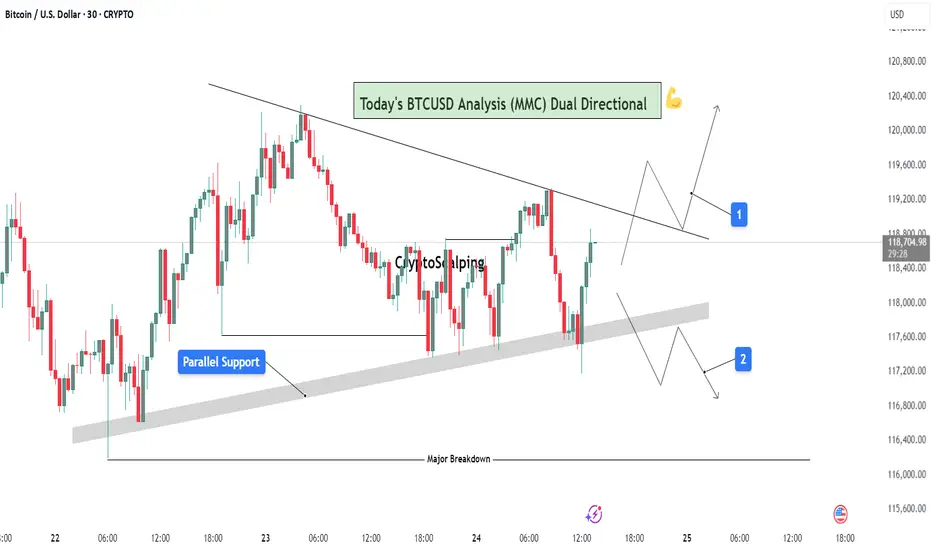
On the 30-minute timeframe, BTCUSD is consolidating between two strong technical zones:
A descending trendline acting as resistance
A parallel rising support forming a compression zone
This wedge-like formation signals a potential high-impact move in either direction — a dual-directional outlook. Price is currently testing the midpoint between resistance and support, offering two reactive trade scenarios.
🟦 2. Key Zones Highlighted on Chart:
🔹 A. Parallel Support Zone (Dynamic Support):
A grey-shaded rising support has been tested multiple times.
Each bounce suggests buying strength near this diagonal zone.
This zone represents smart money accumulation potential under MMC concepts.
As price approaches this zone again, bulls are expected to step in if momentum aligns.
🔹 B. Descending Resistance Line (Supply Line):
The market is facing lower highs, a sign of bearish control at higher levels.
Each retest of this line has led to a rejection.
This line also acts as a liquidity magnet — price may spike above it to trap buyers before dropping (false breakout potential).
🧭 3. Scenarios and Trade Possibilities (Dual Directional Path):
✅ Scenario 1: Bullish Breakout – (Marked as Path 1)
If BTC breaks above the descending trendline with strong bullish volume, this confirms a structural breakout.
This setup targets:
First level: $119,600
Second level: $120,200
Once broken, the trendline can flip into support.
Ideal confirmation:
Bullish engulfing candle on breakout
Retest of broken resistance turning into support
Volume surge or momentum indicators turning bullish
⚠️ Scenario 2: Bearish Rejection & Breakdown – (Marked as Path 2)
If BTC fails to break resistance and breaks below the parallel support zone, it opens a bearish scenario.
Price may fall back to:
First level: $117,200
Final key support: $116,400 (Major Breakdown Zone)
This is a typical MMC-style mirror move: a structure break leading to liquidity run toward a previous demand zone.
Bearish confirmation:
Close below grey zone
Lower high formation near resistance
Increasing bearish volume / weak bounce
📐 4. Strategy & Trading Tips (MMC Application):
Under the Mirror Market Concepts (MMC), these zones are not just technical levels — they represent emotional price memory of both institutional and retail players.
Wait for the reaction, not prediction.
Use confluence tools (RSI divergence, volume, candle patterns).
Avoid trading inside the wedge — it's a trap zone.
Ideal entries are at breakout with retest confirmation or rejection from major zones.
📊 Risk Management Plan:
Entry Type Trigger Level SL Suggestion TP Range
Long Trade Break & retest above $118.8K Below $118.2K $119.6K → $120.2K
Short Trade Breakdown below $117.8K Above $118.2K $117.2K → $116.4K
🧠 Conclusion:
BTC is in a decision-making zone between a downward pressure line and strong support. A breakout could lead to a clean trend continuation, while a breakdown would trigger bearish momentum. The chart reflects precision MMC logic, offering a tactical map for day traders and scalpers to follow the smart money — not the noise.
Let the market decide direction. We just need to be prepared, not predictive.
GU-Wed-23/07/25 TDA-Cluster of PMI news now, watch out!Analysis done directly on the chart!
Premise:
A simple idea plan (like Tradingview public posts) won't describe everything.
No one can predict how market will move, it's always good to react to how it moves.
It gives an idea of how price might move, but no one come from FUTURE.
So I always encourage people to openly and actively discuss in real time.
I don't give signals blindly, people should learn
and understand the skill.
Following blindly signals you won't know how to
manage the trade, where precisely put sl and tp,
lot size and replicate the move over time.
That's why you need active real time discussions.
Trading is not get rich quick scheme!
Active in London session!
Not financial advice, DYOR.
Market Flow Strategy
Mister Y

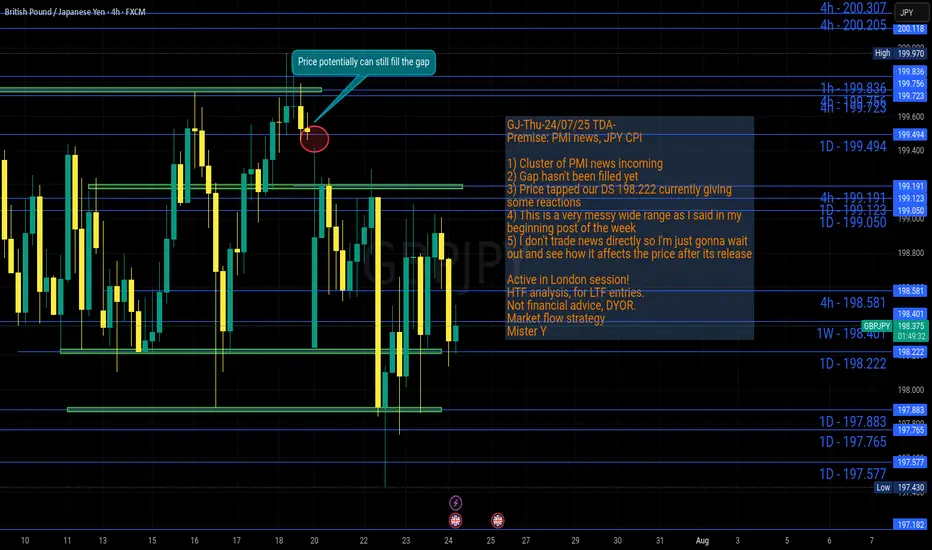
GJ-Thu-24/07/25 TDA-Messy wide range, gap hasn't been filled yetAnalysis done directly on the chart!
Premise:
A simple idea plan (like Tradingview public posts) won't describe everything.
No one can predict how market will move, it's always good to react to how it moves.
It gives an idea of how price might move, but no one come from FUTURE.
So I always encourage people to openly and actively discuss in real time.
I don't give signals blindly, people should learn
and understand the skill.
Following blindly signals you won't know how to
manage the trade, where precisely put sl and tp,
lot size and replicate the move over time.
That's why you need active real time discussions.
Trading is not get rich quick scheme!
Active in London session!
Not financial advice, DYOR.
Market Flow Strategy
Mister Y
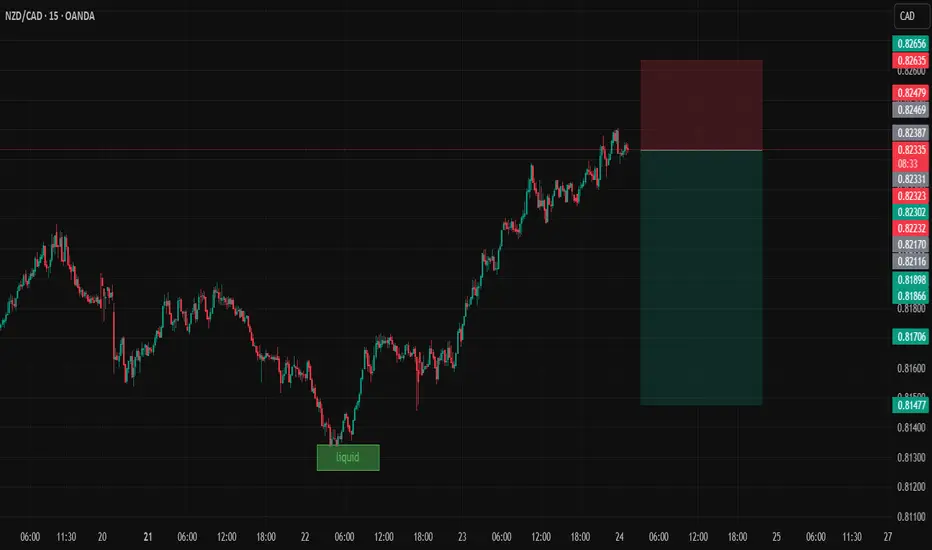
NZDCADDate:
July 24,2025
Session:
Tokyo and London session
Pair:
NZDCAD
Bias:
Short
liquidity pool that is waiting to be swept this week. Looks like price is gonna be magnetized towards that pool level during London and Tokyo. The trade may even stretch into NYC.
Entry: 0.82331
Stop Loss: 0.82635
Target: 0.81475
RR: 2.81
EUR/JPY: Bullish Thesis on Policy DivergenceOur primary thesis is built on a powerful confluence of compelling fundamental drivers and a clear technical structure. We are taking a long position in EUR/JPY with high conviction, anticipating significant upside fueled by a stark monetary policy divergence confirmed by a constructive chart formation.
📰 Fundamental Analysis: The core of this trade is the widening policy gap between the European Central Bank (ECB) and the Bank of Japan (BoJ). While the BoJ is only just beginning to exit its ultra-loose monetary policy, the global environment points toward continued JPY weakness. The upcoming high-impact US news will act as a major catalyst. A "risk-on" reaction to the data would significantly weaken the JPY, providing a strong tailwind for this trade.
📊 Technical Analysis: The chart structure for EUR/JPY is decidedly bullish. The pair has established a clear uptrend, and recent price action indicates a period of healthy consolidation above key support levels. This presents a strategic entry point, as the market appears to be gathering momentum for the next leg higher. The current setup suggests a low-risk entry into a well-defined upward trend.
🧠 The Trade Plan: Based on this synthesis, we are executing a precise trade with a favorable risk profile.
👉 Entry: 172.422
⛔️ Stop Loss: 171.292
🎯 Take Profit: 174.684
⚖️ Risk/Reward: 1:2

BUY XAUUSD 24.7.2025Counter-trend trade order: SELL at H4~H1~M15
Type of entry: Limit order
Reason:
- If the price breakout at 3,391 confirming the uptrend.
Note:
- Management of money carefully at the price of last top (3,390)
Set up entry:
- Entry sell at 3,383
- SL at 3,379
- TP1: 3,390
- TP2: 3,400
Trading Method: Price action (No indicator, only trend and candles)

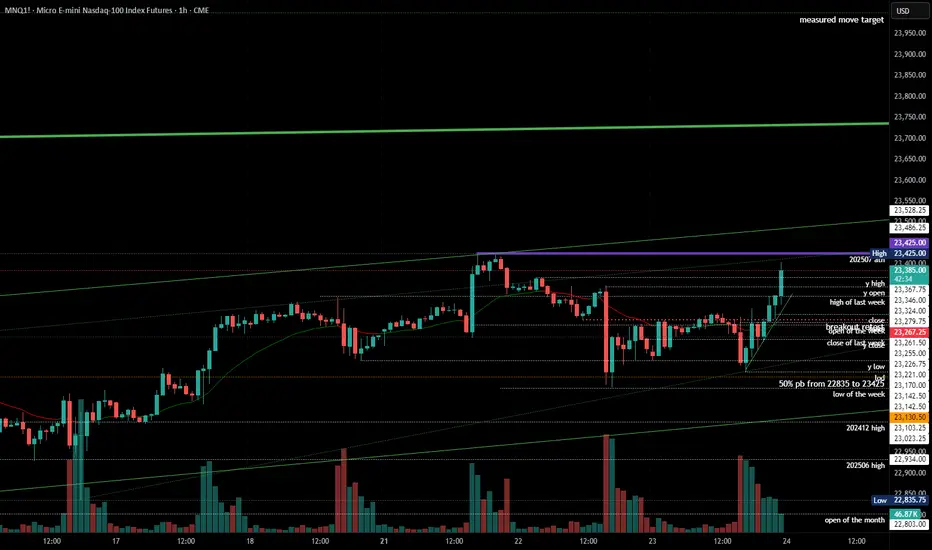
2025-07-23 - priceactiontds - daily update - nasdaqGood Evening and I hope you are well.
comment: Very tight channel up from 23142 but only 1 bear bar since then and in the absence of bear bars, we can only assume sideways to up movement.
current market cycle: bull trend
key levels: 23000 - 24000
bull case: Bulls want to print more higher highs. We are in this bull channel for the whole July now without breaking it and bulls now confirmed the breakout above 23100ish - 3 times. That is the 50% retracement of the last big leg up and very important. A measured move for this leg gives us 24000. Bears have tried with two decent legs to get down to 23000 and failed. I think many will give up on this after hours buying and we can have more meltup into the weekend. Anything bearish would be a big surprise.
Invalidation is below 23250ish.
bear case: Bears tried and failed again. Everything is bought. 1h close below 23250 would certainly stop the max bullishness but bears are really not doing much. We are almost printing daily new ath. Focus on longing pullbacks until the bull channel is broken.
Invalidation is above 24000.
short term: Bullish on any pullback until it stops working.
medium-long term - Update from 2024-06-29: No change in plans. I expect 20000 to get hit over the next 3 months and maybe 19000 again.
trade of the day: Long 23200 has been profitable since Friday.
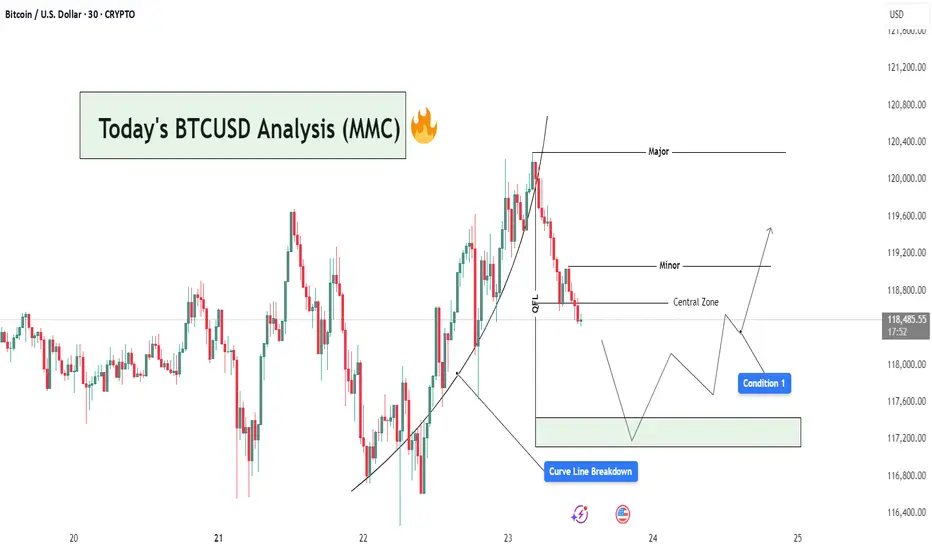
BTCUSD Analysis : Curve Line Breaked and Move Towards Target📊 Market Overview:
BTCUSD has recently completed a strong bullish leg, following a parabolic curve formation that led price into a Major Resistance Zone near the $120,400 level. This rally aligns with MMC principles where price forms momentum-driven structures before reaching high-liquidity zones (often ending in exhaustion).
📍 1. Curve Line Support & Breakdown – A Shift in Sentiment
Your chart shows a clear Curve Line that supported the bullish impulse. Price respected this dynamic support throughout the uptrend until a Curve Line Breakdown occurred—marking the first sign of bullish weakness.
In MMC strategy, this curve structure breakdown is critical:
It tells us the accumulation → expansion → exhaustion cycle is ending.
The market is likely entering retracement or distribution phase.
Price often seeks lower equilibrium, typically around the Central Zone.
🧠 2. QFL Zone (Quick Flip Level) – The Hidden Base
Immediately after the curve broke, price moved toward the QFL level, which represents a demand base from earlier structure. This zone acts as a short-term support and often produces a reactive bounce (but not always a reversal).
Watch closely:
If price respects this zone → temporary relief bounce
If it fails → we’ll likely see full test of Central Zone or lower demand levels
🟩 3. Central Zone – The MMC Decision Area
The Central Zone is a key horizontal level on your chart, defined between ~$117,300 and ~$118,200. This zone is marked based on:
Previous structure
Volume clusters
Demand imbalance
Why is this zone important?
It serves as the balance point between buyers and sellers.
A bullish reaction here could re-initiate a move toward Minor Resistance (~$119,200).
A failure to hold could open the door for deeper retracement toward the green demand box (~$117,200 or below).
🔄 4. Two Primary MMC-Based Conditions to Watch:
✅ Condition 1: Bounce from Central Zone
Price reacts from within the Central Zone
Forms bullish structure (double bottom, bullish engulfing, or reversal wick)
Short-term target becomes Minor Resistance (~$119,200)
If volume increases and price breaks above Minor, continuation toward Major is possible
❌ Condition 2: Breakdown & Bearish Continuation
Price fails to hold within Central Zone
Bearish structure forms (e.g. lower highs, breakdown candles)
Clean move expected toward next liquidity pocket at $117,200–$116,800
This would confirm market shifting into bearish control
📌 5. Minor vs Major Levels – Key Zones
Minor Resistance (~$119,200): Short-term target if bounce occurs
Major Resistance (~$120,400): Liquidity sweep zone, strong supply
Green Demand Box (~$117,200): If Central Zone fails, this becomes next bounce zone
📘 Final Thoughts:
This is a classic MMC setup in real-time:
Curve Formed → Broke
OFL + Central Zone → Now being tested
Next move depends on confirmation from buyers or sellers at Central Zone
Don’t trade emotionally — let price action give you confirmation before taking any positions. Watch the Central Zone behavior closely and manage risk based on scenario outcomes.
GJ-Wed-23/07/25 TDA-Gap hasn't been filled yet!Analysis done directly on the chart!
Premise:
A simple idea plan (like Tradingview public posts) won't describe everything.
No one can predict how market will move, it's always good to react to how it moves.
It gives an idea of how price might move, but no one come from FUTURE.
So I always encourage people to openly and actively discuss in real time.
I don't give signals blindly, people should learn
and understand the skill.
Following blindly signals you won't know how to
manage the trade, where precisely put sl and tp,
lot size and replicate the move over time.
That's why you need active real time discussions.
Trading is not get rich quick scheme!
Active in London session!
Not financial advice, DYOR.
Market Flow Strategy
Mister Y

GOLD Rejected from Reversal Zone – Retest + Bounced & Major High📌 1. Major High & Liquidity Grab
The chart starts by showing a strong impulsive move toward the upside that taps into a Major High zone (highlighted at the top). This is a classic MMC "liquidity grab" where price sweeps the previous high to trigger stop losses and collect orders before reversing. This is a common trap zone where retail traders get caught in FOMO buys.
📌 2. Reversal Area Identified
The price entered a clearly marked Reversal Area between $3,430 – $3,445. This zone acted as:
Historical supply area
Psychological resistance
Liquidity hunt zone
Upon entry, strong rejection candles formed, signaling institutional sell pressure. This reaction aligns with MMC principles where reversal is expected post-liquidity collection from major highs.
📌 3. Parabolic Curve Formation – Bullish Impulse
A beautifully formed parabolic curve (Black Mind Curve) supported the bullish rally from around $3,310 up toward the high. This shows accumulation → breakout → expansion. However, the curve has now been broken, suggesting that bullish momentum is weakening.
⚠️ This break of curve support is critical — it often leads to a corrective phase or a deeper retracement.
📌 4. Mini Reversal Zone + SR Interchange Zone
Price has now pulled back to a very important area: the Mini Reversal Zone + SR Flip Zone around $3,400. This zone previously acted as resistance and now has the potential to act as support (classic SR interchange).
According to MMC concepts:
If this zone holds → we may see a bullish bounce and potential re-test of the upper reversal area.
If this zone breaks → bears will likely push price toward the next demand level around $3,350 – $3,340.
This is the decision point — a “battlefield” zone where market direction can be decided.
📌 5. Potential Scenarios Ahead:
✅ Bullish Scenario:
Price respects the SR zone ($3,400)
Forms bullish engulfing / continuation pattern
Likely target: re-test of reversal zone ($3,430–$3,445)
Beyond that: breakout possible if volume supports it
❌ Bearish Scenario:
Price breaks below $3,395 with strong bearish candles
Could confirm the rejection from the major high and trigger a full retracement
Downside targets: $3,360 → $3,340 range
🔑 Final Thoughts:
This GOLD setup is a perfect case of MMC theory in action — liquidity grab at the top, rejection at reversal zone, curve break, and now testing critical SR flip area.
Keep an eye on:
Candlestick behavior at the SR zone
Volume confirmation
Momentum indicators (if using)
Wait for confirmation before jumping in — let the market reveal its hand at the decision zone.

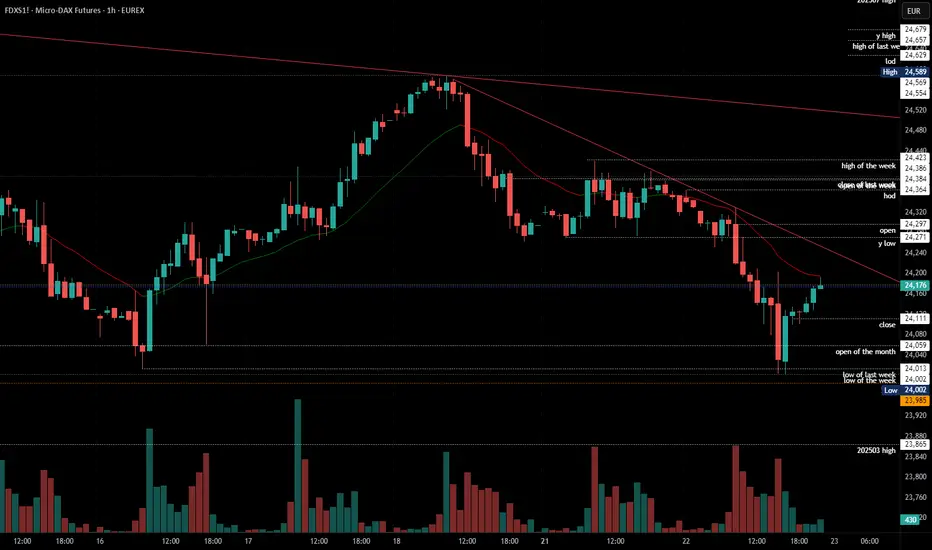
2025-07-22 - priceactiontds - daily update - daxGood Evening and I hope you are well.
comment: Bears had two legs down and the reversal from 24000 was strong enough to doubt this can go below 24000. I do expect some form of re-test of 24000 but the buying since then was insane again. Not a single 1h bar dropped below the prior one.
current market cycle: trading range
key levels: 24000 - 24600
bull case: Bulls next target is the breakout re-test of 24271 and if they can break above, the next target is today’s high at 24364. Above is likely no more resistance until 24450 or 24500. A print above 24271 would confirm the trading range and conclude the selling for now. This looks more like a two-legged move in a bigger trading range than stronger selling.
Invalidation is below 24350.
bear case: Bears need to keep it below the breakout price and re-test 24000. If they can leave an open gap, that would be great. Best would be to go sideways and stay below 24100 then but for now I have no trust in the bears.
Invalidation is above 24271.
short term: Neutral. No trust in bears but it would be great if we would stay below 23271 and test 24000 again. Daily close below 24000 would be a dream for bears. Above 24271 I would probably look for longs and higher prices again.
medium-long term from 2025-06-29: Bull surprise last week but my targets for the second half of 2025 remain the same. I still expect at least 21000 to get hit again this year. As of now, bulls are favored until we drop below 23000
trade of the day: Selling EU open, no bigger resistance and only red bars on the 1h chart.
USDJPYDate:
July 22,2025
Session:
Tokyo and London session
Pair:
USDJPY
Bias:
Long
1. Clean liquidity pool left unswept from last week's NYC Open (Thursday).
Took this trade earlier today but looks like price wanted to consolidate in the liquid pool its currently in. I still hold the same idea and think the sweep will definitely take place sometime this week. Now looks like the perfect time to enter. If Asia session cant get it done its up to London and New York session.
Entry:147.534
Stop Loss:147.215
Target:148.768
RR:3.89

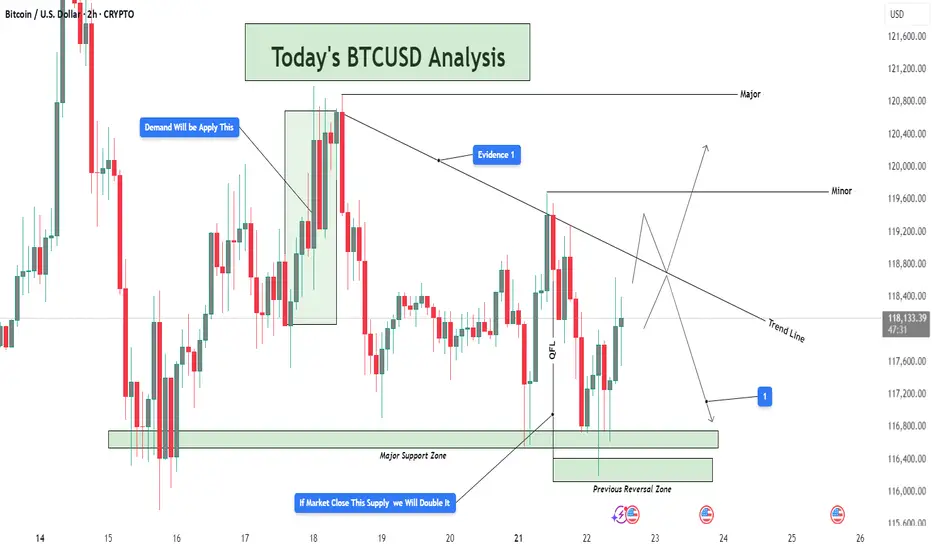
BTCUSD Analysis – Supply Pressure vs Demand Rejection 📊 Overview:
This BTCUSD 2-hour chart is giving us a clear structure of how price is currently reacting between a strong demand base and a descending trendline supply. We're at a critical decision point, where both buyers and sellers are gearing up for a potential breakout or breakdown. Let’s break it down level by level.
🟢 Demand Zone – Major Support Holding Firm
The Major Support Zone marked at the bottom of the chart is not just any random area—it has been tested multiple times and acted as a launchpad for bullish moves previously. This is also aligned with the Previous Reversal Zone, which adds confluence to this demand base.
Price dipped into this zone and immediately rejected with strong bullish candles, showing aggressive buyer interest.
This is a high-probability area for long setups as long as price stays above it.
You’ve noted on the chart: “If market closes this supply, we will double it” – that makes sense because a confirmed hold above this base increases the probability of upside continuation.
🔻 Trendline & Supply Zone – The Wall Ahead
Moving up the chart, price is being pressured by a descending trendline, acting as dynamic resistance. This trendline is not just drawn for decoration—it has rejected price at least twice already, and is also intersecting with a minor horizontal resistance zone.
This creates a confluence of resistance, making it a tough wall for buyers to break through without strong volume.
You’ve labeled it as “Evidence 1”, meaning the first confirmation of supply reacting here.
If BTC fails here again, we could easily see another pullback to the 116,800 – 116,400 range.
⚖️ QFL Pattern in Play
The QFL (Quick Flip Logic) is in action, where price aggressively dropped and formed a base, followed by a sharp move up. Price is now attempting to return to that base (demand zone) for a potential flip back upward.
If QFL holds and price breaks above the trendline, this will be a strong reversal confirmation.
This aligns with many institutional trading strategies which look for such formations near support zones.
📈 Potential Bullish Scenario:
Break above the descending trendline resistance
Price sustains above Minor Resistance Zone (around 118,800 – 119,600)
Next target: Major Resistance Zone between 120,800 – 121,200
This could create a higher-high structure and resume overall bullish trend
📉 Potential Bearish Scenario:
Failure to break the trendline
Rejection leads to price retesting the Major Support
If that zone breaks cleanly (especially below 116,400), price may drop toward 115,600 or lower
This opens up a possible short opportunity depending on price action and momentum
🎯 Conclusion:
This chart is a textbook example of consolidation between major zones. Bulls are defending hard at the bottom while bears are pushing down from the top. The direction of the breakout will dictate the next major move. Until then, wait for confirmation, avoid early entries, and let the market show its hand.
🧠 Patience = Profits.
🕒 Chart Timeframe: 2H
📌 Strategy in Focus: Supply & Demand Zones, Trendline Breakout, QFL Base Pattern
📍 Sentiment: Neutral-Bullish (Watching Trendline Reaction)
Dollar Index (DXY): Time to Recover
It looks like Dollar Index is going to recover after a yesterday's
rapid fall.
The market reached a key support and formed a cup & handle pattern on that.
We can expect a pullback at least to 98.09 level.
❤️Please, support my work with like, thank you!❤️

22.07.25 Morning ForecastPairs on Watch -
FX:GBPJPY
FX:AUDUSD
OANDA:XAUUSD
FX:GBPUSD
A short overview of the instruments I am looking at for today, multi-timeframe analysis down to what I will be looking at for an entry. Enjoy!

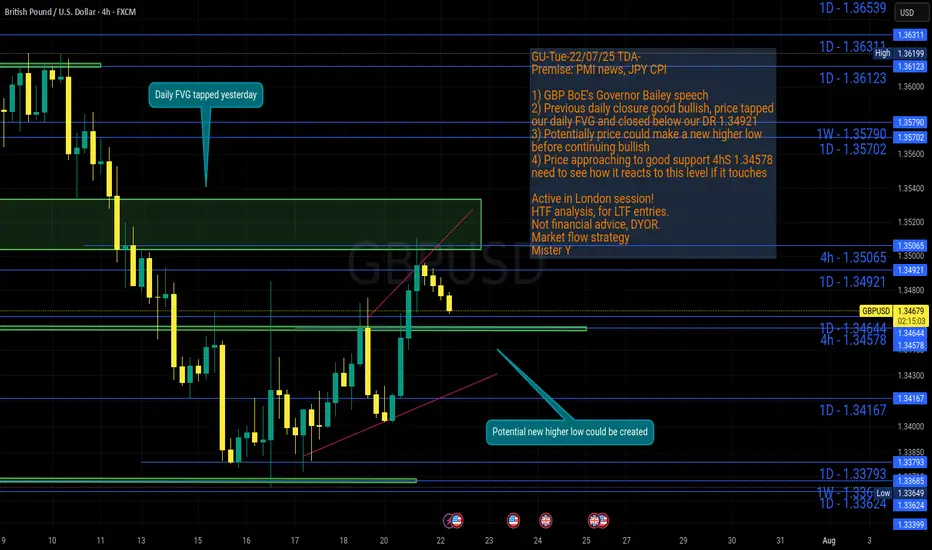
GU-Tue-22/07/25 TDA-Potential new higher low before continue?Analysis done directly on the chart!
Price gave a good bullish closure on daily candle yesterday,
if bullish trend continues, there's a good probability for price
to create a new higher low before continuing up.
Monitor and react to how price move from level to level.
Premise:
A simple idea plan (like Tradingview public posts) won't describe everything.
No one can predict how market will move, it's always good to react to how it moves.
It gives an idea of how price might move, but no one come from FUTURE.
So I always encourage people to openly and actively discuss in real time.
I don't give signals blindly, people should learn
and understand the skill.
Following blindly signals you won't know how to
manage the trade, where precisely put sl and tp,
lot size and replicate the move over time.
That's why you need active real time discussions.
Trading is not get rich quick scheme!
Active in London session!
Not financial advice, DYOR.
Market Flow Strategy
Mister Y
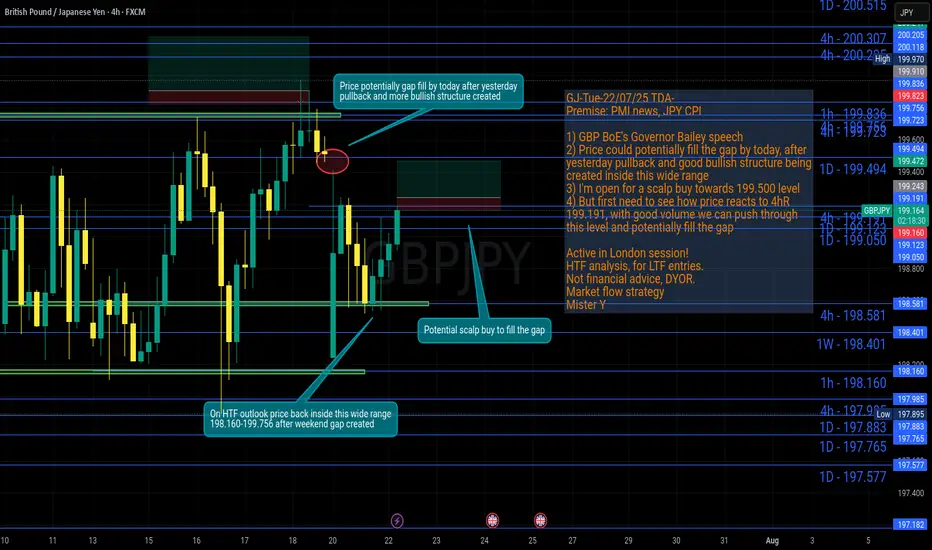
GJ-Tue-22/07/25 TDA-Potential scalp buy to fill the gap!Analysis done directly on the chart!
Weekend gaps in the majority of times (if not all the time) at some point
will be filled.
Premise:
A simple idea plan (like Tradingview public posts) won't describe everything.
No one can predict how market will move, it's always good to react to how it moves.
It gives an idea of how price might move, but no one come from FUTURE.
So I always encourage people to openly and actively discuss in real time.
I don't give signals blindly, people should learn
and understand the skill.
Following blindly signals you won't know how to
manage the trade, where precisely put sl and tp,
lot size and replicate the move over time.
That's why you need active real time discussions.
Trading is not get rich quick scheme!
Active in London session!
Not financial advice, DYOR.
Market Flow Strategy
Mister Y
Gold 22 July 2025 updateGood afternoon, update to last week's post of 21 July on gold, which worked yesterday, new zone to buy, the chart shows everything in detail, so today with the message "brevity is the sister of talent"
#GOLD
BUY LIMIT ZONE 3365-3370
🎯 TP1: 3385
🎯 TP2: 3400
🎯 TP3: 3412
🎯 TP3: 3428
⛔️ Stop loss: 3355
Regards, Totoshka™

Gold (XAUUSD) – 22 July Outlook | Reversal Zones in FocusGold (XAUUSD) – 22 July Outlook | Three Key Reversal Zones to Watch
Yesterday, Gold gave a strong breakout above the key resistance level at 3377 , shifting the M15 structure bullish and confirming upside strength.
Today, the market is likely entering a retracement phase on both the H4 and M15 timeframes — a healthy pullback after a breakout, which may lead to the next leg of the uptrend.
So where should we focus for long opportunities?
We are observing three key zones as potential bases for the continuation move:
📍 Zone 1 – 3377.6–3373.5 (Breaker Block):
This is the immediate structure zone — previous resistance which may now flip into support.
→ If price respects this area, we can anticipate a classic S&R Flip setup.
📍 Zone 2 – 3367.5–3363 (Demand Block):
If the first level doesn’t hold, this zone becomes critical. It lies just under the breakout base and could act as the next level of defense by bulls.
📍 Zone 3 – 3358.5–3350.5 (H4 Order Block):
This is the most significant support zone for the day. It aligns with a higher-timeframe order block, making it a high-probability POI for a deeper pullback and reversal.
But remember, we do not predict blindly .
Plan of Action:
– Observe price behavior at each zone
– Wait for confirmation via M1 internal structure shifts + BoS
– Trade only when all conditions align
– SL: 40 pips | TP: 120 pips
Risk-Reward: Always 1:3
Summary:
✅ Structure is now bullish on M15 and H4
✅ We’re in a pullback phase — ideal for continuation trades
✅ Three clear POIs mapped — now we wait for the market to speak
Patience. Precision. Discipline.
Let the trade come to you — not the other way around.
📘 Shared by @ChartIsMirror

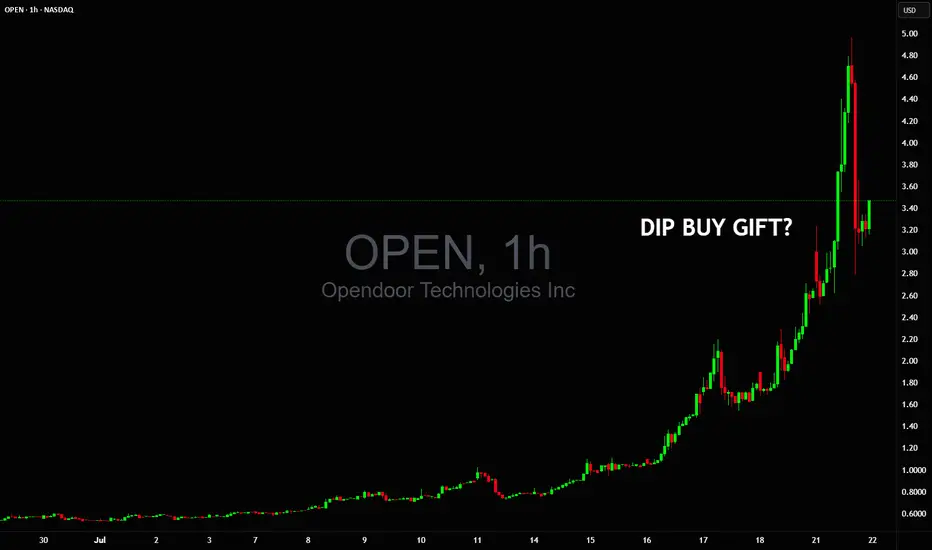
Could this dip $5 to $3 be a buy gift before double digits?Could this dip $5🔻$3 be a buy gift before NASDAQ:OPEN goes into double digits on NYSE:GME style vertical squeeze? 🤔
We haven't seen such 1 day volume in years so nobody really knows what's next 👀