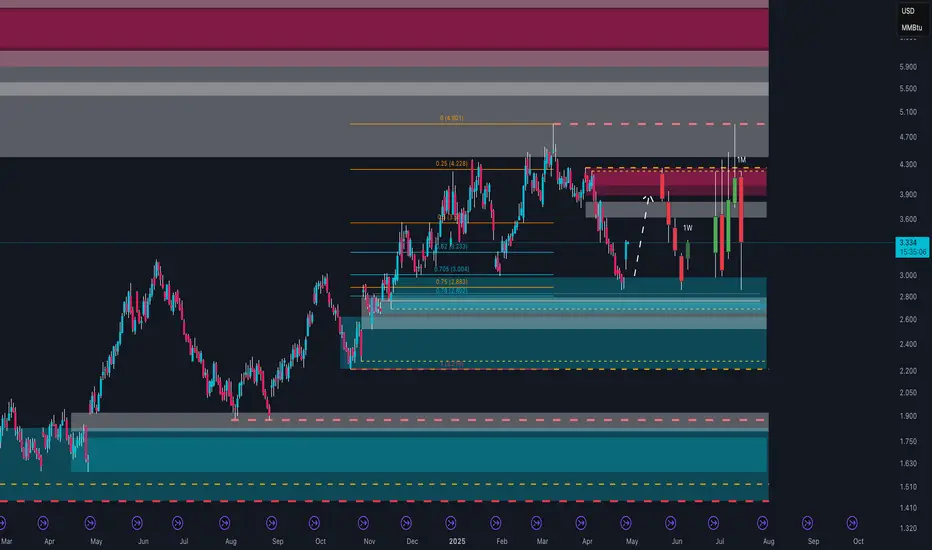
Natural Gas Ready to Explode?In recent months, Natural Gas (NG1!) has shown significant volatility, but now there are clear signals suggesting a major directional move could be imminent.
On the weekly technical chart, price has bounced from a strong demand zone between 2.50 and 2.70 USD/MMBtu, an area historically defended by institutional players. Currently, it is trading above 3.30 USD, consolidating in preparation for the next move. Key resistance zones to watch are between 3.90 and 4.20 USD, a region of high volume confluence and institutional supply.
Retail sentiment is extremely interesting: over 75% of retail traders are currently long. Historically, an excess of retail longs often leads to either corrections or accumulation/distribution phases, as large players tend to act against the majority.
Looking at the COT Report, the data supports the bullish thesis: non-commercials (speculative funds) remain net short, while commercials (physical operators) are increasing their long positions, indicating expectations of higher real demand in the medium term. This is a historically bullish signal, although it may not materialize immediately: commercials often start accumulating well before price movements occur.
Finally, seasonality favors the bulls: historically, from late April through mid-June, Natural Gas tends to perform positively, fueled by storage accumulation ahead of summer and the following winter season.
Strategically, a consolidation phase above 2.90–3.00 USD could serve as a base for larger moves towards 3.90 and eventually 4.90 USD, with the bullish scenario invalidated only below the 2.80 USD area.
Priceaction
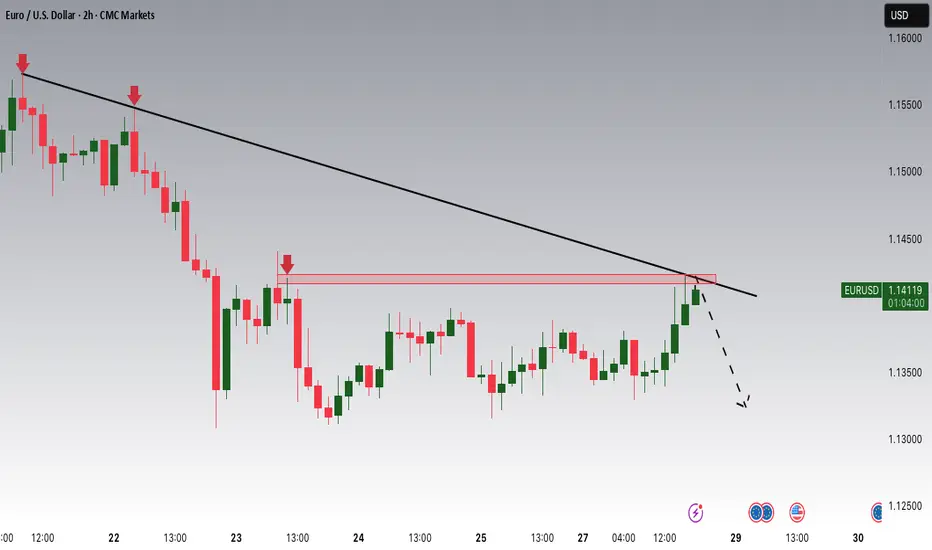
EURUSD is Switching to a Bearish Trend!Hey Traders, in today's trading session we are monitoring EURUSD for a selling opportunity around 1.14200 zone, EURUSD is trading in a downtrend and currently is in a correction phase in which it is approaching the trend at 1.14200 support and resistance area.
Trade safe, Joe.
EUR/USD racing towards new highs? The market sends clear signalsThe EUR/USD pair is confirming a very strong bullish structure. On the weekly chart, the price is positioned above a key supply zone between 1.1350 and 1.1450, after strongly breaking through previous resistances.
The current consolidation at the top of the range suggests a potential continuation to the upside, with a first target at 1.1500 and an extended target at 1.1600.
Retail market sentiment shows a clear majority of short positions on EUR/USD.
This supports a contrarian bullish view, as historically, retail tends to be positioned against the prevailing trend.
COT report data further strengthens this outlook.
The US Dollar Index (USD Index) shows an increase in short positions among institutional traders, indicating a possible phase of dollar weakness.
Conversely, the Euro FX shows a significant increase in long positions from both non-commercial and commercial traders, highlighting institutional interest in buying the euro.
From a seasonal perspective, May tends to be neutral or slightly negative for the euro, while June historically favors moderate dollar strength.
This suggests that EUR/USD could still have room to rise over the coming weeks, but it will be important to monitor for signs of bullish exhaustion towards the end of May.
In summary, the current context favors further upside on EUR/USD as long as the price remains above the 1.1300 support.
However, it will be crucial to watch for the first signs of weakness as we approach June.

TSLA: Low Is In , Rally IncomingTSLA is showing signs of strong accumulation, with buyers consistently stepping in and volume expanding on up-moves. Price structure is improving, breakouts further confirm strength, increasing the likelihood that bears have been left behind. Based on the price action and volume alone, TSLA looks ready for a potential sustained move higher.

"BTC Just Triggered ChoCh! Are You Ready For The Next Big Play?"⚡ BTCUSD Analysis - 15M Timeframe | April 28, 2025
📈 What's Happening:
BTC hunted liquidity above the previous highs (notice those $$$ grabs 🔥).
A sharp sell-off followed = Clear ChoCh (Change of Character) printed.
Price is now marching back into the Fair Value Gap sitting right inside the Premium Zone.
🚨 Critical Levels Highlighted:
Strong High = Ultimate invalidation for bears if price closes above.
Fair Value Gap (FVG) = First supply area.
Order Block (OB) = Deeper, higher probability short zone.
🧠 Key Observations:
Smart Money grabbed liquidity to trap breakout buyers.
Now price retraces into the imbalance = prime sniper setup.
🎯 2-SCENARIO PLAN:
Plan A — Short Setup (Main Bias):
✅ Wait for rejection signs inside FVG or OB.
✅ Trigger short entries only after bearish structure forms (M5 or M1 timeframe).
✅ TP1 = Previous minor low. TP2 = Weak Low (~92,800 zone).
✅ SL = Above Strong High (~95,400).
Plan B — Breaker Play (Alternative):
✅ If price smashes through OB + Strong High with strength, flip bias.
✅ Look for bullish Breaker structure (retest + continuation).
✅ Target fresh liquidity zones above.
📊 Risk Management Tip:
"React to confirmation, not prediction. Let price prove itself before you jump."
🧘♂️ Summary:
✅ Liquidity swept
✅ ChoCh confirmed
✅ Premium Zone retest incoming
✅ High Risk-Reward opportunity forming
🔥 This is where patience = profits.
➡️ Mark this setup, and let's trade like Smart Money, not like retailers.
➡️ Comment "PATIENT SNIPER" if you’re waiting for the perfect trigger!

Two Bullish Scenarios to Watch on ETHUSDTThis week, BINANCE:ETHUSDT has shown a significant upward movement, and there's a good chance it could continue its bullish momentum.
There are two bullish scenarios developing on BINANCE:ETHUSDT :
1. After a pullback, we could see an impulsive move that breaks the previous high (marked with the red arrow) and pushes the price towards the first target at 1,911 – 1,957.
2. The price could move sideways for a while, forming a bullish pennant pattern. In this case, a correction towards 1,756 – 1,731 might occur before the price resumes its move to the first target at 1,911 – 1,957.
Both scenarios remain valid as long as the price holds above 1,722.
If the second scenario plays out, the pullback to 1,756 – 1,731 can be considered a good buy zone (for those who are not in position yet).
Remember: wait for a confirmation candle before entering and place your stop-loss just below the confirmation candle.

28.04.25 Morning ForecastPairs on Watch -
FX:EURNZD
FX:GBPCHF
FX:USDCHF
FX:EURUSD
A short overview of the instruments I am looking at for today, multi-timeframe analysis down to what I will be looking at for an entry. Enjoy!

#202517 - priceactiontds - weekly update - wti crude oil futuresGood Evening and I hope you are well.
comment: Market went nowhere past week so nothing changed from my last weeks update. Bulls want to retest the upper bear trend line around 69 and bears reversing below the 50% retracement of the bear trend that started in January. I do not have an opinion on where the breakout will happen, I can see it going both ways.
current market cycle: trading range on the monthly chart - daily chart is a bear trend that could be transitioning into a trading range again
key levels: 55 - 69
bull case: Bulls see it as a failed acceleration down and want to retest the prior bear trend line around 68. Same target as last week but this week they closed the weekly bar above 64 which was my line in the sand. If they continue here, they will likely squeeze much higher again. 69 next target. Nothing changed in this.
Invalidation is below 60.
bear case: Bears have going for them that they stopped the bounce at the breakout area and under the 50% retracement, which is very important for them. If they get a daily close below 60, we could go lower again but until then it’s a clear trading range 60-52. Market is neutral for me, despite not going above the 50% retracement.
Invalidation is a daily close above 65.
short term: Neutral 60-65, bullish above for 69 and bearish below for 55.
medium-long term - Update from 2025-04-27: This does look like another bear trap below 60, which was to be expected.
Nothing happened the past week so no better update on this. Will tariffs likely or are they already dampening consumption? Most likely. Will this be reflected in Oil demand in the near term? No fucking clue. Chart is in a bear trend but at such a huge support for so many years, I doubt we go much lower but we could range here for longer.

#202517 - priceactiontds - weekly update - nasdaqGood Evening and I hope you are well.
comment: tl;dr covered it.
Markets denied me fantasy, tough excrement. On the weekly chart it’s still just a textbook two-legged pullback to the moving average (daily 20 in this case, which is around 20000). We are also still close enough to the 50% retracement that it’s not out of the question that we reverse from here. Issue for the bears is, that the market went very strong into the weekend, which is a buy signal going into next week. Unless the bears get big help from newsbombs, it’s likely to expect more upside. Targets above are 20000 and then 20500. Below 19200 the next target would be 19000.
current market cycle: bear trend but above 19388 it ends and we will be in a giant trading range
key levels: 15500 - 19500
bull case: 20000 is the obvious target for bulls and for now my thesis is that we wont break above 20600. 20050/20540 would be my next targets above it. The weekly 20ema is right around those prices and that is where the panic selling again. Bulls see the move last week as strong enough that we are likely in a greater trading range which could even get up to 22000 again. Is it likely though? If you are a bull and bought 18000, your stop is likely 19200 now or maybe 19000. Do you hope to make 20500? I don’t know how you can structure a decent trade around that. More likely is the play that we are in a strong uptrend on the 1h tf and if the bull trend line, which is currently at 19100 - holds, we can continue. Once we are making meaningful lower lows again and fail to make new highs, this momentum is gone and bulls run for the exits again. Short squeezes are violent and can go on for much longer than anyone expects but once they stall too much, they crumble again.
Invalidation is below 18000.
bear case: Tough to be a bear. Momentum is clearly on the long side and bulls have almost no resistance. Bears can still argue this was just a test of the 50% retracement and if we build enough selling pressure, I think it’s more likely that the squeeze abruptly ends than continuation up. When all become max bullish again because the move is so strong that it must be the start of a new trend, that’s when these squeezes end and we crash down again. We did this so many times in 2022 that it’s hard to not remember them. You don’t have to go back to 2008 to find examples.
Invalidation is above 20500ish, max 20536 but above 20080 we likely go for 20600 or higher.
short term: Neutral at best. Way too early to short anything or look for shorts. Need to stop the higher highs and go sideways first. It’s best to not sell the first sign of bear strength, ever. Same for bounces in a bear trend. Never buy the first. You can get lucky but it’s just that.
medium-long term - Update from 2024-04-26: My most bearish target for 2025 was 17500ish, given in my year-end special. We had the clear W1 and W3 but now it’s messy. Bear trend most likely over. We could maybe get another strong move down but it’s more likely that even then, we are in a trading range and until we see much more hints of a deeper recession, we can not assume that this will go much lower than 16452. Market is currently probing where the high of it is and for now I doubt we will see 21000 again but that’s a very rough guess.

#202517 - priceactiontds - weekly update - daxGood Evening and I hope you are well.
comment: This is a short squeeze and very little could concinve me otherwise. Does it matter? No. We are going higher and until bears print a big bear bar again, bulls remain in full control. 8 Consecutive daily bull bars is always something special. Above 22700 there is no reason not to go for 24000.
current market cycle: Trading range - bull trend on the 1h tf
key levels: 21500 - 24000
bull case: Big breakout on Wednesday with follow-through. Bulls want to go above the start of the panic selling down at 22735ish. If they do, I doubt there will be much resistance until we print a new ath and even then the first pullback will likely be bought again. The volume is atrocious compared to the selling weeks but that is unimportant. Market is going higher, low volume or not. Stops are not dependent on volume. Below 21900 most bulls will likely think the squeeze is over and secure profits.
Invalidation is below 21900.
bear case: Bears last hope is that prior support turned resistance and we stay below 22700. How likely is that? Given that we have not seen a red daily close for 2 weeks, very very unlikely. What would change my mind? Daily big bear bar closing on it’s low below 21900. Nothing else. We have a clear bull trend line and until that is clearly broken, bulls remain in full control. I do think this is a gift to late bulls who did not sell yet. If I had long term longs, I’d thank the lord for a second opportunity to exit them. We will see lower lows below 19000 this year. Zero doubt.
22700
short term: Neutral. Bullish above 22700 for 24000 and bearish only below 21900 on very strong momentum. Bears have turned this bearish again only with a break of the bull trend line and gap close to 21400.
medium-long term from 2024-03-16: Bear trend is over. We could still print a lower high below 23000 and go down to 19000 or lower but that would rather be a very shallow broad bear channel. Yes, it can be shallow due to marginally lower highs and lower lows but broad because the range is huge. Can we go much below 19000 this year? Only with a deep recession. We could already be in one but for now it’s unlikely. US tariffs will duck excrements up but it will take more time to manifest.

#202517 - priceactiontds - weekly update - bitcoin
Good Evening and I hope you are well.
comment: Very bullish breakout on Tuesday, now bears last hope before 100000 is if maybe prior support has turned resistance. I marked the area with the red box. How likely is it? Very unlikely. Much more likely is a measured move up which could lead to 101000ish.
current market cycle: weekly chart says continuation of the bull trend but i highly doubt it. much more likely we are in a big trading range 73000 - 110000
key levels: 85k - 100k (if bears somehow manage to get below 85k again, we test 80k next)
bull case: Big breakout above 90000 and now 100000 is the obvious next target. The lowest measured move up I can see is 101000 but I want to see market reaction around 100000 first before I look for higher targets. Bulls are in full control of this but any pullback should stay above 88000.
Invalidation is below 88000.
bear case: Bears gave up on Tuesday and I think more will wait for 100000 and see if bulls take profits there before initiating new shorts. Until bears can get a daily close below 88000 again, they don’t have much.
Invalidation is above 101k.
short term: Neutral but bullish above 96k on good momentum for 100k. No shorts until bears show strength again.
medium-long term - Update from 2025-04-13: Bear targets for this year are met. Now we likely range before we get new impulse to either side. I wait for market reaction around 100000 before I write more here. For now my assumption is still that this will be a trading range 73000 - 100000 for longer than a retest or even new highs.

#XAUUSD 1H ANALYSISXAUUSD 1H Supply & Demand Analysis
In this analysis we're focusing on 1H time frame, for finding upcoming movement and changes in Gold prices. Price action shows a clear bearish structure following a strong upside move that was met with resistance near the 3370–3380 supply zone. After two Breaks of Structure (BOS), price is retracing toward a premium level where supply is expected to be reactivated.
Marked areas:
🔴 Supply Zone: 3370–3380 (potential short-entry zone)
🔵 Demand Zone: 3260–3290 (reversal or TP zone)
Target 1: 3315
Target 2: 3305
Target 3: 3292
This setup suggests an ideal Sell from Supply once price reacts and confirms bearish intent with internal structure shifts. Patience is key wait for price to tap the zone and show signs of weakness before entering. Confirmation is very important.
Always use stoploss for your trade.
Always use proper money management and proper risk to reward ratio.
This is just my analysis not financial advice.
#GOLD 1H Technical Analysis Expected Move.

Setup: Long on SOL/USDT🚀 Setup: Long on SOL/USDT Perpetual (15m timeframe)
📈 Context:
Strong divergence between Perp CVD (down) and Spot CVD (up).
_Top Traders accumulating long positions.
_Open Interest stable to slightly rising.
_More than 90% of positions are short — strong imbalance favoring a squeeze.
🎯 Trade Plan:
_Entry: around 148.20 USDT
_Stop-Loss: 145.70 USDT
_TP1: 150.38 USDT (partial profit)
_TP2: 152.30 USDT (full close)
🧠 Notes:
Plan to secure partial profits at TP1.
Will monitor for continuation if breakout occurs.

EURUSD - Bullish Shift after IFVG? This chart outlines a clean sequence of bullish intent where institutional accumulation is visible through structure, inefficiency, and reactive zones.
---
1. Support Zone Holds — Demand Confirmed
The previous resistance area has now clearly flipped into support , marked by multiple wicks rejecting lower prices.
- This region is a high-probability demand zone engineered through earlier consolidation.
- Price returned to this level, swept minor liquidity, and immediately bounced—confirmation that demand is active.
---
2. Fair Value Gap (FVG) — The Imbalance Magnet
A clean FVG sits above price, created during the prior bearish leg. Now acting as a rebalancing zone.
- Price is pushing into this inefficiency after finding support.
- The gap inversion (price reclaiming and holding above the FVG) would validate bullish continuation.
- Think of this as the mid-point between structure and expansion.
---
3. BSL Above — The Next Liquidity Target
A key Buy Side Liquidity (BSL) level is marked higher, acting as the next logical draw for price.
- Smart money seeks liquidity above recent swing highs.
- If price holds above the FVG, this BSL becomes the magnet for bullish expansion .
---
4. Projected Price Action Flow
The roadmap is clear and logical:
- Step 1: Bounce from support (done)
- Step 2: Push through and hold the FVG
- Step 3: Expand higher toward BSL
Each leg has purpose, and the structure confirms smart money is in accumulation mode.
---
5. Summary:
- Support + FVG + BSL = Structured Bullish Thesis
- As long as price stays above the FVG post-inversion, buyers have control.
- This is a textbook case of price engineering via inefficiency and reactive structure.

JUP/USDT Analysis — Long SetupOpen Interest is rising along with the price = new positions being added throughout the move → everything looks clean so far.
But what makes it really interesting is that top traders have been fully short since the beginning.
A 2.2 ratio = they kept positioning against the trend the whole time.
Meanwhile, the move is spot-driven → Spot CVD is rising, showing real buying pressure.
On the other hand, Futures CVD is diverging, meaning aggressive shorting while spot keeps pushing higher.
Sellers are fueling the move and getting absorbed = bullish.
On the Kingfisher side, the optical multi level at 0.4811 has already been tapped → the shorts have been flushed, clearly visible.
🎯 Conclusion:
Everything is aligned for a clean long scalp.

April 25, 2025 – GBPJPY Short📉 Bias: Bearish | Risk: 0.5% | 🎯 Target: 1:3
🧠 Reasoning:
Reaction from Daily Imbalance + Daily EMA 📊. Buyers showing weakness, sellers taking control ⚔️.
After completing the extended wick, price left a clean imbalance – that’s where Im planning to enter 🎯.
⚠️ Note:
We could spike higher into the Weekly EMA, but setup still looks solid. SL: 20 pips 🛡️

GBPJPY Potential longsFX:GBPJPY
After a week of bearish movement, the price has finally broke and closed above last week's high. This pair may give opportunity for some short-term bullish momentum towards the upside. On yesterday's PMI news, price broke above the fib zone and came back retesting, before continuing its second expansion upwards. Price has previously broke above the 4H swap zone but quickly came back to the 1H support zone at 188.24 and retested twice without breaching the support zone. This gives us extra confluence for entering longs.
For swing trading, we can take buys from the second half of the swap zone to the end of the 0.79 fib zone. The reason why we could also enter buys off the 4H swap zone is because price has already retested once on the fib zone, and the swap zone remains as a very strong support. As for intraday and scalping, I’d prefer to wait for short timeframe confirmations and enter with a smaller stop loss for more precise entry. We can target the buys towards 4H resistance zone at 191.180.
Trade safely 😃

25.04.25 Morning ForecastPairs on Watch -
FX:EURNZD
FX:USDCHF
FX:EURUSD
A short overview of the instruments I am looking at for today, multi-timeframe analysis down to what I will be looking at for an entry. Enjoy!

Analysis of Nasdaq 100 (US100) based on Price ActionThis analysis examines the recent price action of the Nasdaq 100 (US100) and identifies potential scenarios based on key technical levels.
Current Situation:
The price has recently moved above a short-term downtrend line, which could indicate a shift in momentum. This development suggests a possibility of upward movement.
Potential Bullish Scenario:
A decisive break and sustained close above the recent resistance level of 19,224 may open the door for further gains. In such a scenario, the index might target the 20,329 level. A successful move beyond that could potentially lead to a test of the historical peak at 22,245.
Potential Bearish Scenario:
Conversely, if the index fails to overcome the 19,224 resistance, there is a chance it could retest previous support levels. These levels are identified at 17,592 and, subsequently, at 16,322.
Conclusion:
The US100 is currently at a critical juncture. The ability of the price to sustain a move above 19,224 may determine its short-to-medium-term trajectory. Both bullish and bearish scenarios remain possible, and traders should monitor price action closely around these key levels.

2025-04-24 - priceactiontds - daily update - dax
Good Evening and I hope you are well.
comment: Bulls in full control, next target is the Globex to 22535 or 22586 on the daily chart. Volume is atrocious and we are in a global trade war but hey, let’s go for another ath I guess. This will crash down to 19000 and lower again, zero doubt in my mind.
current market cycle: trading range
key levels: 21000 - 23000
bull case: Bulls want 22535 or 22586 next. Above that there is no reason not to go for 24000. Nothing more to say about this tbh. Measured move from the lows to spike high is 24375 and yes, I think it’s beyond insane and yes I also think we could get there over next days.
Invalidation is below 21700.
bear case: Bears need prices below 21780. Simple as that. They are not doing anything right now but any decently bad news could get us there. If they print 21780, it only means something if they then close the Global gap to 21674. So far away and unlikely that we get a strong bear trend tomorrow. Market will probably need to range first before we could maybe sell again.
Invalidation is above 22600.
short term: Neutral. Having a hard time believing we can do another bull trend up tomorrow. I expect sideways into the weekend. Anything below 21800 is a bear surprise to me
medium-long term from 2024-03-16: Bear trend is ongoing but for now I still think 19500 and below is an amazing buy if you can hold for years. Things will have to turn really bad for this market to find acceptance below the bull trend line from the covid lows and right now this trade war is just front running. Markets were not priced for risk 3 weeks ago but this drop was too much too fast. My bearish targets for this year are met and with the current environment I will not call for lower prices than 19000. If the trade war turns real bad, yeah sure but for now it’s not.
current swing trade: None
trade of the day: Buying the bear trap 21900, betting on a higher low and that the big globex gap stays open. I traded it horribly and went long way too late but it was still enough to went green on the day.

CME Gap Between 91,050 and 91,659 – Market Might Revisit🧠 A CME gap has formed between 91,050 and 91,659 🕳️
Price could retrace to fill this zone after the recent bounce 🔁
This area is often revisited — watch out for a possible reaction ⚠️

Gold Today's Technical Outlook - BullishAfter two days of selling pressure, we may start to see renewed buying interest in gold today. On the 1-hour and 2-hour charts, a Head & Shoulders pattern had formed and was broken to the downside, with a successful retest confirming the breakdown. However, despite this bearish setup, gold managed to hold above the key support zone of 3305–3306, indicating that buyers are still active and defending this level.
This price action suggests that the downside momentum is weakening and a potential bullish move could unfold today.
Buy Side Scenario: If the support at 3305–3306 continues to hold, we could see upward movement toward the following target levels:
Target 1: 3380
Target 2: 3400
Target 3: 3435
Traders should monitor price action closely for confirmation before entering positions.

JK CEMENT | Strong Volume Breakout | Short-Term Upside in Play📈 Short-Term Trade Plan:
Buy Zone: ₹5,240–₹5,255 (on retest of breakout zone)
Target 1: ₹5,310
Target 2: ₹5,360
Stoploss: ₹5,195 (below the breakout candle wick)
🔍 Technical Insights:
Strong volume surge on breakout above ₹5,220–₹5,230 resistance zone.
RSI comfortably above 60, suggesting sustained strength.
Box breakout pattern typically suggests upward continuation with momentum.
for educational purposes only
