GBP/JPY: Total Confluence Targeting 202.05 BreakoutThis is a high-conviction trade setup based on a powerful confluence of fundamental drivers and multi-timeframe technical alignment. We are anticipating a bullish breakout in GBP/JPY, catalyzed by the upcoming UK GDP data release. The price action has formed a classic "coiled spring" pattern, indicating a significant buildup of energy before a potential move higher.
The analysis is based on pure price action, structure, and macroeconomics. The chart is kept intentionally clean to highlight the strength of the setup itself.
The Fundamental Why 📰
Two core data-driven factors underpin this trade:
1️⃣ Macro Policy Divergence: The primary long-term driver is the stark monetary policy difference between a relatively hawkish Bank of England (BoE), which is still fighting inflation, and an ultra-dovish Bank of Japan (BoJ). This fundamental imbalance creates a natural tailwind for GBP/JPY.
2️⃣ Positive Leading Indicators: Recent economic data from the UK has shown surprising strength. Both the Services and Manufacturing PMIs for June beat expectations, suggesting underlying resilience in the economy. This points to a higher probability of an upside surprise in Friday's GDP figures, which would be the direct catalyst for a breakout.
The Technical Picture 📊
Our confidence comes from a rare "Total Confluence," where every timeframe tells the same bullish story.
The Monthly Chart (Strategic View): Shows a powerful, multi-year uptrend that has decisively broken the critical 8-year resistance from the 2015 highs. The macro trend is undeniably bullish.
The Weekly Chart (The Confirmation): Confirms the uptrend is resuming now after breaking out of a year-long bullish continuation pattern. The "resting" phase appears to be over.
The 4-Hour Chart (The Setup): This is the "coiled spring." Price is consolidating in a very tight range right underneath the key breakout level of 199.45. This shows a lack of sellers and a buildup of buying pressure.
Fibonacci Confluence: Our take profit target is not random. It aligns perfectly with the 1.272 Trend-Based Fibonacci Extension, giving us objective, mathematical confirmation for the target at 202.05.
The Trade Plan ✅
This is a "set and forget" breakout strategy. The order should be placed as a Buy Stop to capture the momentum as it breaks higher.
📉 Asset: GBP/JPY
👉 Entry (Buy Stop): 199.85
⛔️ Stop Loss: 198.75
🎯 Take Profit: 202.05
🧠 Risk/Reward: 1:2
This analysis is for educational purposes. Always conduct your own research and manage your risk appropriately. Good luck.
Priceaction

XAUUSD NY SESSION FLOW – JULY 8→ 9 , 2025"Structure doesn’t lie. Price answered exactly where we expected it to."
Hey traders 👋
Let’s set the record straight after today’s precision bounce. We saw textbook price action across all sessions — Asia triggered the short from our 3344–3351 HTF supply, and both London and New York followed through with no hesitation, driving price down to 3287.
But here’s the key point:
🧨 3287 was just 10 pips above our clean 3286–3280 buy zone.
No mitigation. Just a front-run.
That’s what real liquidity does — grabs what it needs before the crowd gets in. Our zone is still valid… just untouched.
🔍 HTF BIAS & STRUCTURE UPDATE
📆 Daily Bias:
Structure is still bearish — lower highs, CHoCH, and soft RSI.
EMAs 5/21 are flat. No power for bulls unless 3351 breaks.
⏰ H4 Bias:
New lower high confirmed after rejection from our 3344–3351 zone.
Trend is still bearish unless we reclaim 3330+ with conviction.
Liquidity is driving movement, not news.
🕐 H1 Flow:
Bounce from 3287 = engineered reaction before real demand
Price now hovering above 3306, forming mid-structure
No trade in the middle. Let’s work the edges.
🎯 TODAY’S SNIPER ZONES
🔻 SELL ZONES
1. 3325–3330
Nearest short trap. OB + inefficiency + H1 rejection base.
If price returns, watch M15/M30 for CHoCH or BOS → entry.
2. 3344–3351
Our major HTF supply. Asia already reacted from top half.
If revisited, this zone remains the high-probability rejection zone.
3. 3380–3394
Premium OB + imbalance pocket.
Untouched zone far above — if tapped late in the week, watch for liquidity sweep → clean reversal potential.
🟢 BUY ZONES
1. 3297–3300
NY session bounce zone. Price tapped 3297 → pushed to 3306.
Still live for intraday reentry if price retests and confirms with BOS.
2. 3286–3280
Our true demand base. Price front-ran it by 10 pips — didn’t mitigate.
Still valid, still reactive. Don’t delete this zone.
3. 3263–3255
Last line of support. Deep zone — only comes into play if 3280 fails with conviction.
✅ EXECUTION REMINDERS
Price is hovering mid-range → don’t force entries
Only act if structure reacts at the edges (3325 or 3286)
3380–3394 may be a late-week trap if bulls get overconfident
📌 If this breakdown helped, hit 🚀 and drop a comment:
👉 Are you stalking 3325… or waiting for 3286 to finally wake up?
Let structure talk. You just execute.
GoldFxMinds 💭🔥
📢 Disclosure:
This analysis is based on the Trade Nation TradingView feed. I’m part of their Influencer Program and receive a monthly fee.
⚠️ Educational content only — not financial advice.

Bitcoin bullish Bias Consolidated: Robust Supports, Eyeing 11194__________________________________________________________________________________
Technical Overview – Summary Points
__________________________________________________________________________________
Momentum : Strong bullish consensus across all timeframes, confirmed by the Risk On / Risk Off Indicator (STRONG BUY).
Key Supports : 107761 (240min Pivot), 105054.7 (D Pivot Low, swing invalidation zone), 102019.9 (240min Pivot), 74485 (W Pivot Low, macro invalidation).
Key Resistances : 109676.5 – 110630.1 (240min & 1D cluster), 111949 (W Pivot High).
Volume : Normal to very high, no selling climax detected.
Multi-TF Behaviours : No behavioral excess indicated by ISPD DIV, healthy market structure.
__________________________________________________________________________________
Strategic Summary
__________________________________________________________________________________
Overall Bias : Confirmed bullish. Any pullback towards 107761/105054.7 = buy-the-dip opportunity.
Risk Zones : Below 105054.7 = multi-TF invalidation, risk of bearish acceleration to 102019.9.
Macro Catalysts : Focus on FOMC (29–30/07). Until then, controlled volatility, bullish bias sustained.
Action Plan : Buy on support, partial profit near 110630–111949 cluster. Reduce exposure/partial exit before FOMC.
__________________________________________________________________________________
Multi-Timeframe Analysis
__________________________________________________________________________________
Daily (1D) : Steady bullish momentum, resistances at 110630–111949 being watched.
12H – 6H – 4H – 2H : Bias remains strong, intermediate supports defended (107761). No behavioral or breakout alerts.
1H – 30min : Continued bullish dominance, increased volatility and volume but no distribution signs.
15min : Local technical correction, no key pivot broken. Overall trend still absorbed by buyers.
Risk On / Risk Off Indicator : Strong Buy signal (slight neutral on 15min).
Summary : Bullish confirmation across all timeframes. Only a break below 107761 would weaken the setup.
__________________________________________________________________________________
Strategic Synthesis – Recommended Actions
__________________________________________________________________________________
• Remain net long while 105054.7 holds.
• Buy zone: retest at 107761/105054.7.
• Take profits gradually below 110630/111949; manage risk if key support breaks.
• Only major macro shocks or break of 105054.7 invalidate current plan.
• Solid on-chain positioning, no major capitulation risk detected.
__________________________________________________________________________________
Macro Calendar Watchlist
• 08/07/2025: RBA & RBNZ rate decisions (limited BTC impact)
• 29–30/07: FOMC (US Fed, key BTC/risk catalyst)
• Anticipate rising volatility ahead of FOMC. Monitor volume, possible institutional profit-taking.
__________________________________________________________________________________
On-Chain & Institutional Flow Analysis
Majority of investors in profit, holding dominates, new ATH for long-term holders.
Robust ETF/institutional flows.
No liquidity stress or stablecoin squeeze seen.
__________________________________________________________________________________
Conclusion
Market structure remains bullish and sound. Setup: buy on pullback, take profit under resistance, monitor macro events (esp. FOMC). Plan only invalidated by break below 105054.7 or negative macro catalyst.
__________________________________________________________________________________

XLM ,1DAs BTC is Falling And BTC is given Breakout of Pattern in 4Hr , then Remaining coins will also fall drastically .
in 1D pattern of XLMUSDT , it is Breaking Down as BTC is also given Break Down of Pattern
Follow for More Ideas like This

Link, 1DAs BTC is Falling And BTC is given Breakout of Pattern in 4Hr , then Remaining coins will also fall drastically .
in 1D pattern of ADA USDT , it is Breaking Down as BTC is also given Break Down of Pattern
Follow for More Ideas like This

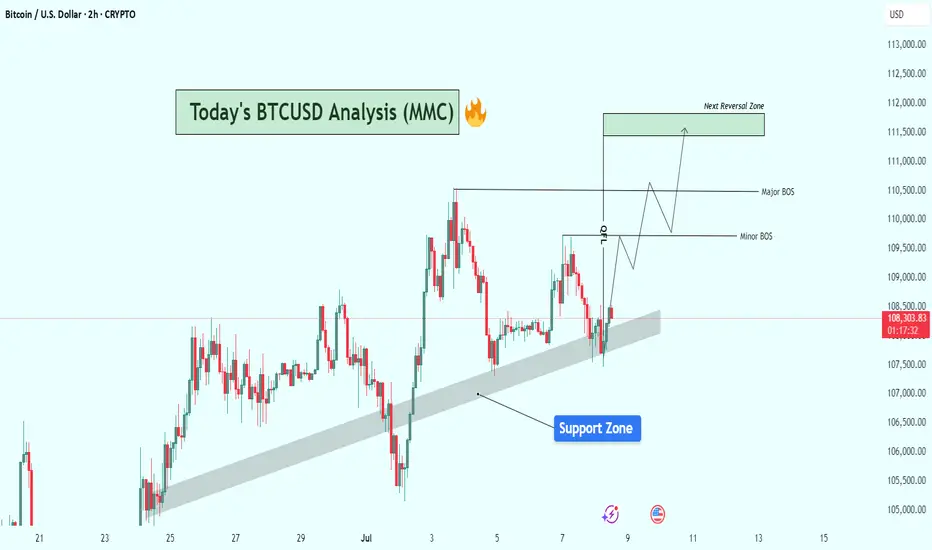
BTCUSD Structure Analysis : Bullish Zone From Support + Target🔍 Current Market Structure Overview:
Bitcoin is currently trading around $108,375, hovering just above a clearly respected rising support zone (shaded area). This dynamic support has held price multiple times and continues to act as a springboard for short-term bullish moves.
The chart illustrates a classic bullish continuation setup forming, with key structural levels marked as Minor BOS (Break of Structure) and Major BOS, indicating potential areas of trend validation and momentum acceleration.
🔹 Key Technical Elements:
✅ Support Zone:
The shaded diagonal support zone has acted as a bullish trendline base, holding up since late June.
BTC recently dipped into this area, found buyers, and is now attempting a reversal from this level.
This reinforces market interest and confirms the accumulation behavior in this zone.
⚠️ Break of Structure (BOS) Levels:
Minor BOS is marked near $109,800, signaling the first key intraday resistance.
A break above this level would signal bullish intent and open the way for price expansion.
Major BOS around $110,600–$110,800 is critical. A clean break here will likely validate a trend continuation toward the next objective.
🟩 Next Reversal Zone (Target Area):
Highlighted around $111,500–$112,000, this green zone represents a potential liquidity grab/reversal area where sellers could re-enter.
This zone aligns with previous price exhaustion levels and may trigger consolidation or a short-term pullback.
📈 Projected Price Path (Wave Schematic):
The chart outlines a wave structure projection, suggesting:
A possible retest of the minor BOS.
Follow-through into the major BOS area.
Final push into the reversal zone before potential rejection or sideways action.
🔧 Bias & Strategy:
Bias: Moderately Bullish as long as BTC respects the support zone.
Invalidation: A decisive breakdown below the trendline support and close under $107,500 would invalidate this bullish setup and shift bias to neutral/bearish short-term.
Trading Plan Ideas:
📥 Buy Opportunity: On minor dips within the support zone, targeting BOS levels.
📤 Sell Watch: Near reversal zone ($111.5K–$112K) if signs of exhaustion or bearish divergence appear.
📌 Final Notes:
BTC appears to be gearing up for a breakout from consolidation, and price action is coiling with higher lows. Market participants should watch closely how BTC reacts at the minor and major BOS zones, as they could define the next leg for either bullish continuation or rejection.
Gold (XAU/USD) Structure Analysis : Trendline Break + TargetGold is trading around $3,338, positioned at a decisive point where both bullish momentum and bearish pressure are converging. The price action over the past few weeks suggests a brewing breakout, supported by multiple technical factors. This analysis provides a complete breakdown of what’s happening and what to anticipate next based on the current structure.
🔹 Market Structure & Context
Since mid-May, XAU/USD has been trading within a rising price channel, respecting a well-defined ascending trendline support. This rising support zone has provided a floor for buyers to step in, especially during pullbacks, which demonstrates consistent buying interest and underlying bullish sentiment.
At the same time, gold has also been respecting a descending trendline resistance formed by multiple lower highs. This forms a squeeze pattern, suggesting that the market is building energy for a breakout. As price compresses within this wedge-like structure, the tension between bulls and bears grows, setting the stage for a sharp directional move.
This is a classic accumulation vs. compression scenario, where the outcome of the breakout will dictate short-to-medium-term direction.
🔹 Channel Support Zone – Buyer’s Stronghold
The channel support zone is critical here. This area, visible as a bold upward sloping line, has provided reliable support through repeated market cycles. It acts as a dynamic line where institutions and swing traders accumulate long positions during dips. The fact that price has respected this trendline for over a month signals the importance of this structure in current market psychology.
Any break below this zone would invalidate the bullish bias and open the door for a steeper decline. However, as long as price stays above this line, the buyers retain control.
🔹 Trendline Resistance – Key Barrier to Break
The descending trendline resistance, drawn from mid-June highs, has been a significant cap on upward moves. Each test of this trendline has resulted in a rejection, pushing price back into the range. Now, gold is testing this level again — and this time, the setup is stronger for a potential breakout due to growing momentum and multiple rejections weakening the resistance.
From a technical standpoint, the more a resistance level is tested, the weaker it becomes, and the higher the probability of a breakout.
🔹 Break of Structure (BOS) Zones – Momentum Confirmation
The chart marks both Minor BOS and Major BOS zones. These are crucial areas to watch for price confirmation.
The Minor BOS, just above the current price (around $3,360), represents a short-term structural shift. A clean break above this with strong candles and volume could trigger a momentum rally.
The Major BOS, located in the $3,400–$3,420 area, is more significant. This is the last major swing high. If gold manages to break and hold above this zone, it would confirm a complete bullish reversal in market structure — turning what was once a lower-high pattern into a potential new uptrend.
These BOS levels act as validation checkpoints for trend direction. Without a clean break, the move is unconfirmed and prone to reversal.
🔹 Next Reversal Zone – Anticipated Reaction Area
Above the BOS zones lies the Next Reversal Zone, marked in green. This is a potential area of resistance or profit-taking, based on historical price reactions, Fibonacci confluence, and psychological levels. This area spans approximately $3,420 to $3,440, which is where price might pause, consolidate, or reverse depending on momentum.
This zone doesn’t necessarily mean price will reverse immediately, but it’s a smart area for traders to monitor reactions or start managing their risk.
🔹 Price Action Flow – What Could Happen Next?
Currently, gold is testing both the trendline and the minor BOS, building momentum around this critical zone. There are two primary paths forward:
If gold breaks the descending trendline and confirms above the minor BOS:
Expect a move toward the major BOS at $3,400.
A successful break of this zone opens the path to the next reversal zone ($3,420–$3,440).
Bulls gain clear control and the market may attempt a sustained breakout continuation.
If gold gets rejected again at the trendline:
Price could drop back toward the channel support, between $3,280 and $3,250.
This would maintain the current consolidation range, with further testing likely before a breakout.
Bears may gain temporary control, but only a break below the ascending channel would signal a trend shift to the downside.
🔹 Why This Setup Matters
This chart captures a textbook breakout setup — compression at a trendline, rising channel support, and BOS zones layered in. These kinds of technical setups often precede strong moves because:
Volume typically increases after breakout zones are breached.
Market participants are watching the same structure, making reactions more predictable.
Risk-to-reward becomes favorable with tight invalidation points.
For disciplined traders, this is a high-probability environment to wait for confirmation and trade the reaction, not the anticipation.
🔹 Risk Management Reminder
It’s essential not to chase breakouts prematurely. Look for:
Strong bullish candles breaking key resistance.
Retests of broken trendlines turning into support.
Volume confirmation (spikes can signal genuine breakout vs. fakeout).
Also, be prepared for false breakouts, especially during overlapping macroeconomic events or low liquidity sessions.
🧭 Final Thoughts
This is a powerful confluence zone for gold, and whichever side breaks it will likely control the next leg. Whether you're a day trader or a swing trader, this is a must-watch area on your chart.
Stay alert, trade with confirmation, and respect your risk parameters.

NZDJPY - bulls are exhausted! Hello TradingView Family / Fellow Traders. This is Richard, also known as theSignalyst.
📈NZDJPY has been overall bullish trading within the rising flat channel marked in blue and it is currently retesting the upper bound of it.
Moreover, the green zone is a strong structure.
🏹 Thus, the highlighted red circle is a strong area to look for sell setups as it is the intersection of the upper blue trendline and green structure.
📚 As per my trading style:
As #NZDJPY is hovering around the red circle zone, I will be looking for bearish reversal setups (like a double top pattern, trendline break , and so on...)
📚 Always follow your trading plan regarding entry, risk management, and trade management.
Good luck!
All Strategies Are Good; If Managed Properly!
~Rich
Disclosure: I am part of Trade Nation's Influencer program and receive a monthly fee for using their TradingView charts in my analysis.

GU-Tue-08/07/25 TDA-GU stagnant ahead of tomorrow's FOMC minutesAnalysis done directly on the chart
Follow for more, possible live trades update!
I often share my live trades in Tradingview public chat in London session, stay tuned!
Green flags, Red flags when you follow someone in trading:
Red flags:
-Always and only share winning trades
-No track records
-A lot of marketing campaign, offering paid courses and more but
with no proof of real trading skills
(I'm not against paid course etc... Just to keep in mind)
-Just sharing buy or sell but without explaining the confluences,
the setups, the reasons, the lot size, how risk manage the trade...
-Simply don't even know where to put sl and tp in advance
Green flags:
-Do live streaming in real time
-Keeping transparent about trade setups, ideas,
about wins and losses
-Share live track record of an account
These are just some signs (could be more green and red flag signs),
and should not be used as effective methods.
If you have more of green flags or red flags ideas, comment down below!
Premise:
A simple idea plan (like Tradingview public posts) won't describe everything.
No one can predict how market will move, it's always good to react to how it moves.
It gives an idea of how price might move, but no one come from FUTURE.
So I always encourage people to openly and actively discuss in real time.
For example discussing on Tradingview public chat (and more).
I don't give signals blindly, people should learn
and understand the skill.
Following blindly signals you won't know how to
manage the trade, where precisely put sl and tp,
lot size and replicate the move over time.
That's why you need active real time discussions.
Trading is not get rich quick scheme!
Active in London session!
Not financial advice, DYOR.
Market Flow Strategy
Mister Y

GJ-Tue-08/07/25 TDA-Trump's new tariff 25% on Japan, YEN weakAnalysis done directly on the chart
Follow for more, possible live trades update!
I often share my live trades in Tradingview public chat in London session, stay tuned!
Trump's new tariff 25% on Japan and South Korea has Yen weakening
further more significantly. Historically JXY is at minimum levels, where
BoJ can possibly intervene and buy back YEN and strengthening it.
Possibly causing massive dump on GJ like 100-200-300 pips move
within minutes. Always be careful and stay up to date to recent global
events and more.
Premise:
A simple idea plan (like Tradingview public posts) won't describe everything.
No one can predict how market will move, it's always good to react to how it moves.
It gives an idea of how price might move, but no one come from FUTURE.
So I always encourage people to openly and actively discuss in real time.
For example discussing on Tradingview public chat (and more).
I don't give signals blindly, people should learn
and understand the skill.
Following blindly signals you won't know how to
manage the trade, where precisely put sl and tp,
lot size and replicate the move over time.
That's why you need active real time discussions.
Trading is not get rich quick scheme!
Active in London session!
Not financial advice, DYOR.
Market Flow Strategy
Mister Y

First obvious major clue may be stronger than the second.I think this shows a clear direction in price action. Strong moves addition to bullish trend line and internal structure. Now at the moment, I am looking at the trend line as a major attraction point in the current moment. Some opinions may say that it's more correct to sell down lower from the trend line, and that might be correct. Although, at this moment, price has yet to have a proper pullback after a clean breakout below. It might honestly just be too obvious that it'd go down lower after retesting trend line, so in my opinion, I think the most clear entry right now is to buy now at a low point, might as well be called a liquidity pool. So right now in this strong trend change, the next obvious major potential for move is going to be back at trend line. The next obvious move will be even more obvious, so then it might also be lacking stability, but until then, my focus here is to buy within a potential deep pullback.
Gold (XAUUSD) – July 8 Analysis | Decision Day at H4 Supply Zone
Gold is currently trading inside a key H4 supply zone (3342–3345) , and today’s session could act as a pivotal turning point for the ongoing structure.
We are now in a region where the H4 may either complete its pullback and resume the uptrend — or allow price to drop deeper toward 3280 before any bullish continuation.
Market Structure Overview
• H4 Trend: Still in a pullback
• M15 Trend: Gave a Change of Character (ChoCh) in the previous session
• Break of Structure (BoS): Not yet confirmed on M15
This puts us in a state of unconfirmed reversal . Without a clean BoS, this could still be a liquidity grab .
Key Levels & Current Setup
📍 H4 Supply Zone: 3342–3345
→ This is where price is currently reacting
→ Sellers may step in here if the broader pullback continues
📍 M15 Structure Status:
→ ChoCh already occurred
→ Price is in a retracement phase
→ BoS is needed to confirm a shift and signal the end of H4 pullback
What Today’s Session Will Decide
🔸 If M15 breaks structure upward (BoS):
→ H4 pullback may be complete
→ Bias turns bullish
→ We’ll plan long setups from M15 POIs with M1 confirmation
🔸 If M15 fails to break and reverses:
→ This could be a liquidity grab
→ Sellers may push price lower
→ Next downside target: 3280 H4 order block , still valid
⚠️ Reminder: Be Prepared for Both Scenarios
• No M15 BoS = No bias
• Wait for structure, not emotion
• Do not force long trades without confirmation
• 3280 remains a high-probability target if rejection confirms
Final Thoughts
This is a structure-led market — we don’t predict, we prepare.
Today’s price action may bring directional clarity.
Structure over speculation.
Let price show intent.
Then act with process, not impulse.
📘 Shared by @ChartIsMirror

Following Price Flow to the Next TargetPrice swept liquidity below the previous day’s low and then powered back up, breaking structure to the upside. Now it’s sitting above the 50 EMA, moving through fair value gaps left by the rally. I’m watching for a possible pullback into the FVG zone near the EMA. If that level holds, price could look to reach for the liquidity above around 3,365.
But here’s what matters most. Even if this ends up being a losing trade, I’d rather take that loss knowing I stuck to my plan than catch a random win by breaking my rules. Because long-term, winning trades that come from impulse actually set you up for future damage. They teach bad habits.
Losses that happen inside your system? Those are simply the cost of doing business. They protect your discipline and keep your edge intact. Over time, that’s exactly what allows you to stay in the game and grow your account.

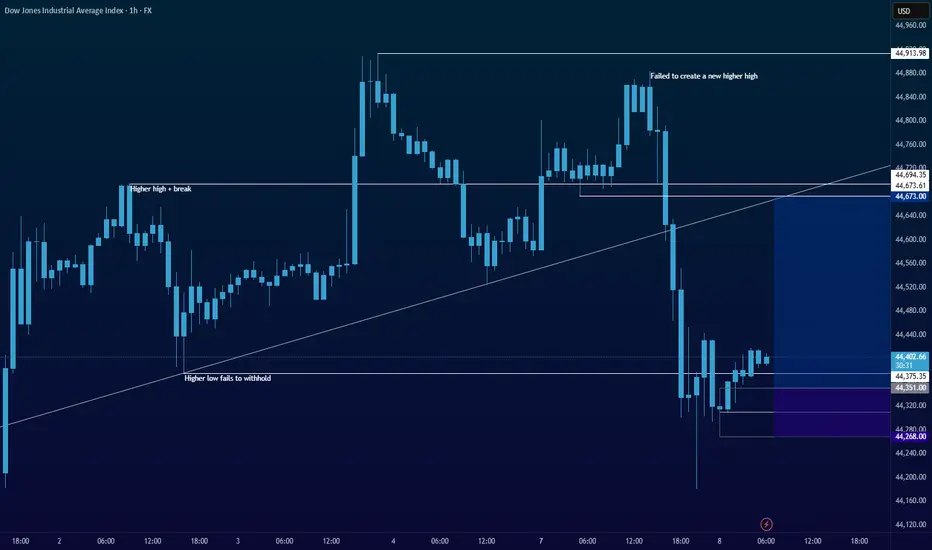
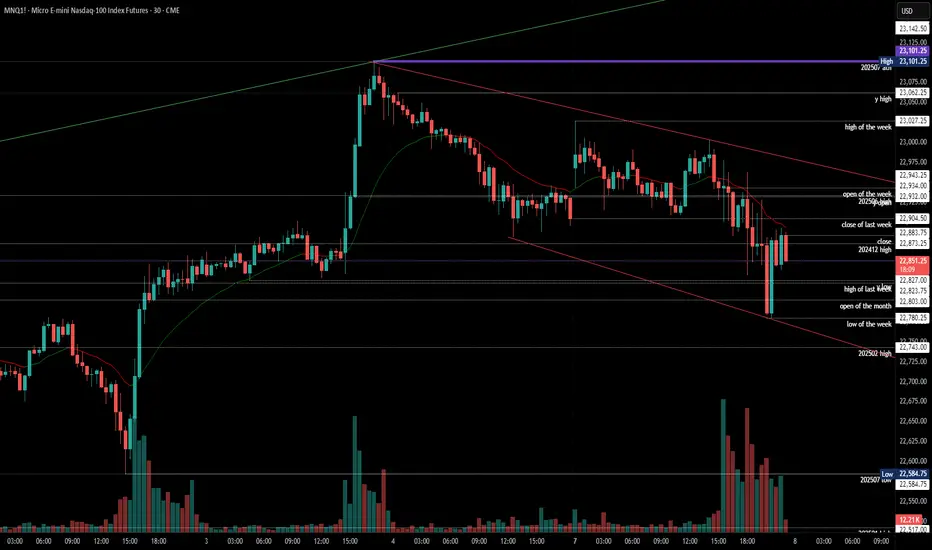
2025-07-07 - priceactiontds - daily update - nasdaqGood Evening and I hope you are well.
comment: Market is ignoring every risk under the sun because the US government is too incompetent to follow-through with their excrement show. Beyond me that we are staying up high. Got no better comment for you today.
current market cycle: bull trend
key levels: 22500 - 23100
bull case: As long as bulls stay comfortably above 22500, they are fine and sideways is a very bullish correction for them. Bears are certainly not doing much, so bulls buy every dip and the chances of a new ath are there since we are very close to it.
Invalidation is below 22500.
bear case: Bears are just not doing enough. Markets have every reason to sell hard but they don’t. Unless we see big 1h bear bars closing on their low with follow-through selling, we can not expect lower prices. We need gaps but all bears get are huge reversal bars. Below 22500 things would look better for them but for now it’s very unlikely. It’s certainly a start that we closed a 4h bar below the 4h 20ema and below last week’s close but unless we make lower lows, it does not mean much.
Invalidation is above 23100.
short term: Neutral.
medium-long term - Update from 2024-06-29: No change in plans. I expect 20000 to get hit over the next 3 months and maybe 19000 again.
trade of the day: Scalping both sides since we had many alternating bars and prominent tails.
AUD/USD Short: Riding the Perfect Storm to 0.6400Hello, traders! 🚀
A rare and powerful setup is forming on AUD/USD, and all signs are pointing decisively lower. 👇 This isn't just a simple technical pattern; it's a perfect storm of fundamental, technical, and event-driven factors aligning to create a high-conviction short opportunity.
If you're looking for a clean setup with a clear catalyst, this is it. Let's break it down! 🧐
The Core Thesis: Why We're Bearish 🌪️
This trade is built on three powerful pillars that are converging at the same time:
Massive Policy Divergence: 🇺🇸 vs 🇦🇺 This is the engine of the trade.
The Fed (USD): Remains HAWKISH 🦅. They are laser-focused on fighting stubborn inflation and have signaled they are in no rush to cut rates.
The RBA (AUD): Is actively DOVISH 🐨. They've already cut rates and are widely expected to cut again this week to support a weakening economy.
Result: This widening gap in interest rate policy creates a fundamental tailwind that heavily favors a stronger USD and a weaker AUD. 💸
The Dual-Catalyst Event (July 9th): 🗓️ This is the trigger.
FOMC Minutes Release: The minutes from the Fed's last meeting are expected to confirm their hawkish stance, reinforcing USD strength.
Tariff Deadline: A 90-day suspension of Trump-era tariffs expires on the same day . The base case is that tariffs will be reimposed, sparking a risk-off move in the markets.
Result: Risk-off sentiment is toxic for the risk-sensitive Aussie dollar (AUD) and a magnet for the safe-haven US dollar (USD). This is a potential double-whammy for AUD/USD. 💥
The Technical Picture is Screaming "Down" 📉
The chart tells a crystal-clear story of rejection and weakness. As you can see on the 4H chart, the price action is incredibly bearish after failing to break out higher.
The Great Wall of Resistance: Bulls threw everything they had at the 0.6590 - 0.6600 resistance zone and were decisively rejected. 🧱 This wasn't just any level; it was an 8-month high and a major long-term resistance area. A failure this strong is a huge red flag for buyers. 🛑
Momentum has Flipped: We saw classic bearish divergence on the higher timeframes, and as you can see on this 4H chart, we have now decisively broken below the recent rising channel. The path of least resistance has flipped from up to down. 👇
The Trade Plan 🎯
Here are the precise levels for executing this trade idea.
Asset: AUD/USD
Direction: Short (Sell) 📉
Entry Zone: ➡️ Look for a patient entry on a pullback to the 0.6535 - 0.6550 area. This was previous support and is now expected to act as strong resistance. We want to sell into strength.
Stop Loss: 🛑 A daily close above 0.6610 . This level is safely above the recent highs. A break here would invalidate our bearish thesis.
Target 1 (TP1): ✅ 0.6475 . This is the first logical support level. A good area to take partial profits and move your stop loss to break-even.
Target 2 (TP2): 🏆 0.6400 . This is our primary target, representing the bottom of the multi-week trading range and offering an excellent risk-to-reward ratio.
Conclusion: 💡
It's rare for fundamentals, technicals, and a major event catalyst to align so perfectly. The rejection at major resistance, combined with the powerful fundamental driver of policy divergence and the upcoming dual-catalyst on July 9th, makes this a high-conviction setup.
This is my analysis and not financial advice. Always do your own research and manage your risk carefully.
What do you think? Are you bearish on the Aussie too? Let me know your thoughts in the comments below! 👇
And if you found this analysis helpful, please give it a BOOST 🚀 and FOLLOW for more trade ideas! 👍

$1 to $7 in minutes +488% vertical $MBIO$1 to $7 in minutes 🚀🤑
Week barely started, already sitting on +30% realized profit from 3 sniper trades NASDAQ:MBIO 2x and NYSE:WOLF

Gold (XAUUSD) – July 7 | Watching 3326 POI for Short Setup🟡 Gold (XAUUSD) – July 7 Bias | Short Setup Developing at 3326 POI
The Gold market remains in a pullback phase on the H4 timeframe , and price may still revisit the 3280 H4 order block before resuming its broader uptrend.
On the M15 timeframe, structure has now shifted clearly.
After an initial Change of Character (ChoCh) , we’ve seen a confirmed Break of Structure (BoS) , placing M15 officially in a downtrend .
✅ Why This Matters:
With both ChoCh and BoS complete, we no longer treat this move as a potential liquidity grab — it now reflects a valid structural reversal in the short term.
But instead of reacting impulsively, we study this shift as a live example of structure-based price action — and how entry zones form after confirmation.
🔍 M15 Order Block in Focus:
• 3323.500 – 3327.800 → Valid M15 POI for short setups
→ This is where we expect price might retrace before resuming its move
→ We’ll observe this zone for M1 confirmation (ChoCh + micro BoS) before taking any action
🎯 Target Zone:
• 3280 – H4 Demand
→ A clean structure-based target aligned with higher timeframe pullback
→ Our model requires minimum 1:3 RR , anchored to price structure
🔁 Key Takeaways:
• H4: Pullback phase remains intact
• M15: Downtrend confirmed (ChoCh + BoS complete)
• Execution plan: Observe 3326 POI; respond only if structure confirms again on M1
• No anticipation. No prediction. Just process.
📖 This is structure-based learning in real time.
We don’t chase setups — we observe shifts.
Let structure teach you. Let price confirm it.
The chart is the mirror.
📘 Shared by @ChartIsMirror

EURAUD - Bearish... but not for long!Hello TradingView Family / Fellow Traders. This is Richard, also known as theSignalyst.
As per our last EURAUD analysis, attached on the chart, it rejected the upper bound of the blue channel and traded lower.
What's next?
📈EURAUD is now retesting the lower bound of the channel.
Moreover, the blue zone is a strong demand.
🏹 Thus, the highlighted blue circle is a strong area to look for buy setups as it is the intersection of the lower blue trendline and demand.
📚 As per my trading style:
As #EURAUD is around the blue circle zone, I will be looking for bullish reversal setups (like a double bottom pattern, trendline break , and so on...)
📚 Always follow your trading plan regarding entry, risk management, and trade management.
Good luck!
All Strategies Are Good; If Managed Properly!
~Rich
Disclosure: I am part of Trade Nation's Influencer program and receive a monthly fee for using their TradingView charts in my analysis.

NZDUSD - The Bulls Are Exhausted! Hello TradingView Family / Fellow Traders. This is Richard, also known as theSignalyst.
📈NZDUSD has been overall bullish trading within the rising channel marked in blue and it is currently retesting the upper bound of it.
Moreover, the green zone is a strong weekly resistance.
🏹 Thus, the highlighted red circle is a strong area to look for sell setups as it is the intersection of the upper blue trendline and green resistance.
📚 As per my trading style:
As #NZDUSD is hovering around the red circle zone, I will be looking for bearish reversal setups (like a double top pattern, trendline break , and so on...)
📚 Always follow your trading plan regarding entry, risk management, and trade management.
Good luck!
All Strategies Are Good; If Managed Properly!
~Rich
Disclosure: I am part of Trade Nation's Influencer program and receive a monthly fee for using their TradingView charts in my analysis.

A fall is on the horizon — watch out!OANDA:NZDUSD
Channel breakout confirmed, with sellers showing interest.
The price is now ideal for shorts — I’m jumping in.

It wants to fall on its own!OANDA:AUDUSD
The price’s failure to break out of the channel with strong candles, along with a double top, signals that sellers are stepping in.
It’s time to enter — let’s go! 💥

EURUSD - Looking for the RTLooking for the RT on the upper supply zone, long term target for EURUSD is 1.200-1.2200. However, on RT we can potentially expect a larger pull back but will analyse PA.

Bullish Breakout Anticipation on Gold (XAU/USD)Bullish Breakout Anticipation on Gold (XAU/USD)
On the 30-minute chart, Gold is forming a classic falling wedge pattern, typically seen as a bullish reversal setup. We've just touched the lower support trendline, and early breakout signs are emerging.
📍 Entry: 3,309.500
🎯 Target: 3,335.500
🛑 Stop Loss: 3,299.000
The risk-to-reward ratio looks favorable, and a breakout above the wedge resistance could push price towards the 3,335+ region. Let’s watch for confirmation and volume on breakout.
👇 Drop your thoughts below and let’s discuss!
✅ If you find this analysis helpful, please support by giving a like and following — your support means a lot! 🙌 🟡
