2025-03-27 - priceactiontds - daily update - nasdaqGood Evening and I hope you are well.
comment: Many potential trend lines that market could respect tomorrow. We are in an expanding triangle, a broad bull channel and the big bear trend on the daily chart. No idea what we get tomorrow so I lean neutral around 20000.
current market cycle: strong bear trend but currently in W2 (above 20700 that thesis drops to a 50/50 chance)
key levels: 19600 - 20700
bull case: Bulls surprised me with the huge buying around 20000. Yesterdays selling was good enough to expect lower prices, so stopping at 20000 wasn’t what I hoped for. Bulls turned the market neutral and if they continue with higher highs above 20200, they could get a breakout to 20400 or 20500. My w2 target still remains 20700. Past 50 trading ranges range is 19600 - 20500 and 50% of it is 20060 and we are at 20004. Good enough. Market is in balance.
Invalidation is below 19600.
bear case: Bears printed consecutive bear bars on the 4h chart but they barely make new lows on them. We could see a strong move below 20000 but for now I would need a strong signal and follow-through before I join the bears below 20000. I also think most bears will give up above 20200 and wait for market to get closer to 300 or 400 again. Daily chart shows it the best. We just closed the gap from Monday and market is now free to do whatever.
short term: Neutral 20000. Bears are slightly favored to continue the bigger bear trend but as of now, selling around or below 20000 does not make sense.
medium-long term - Update from 2024-03-16: My most bearish target for 2025 was 17500ish, given in my year-end special. We don’t know if we have printed the W1 of the new bear trend or repeat the pattern from 2024, where we sold of very strong to reverse even more strongly and make new all time highs. Market needs a bounce and around 20000/20500 we will see the real battle for the next weeks.
trade of the day: Tough day if you are not comfortable with trading ranges and it was absolutely not clear that we get a range-bound day. Bull reversal from the US open was likely the best trade since it was very strong without much uncertainty.
Priceaction

GBPCAD - Weekly Forecast,Technical Analysis & Trading IdeasTechnical analysis is on the chart!
No description needed!
OANDA:GBPCAD
__________________________________________________________________
❤️ If you find this helpful and want more FREE forecasts in TradingView,
. . . . . . . . Hit the 'BOOST' button 👍
. . . . . . . . . . . Drop some feedback in the comments below! (e.g., What did you find most useful? How can we improve?)
🙏 Your support is appreciated!
Now, it's your turn!
Be sure to leave a comment; let us know how you see this opportunity and forecast.
Have a successful week,
ForecastCity Support Team

Epileptic | AccumulationSimilar consolidation at this lower swing like the last time. Looking forward to seeing a break above liquidity and for price to return to the swing high once the markets are ready to roll. Sometime from now to July.

Gold (XAU/USD) Double Top Pattern – High Probability Trade Setup📌 Overview of the Chart:
This 4-hour timeframe chart of Gold Spot (XAU/USD) highlights a Double Top pattern, one of the most reliable bearish reversal signals in technical analysis. The price has tested a strong resistance zone twice (Top 1 & Top 2) but failed to break above, suggesting that bullish momentum is weakening and a possible trend reversal is imminent.
This setup provides an excellent opportunity for a short (sell) trade, provided the price confirms the pattern by breaking below the neckline. The potential downside targets are marked as TP1 ($2,983) and TP2 ($2,938), with a stop loss placed above resistance ($3,056) to manage risk effectively.
📌 Key Chart Patterns & Market Dynamics
1️⃣ Double Top Pattern – The Bearish Reversal Signal
The Double Top pattern occurs when:
✅ The price reaches a resistance zone and gets rejected (Top 1).
✅ It then retraces downward to find support at the neckline.
✅ The price makes another attempt to push higher but fails at the same resistance level (Top 2).
✅ A break below the neckline confirms the bearish trend, as buyers lose strength and sellers take control.
🛑 Why is this pattern important?
The failure of buyers to push beyond resistance shows that sellers are dominating. This creates a psychological shift in the market, making traders and institutions more likely to sell aggressively once the neckline is broken.
2️⃣ Resistance Level – The Rejection Zone
🔵 Price Level: $3,050 – $3,056
🔵 Role: Key supply area where sellers are strong
🔵 Market Impact: Strong rejections at this level indicate that big players (institutions) are offloading positions, leading to bearish momentum.
Why Does This Matter?
📌 If the price breaks above this level, it would invalidate the bearish setup, leading to potential further upside.
📌 This is also why we place our Stop Loss above this level—to protect against unexpected bullish breakouts.
3️⃣ Neckline Support – The Breakout Zone
🔻 Price Level: Around $3,020
🔻 Role: The last line of defense for buyers before a bearish breakout
🔻 Market Impact: If this level is breached, it confirms the Double Top pattern, leading to a sharp decline.
📌 A confirmed break of the neckline is the ideal point for traders to enter a short (sell) position, targeting lower price levels.
4️⃣ Key Take Profit (TP) Targets – Where Price Might Drop
🎯 TP1 – $2,983:
This level is a minor support zone where price may temporarily pause before further decline.
Conservative traders may choose to secure profits here.
🎯 TP2 – $2,938:
A stronger historical support zone, making it a high-probability target for a full bearish move.
More aggressive traders may hold positions until this level.
📌 Why These Levels?
These targets align with Fibonacci retracement zones and previous market structure, increasing the likelihood of a reaction at these points.
5️⃣ Stop Loss – Managing Risk Like a Pro
Placement: Above the resistance zone at $3,056
Reason: If price breaks above resistance, it invalidates the bearish thesis, meaning we need to exit the trade.
Risk-Reward Ratio:
TP1: ~2:1
TP2: ~3.5:1
A good risk-reward setup, ensuring a profitable edge over multiple trades.
📌 Trading Strategy & Execution Plan
📉 Bearish (Sell) Setup:
1️⃣ Wait for confirmation – Price must break below the neckline ($3,020) before entering a short trade.
2️⃣ Sell Entry: On a confirmed break and retest of the neckline.
3️⃣ Stop Loss: Above the resistance zone ($3,056).
4️⃣ Take Profit Targets:
TP1 ($2,983) – First profit level.
TP2 ($2,938) – Secondary target for deeper decline.
📌 Optional Confirmation:
Look for bearish candlestick formations (e.g., Bearish Engulfing, Shooting Star, or Doji) near resistance or after a neckline breakout.
Monitor RSI/MACD for bearish divergence, confirming weakening momentum.
📌 Market Psychology Behind This Pattern
1️⃣ First Peak (Top 1): Buyers push the price up, but sellers step in at resistance and force a pullback.
2️⃣ Pullback to Neckline: Some buyers re-enter, believing the uptrend will continue.
3️⃣ Second Peak (Top 2): Price attempts another rally but fails at the same resistance, showing buyers' exhaustion.
4️⃣ Break of the Neckline: Sellers take full control, leading to a high-momentum sell-off.
📌 Key Takeaway:
💡 The Double Top is a trader’s favorite because it reflects a real psychological shift in market sentiment—from greed (buyers) to fear (sellers).
📌 Final Verdict – High Probability Trade Setup
✅ Double Top formation confirms a bearish trend reversal.
✅ Strong resistance & multiple rejections signal seller dominance.
✅ Clear risk management strategy (Stop Loss & TP Levels).
✅ Waiting for neckline break ensures a high-probability entry.
🚀 Watch this setup carefully! If the neckline breaks, GOLD could experience a sharp decline! 📉🔥
🔍 Pro Tips for Smart Traders
💡 Don’t rush into a trade! Wait for a solid break and retest of the neckline for confirmation.
💡 Monitor volume: A strong breakout should be accompanied by increasing volume for validation.
💡 Use confluence: Combine with other indicators (RSI, MACD, EMA) to increase accuracy.
🔥 What’s Your Take on This Setup? Will You Trade It? Let Me Know in the Comments! 🚀

LINK/USDT - Bullish Channel Breakout and FVG Re-TestThe LINK/USDT chart showcases a clear uptrend within a bullish channel. Currently, there’s a potential retracement towards the Fair Value Gap (FVG) around the $14.50 zone, offering a possible entry opportunity. If this zone holds, a new bullish impulse could push the price toward the channel's upper boundary around $16.50. Watch for price reactions in the FVG zone to confirm the continuation of the uptrend.

27.03.25 Morning ForecastPairs on Watch -
FX:NZDCAD
OANDA:XAGUSD
FX:NZDUSD
A short overview of the instruments I am looking at for today, multi-timeframe analysis down to what I will be looking at for an entry. Enjoy!

VOE LONGAs you can clearly see the VOESTALPINE AG stock has found support at a key order block, aligning closely with the 50% Fibonacci retracement — a typical entry point for smart money. Since then, price action has stabilized and is starting to push higher. The declining short interest ratio suggests bearish pressure is easing, while the rising volume delta points to increasing demand. This confluence could signal accumulation and a potential continuation to the upside. Watching for further confirmation and a clean break above recent highs.
#SmartMoney #OrderBlock #VolumeDelta #Fibonacci50 #ShortSqueeze #AccumulationPhase #TradingStrategy #TechnicalAnalysis #MarketStructure #BullishSetup #PriceAction #Orderflow #SwingTrading #TradingViewIdeas

2025-03-24 - priceactiontds - daily update - daxGood Evening and I hope you are well.
comment: Strong bears appeared again, volume picked up and we are down 565 points from the high. Big bull trap and these moves tend to get follow-through. Next big support is 22700 and then 22500 and I favor the lower price tomorrow, anything else would surprise me. The big spending bill is priced in and market could not make a new ath after 3 tries now. Downside has much more room than the upside.
current market cycle: Clear trading range now and market is neutral around 23000. Also the bull trend line on the daily chart is broken
key levels: 22500 - 23750
bull case: Bulls tried the early breakout and it looked promising. Bears surprised me as well and the move was violent enough to go for 500 points down. Bulls have nothing until they recover 23200. If bulls were hopeful for much higher prices, we would have seen them by now. The big bull trend line from 20300 is likely broken now and I do think market has turned fully neutral again. Best bulls can now hope for is to stay above 22500 and continue sideways.
Invalidation is below 22400.
bear case: Bears need a strong follow-through day tomorrow or might find themselves inside a bigger expanding triangle where we could go up to 23500+ again. Today’s selling was a big surprise and these moves trap traders and can have good momentum for a couple of sessions. Bears want the obvious lows of this trading range tested and maybe run some stops below 22500. They absolutely need to close below 22800 tomorrow to confirm the bull trend line break.
Invalidation is above 23200.
short term: Bearish. Bears need to stay below 23100 to keep the strong momentum alive. I’d like to look for shorts near the 1h 20ema. Anything above 23100 would make me neutral and above 23200 I would sit on hands and wait.
medium-long term from 2024-03-16: Germany takes on huge amount of new debt. Dax is rallying hard and broke above multi-year bull trends. This buying is as real as it gets, as unlikely as it is. Market is as expensive as it was during the .com bubble but here we are and marking is pointing up. Clear bull channel and until it’s broken, I can not pound my chest and scream for lower prices. Price is truth. Is the selling around 23000 strong enough that we could form a top? Yes. We have wild 1000 point swings in both directions. Look at the weekly chart. Last time we had this volatility was 2024-07 and volume then was still much lower. We are seeing a shift from US equities to European ones and until market closes consecutive daily bars below 22000, we can’t expecting anything but sideways to up movement.
current swing trade: None
trade of the day: Buying the breakout before EU open upwards was reasonable but you had to be quick to change your mind about shorting it since the move down was violent.

ZCash (ZEC)- Weekly Forecast,Technical Analysis & Trading IdeasMidterm forecast:
While the price is above the support 24.41, beginning of uptrend is expected.
We make sure when the resistance at 45.33 breaks.
If the support at 24.41 is broken, the short-term forecast -beginning of uptrend- will be invalid.
COINBASE:ZECUSD
Technical analysis:
A trough is formed in daily chart at 29.20 on 03/21/2025, so more gains to resistance(s) 41.10 and maximum to Major Resistance (45.33) is expected.
Take Profits:
35.60
41.10
45.33
50.14
56.49
67.07
79.42
90.06
100.00
117.07
135.00
170.00
216.50
305.00
370.55
__________________________________________________________________
❤️ If you find this helpful and want more FREE forecasts in TradingView,
. . . . . . . . Hit the 'BOOST' button 👍
. . . . . . . . . . . Drop some feedback in the comments below! (e.g., What did you find most useful? How can we improve?)
🙏 Your support is appreciated!
Now, it's your turn!
Be sure to leave a comment; let us know how you see this opportunity and forecast.
Have a successful week,
ForecastCity Support Team

NAS100 Price ActionHey traders!
Looking at the current market structure, we can see that the price failed to make a new higher high , which is often the first sign of a potential trend reversal. This was followed by a break of two key structure levels, confirming a shift in momentum from bullish to bearish.
Interestingly, a supply zone was formed during this shift, but price didn’t even retest it — instead, it dropped right after its creation, showing strong bearish pressure. There's also an internal candle (IFC) marking the transition point.
With this kind of price action, it’s likely that the market is heading toward the next demand zone below. This could present a solid short opportunity, but always remember to manage your risk wisely and wait for clean confirmations.

Bitcoin (BTC/USD) Rising Wedge BreakdownMarket Structure & Analysis:
Rising Wedge Formation: Price has been moving within a rising wedge pattern, which is typically a bearish reversal pattern.
Bearish Breakdown Expected: BTC is testing the lower boundary of the wedge, indicating a potential breakdown.
Resistance Zone:
$89,649 – Key resistance level preventing further upside.
$88,336 – Local resistance that price failed to sustain above.
Support Levels:
$86,852 - $85,335 – Intermediate support range.
$80,402 – Main target for a bearish move.
$76,725 – Secondary support in case of further decline.
Trading Plan:
Sell Setup:
Wait for confirmation of a breakdown below the wedge.
Enter short if price closes below $86,852 with volume confirmation.
Stop Loss: Above $88,336 to avoid false breakouts.
Take Profit Targets:
TP1: $84,474 (first support level).
TP2: $80,402 (main target).
TP3: $76,725 (extended bearish target).
Risk Factors:
If BTC finds strong support at $86,852, a bounce could invalidate the bearish setup.
Macro events (ETF approvals, institutional buy-ins, Fed rate decisions) may impact price action.

EUR/JPY Triple Bottom Breakout – Bullish SetupThis chart represents the EUR/JPY currency pair on the daily timeframe. It highlights a Triple Bottom pattern, a bullish reversal formation that signals a potential upward trend after testing strong support multiple times.
1. Chart Pattern Analysis – Triple Bottom Formation
The Triple Bottom is a classic reversal pattern that forms after a downtrend and consists of three distinct lows at nearly the same level. This indicates that sellers attempted to push the price lower but failed three times, suggesting that buying pressure is increasing.
Bottom 1 (August 2024): The price reached a low near 150.344, forming the first support zone.
Bottom 2 (September 2024): The price dropped again to the same support level but bounced back, indicating strong demand.
Bottom 3 (March 2025): The price retested the support for the third time and rebounded, confirming the pattern.
💡 Key Takeaway: The repeated failure to break below the support level suggests that sellers are losing control, and buyers are preparing for a strong move up.
2. Support & Resistance Levels
Understanding support and resistance levels is crucial for identifying entry and exit points:
Support Level (150.344 - 150.125): This zone has acted as a strong demand area where price consistently bounced back.
Resistance Level (167.500 - 170.000): This is the neckline of the Triple Bottom pattern. A breakout above this level confirms the bullish trend.
If the price breaks above the resistance level, it will trigger buying momentum and open the doors for further upside.
3. Trading Strategy & Price Targets
✅ Entry Criteria
The ideal buy entry is after the price breaks above the resistance level (~167.500 - 170.000) with strong bullish momentum and increased volume.
Wait for a daily candle close above the resistance level to confirm the breakout.
🎯 Target Levels (Take Profit - TP)
TP1 (173.001) – First profit-taking level, as the price may encounter some resistance.
TP2 (179.266) – Final bullish target if the breakout holds strong.
📉 Stop Loss (Risk Management)
Stop Loss (SL): Below 150.125, just below the previous support level. This minimizes losses if the price fails to break out.
Risk-to-Reward Ratio: This setup offers a high risk-reward ratio, making it a favorable trade.
4. Market Psychology & Confirmation Signals
The Triple Bottom indicates a strong shift in market sentiment from bearish to bullish.
Confirmation signals to watch for:
✅ Bullish breakout above resistance
✅ Increase in trading volume
✅ Formation of bullish candlesticks (e.g., Engulfing, Marubozu, or Breakout Retest Confirmation)
5. Summary & Final Thoughts
🔹 The Triple Bottom pattern signals a strong reversal with clear upside potential.
🔹 The breakout above resistance (~167.500 - 170.000) will confirm a bullish trend.
🔹 Entry: Buy after breakout confirmation with volume support.
🔹 TP1: 173.001, TP2: 179.266
🔹 SL: Below 150.125 to protect capital.
🚀 Conclusion : This setup presents an excellent long opportunity with a well-defined risk-reward strategy. If the breakout holds, EUR/JPY could see a strong uptrend in the coming weeks.

EUR/GBP Chart Analysis – Double Bottom Reversal & Breakout Setup1. Market Structure & Context
The EUR/GBP daily chart presents a well-defined double bottom reversal pattern, indicating a potential trend shift from a prolonged downtrend to an uptrend.
The pair has been in a bearish phase, as reflected by the descending trendline.
However, price action suggests a possible trend reversal, as buyers are stepping in near a key demand zone.
A successful neckline breakout would confirm the bullish reversal, potentially leading to significant upside movement.
2. Key Chart Patterns & Technical Levels
A. Double Bottom Formation (Bullish Reversal Pattern)
The double bottom is a powerful reversal pattern, often signaling the end of a downtrend. It consists of two similar low points, forming a "W" shape.
Bottom 1: The first low was established around 0.8200 - 0.8250, where buyers initially stepped in to push prices higher.
Bottom 2: Price retested this demand zone, but sellers failed to push it lower, confirming a strong support level.
Bullish Significance: The inability of sellers to break below the support zone suggests the exhaustion of selling pressure and increasing buy-side interest.
B. Neckline Resistance & Potential Breakout Zone
The neckline resistance is drawn around 0.8450 - 0.8500, a key level where previous price rallies were rejected.
A breakout above this zone, ideally with strong bullish volume, would validate the double bottom pattern and trigger a bullish breakout trade.
C. Descending Trendline Breakout Attempt
The long-term downtrend resistance (trendline) has been holding since mid-2024.
Price is currently testing this trendline; a clear breakout and retest would add further confidence to the bullish bias.
3. Trade Setup & Execution Plan
A. Entry Strategy
There are two possible entry strategies, depending on risk appetite:
Aggressive Entry: Buy immediately upon a breakout above 0.8500, anticipating a strong rally.
Conservative Entry: Wait for a breakout + retest of the neckline before entering, ensuring confirmation.
B. Stop Loss & Risk Management
Stop Loss (SL): Placed below the recent swing low at 0.82029.
This level acts as the last line of defense for bulls; if price drops below it, the bullish thesis is invalidated.
C. Take Profit (TP) Targets
TP1: 0.86122 (first resistance zone, a previous swing high).
TP2: 0.87284 (higher resistance level, next supply zone).
These levels serve as potential profit-taking areas where sellers may re-enter the market.
4. Additional Technical Confluences Supporting Bullish Bias
✔ Key Support Zone Holding Strong – The price has bounced twice from the demand zone (0.8200 - 0.8250), confirming strong buyer interest.
✔ Volume Confirmation Needed – A breakout with high volume increases the probability of sustained bullish momentum.
✔ RSI & Momentum Indicators – If RSI crosses above 50, it would further confirm bullish momentum, supporting the breakout trade.
✔ Favorable Risk-to-Reward Ratio (RRR) – A well-defined stop loss & take profit strategy ensures an optimal trade setup.
5. Summary & Final Trading Plan
Current Market Bias: Bullish if neckline breaks (Double Bottom Confirmation).
Entry Confirmation: Look for a breakout above 0.8500 with strong volume.
Profit Targets:
TP1: 0.8612
TP2: 0.8728
Stop-Loss Level: Below 0.8202 to protect against fake breakouts.
🚀 Final Tip for Traders:
Monitor price action & volume closely. A breakout without volume may lead to a false move. Confirmation with bullish momentum is essential for a high-probability trade setup.

EUR/USD Triple Bottom Reversal | Bullish Breakout SetupChart Overview
This is a EUR/USD 1-hour chart showing a classic Triple Bottom Reversal Pattern, a strong bullish reversal signal. The price has tested a key support level multiple times, forming three distinct bottoms, indicating that sellers are losing momentum while buyers are stepping in.
This setup suggests an upcoming breakout, with well-defined entry, take profit, and stop-loss levels to capitalize on the potential upward move.
Technical Breakdown
1. Support & Resistance Zones
Support Zone (Highlighted in Beige)
The price has tested this zone multiple times without breaking below, confirming strong buying interest.
Each time the price touched this level, it rebounded, indicating accumulation by buyers.
Resistance Zone (Highlighted in Beige)
The price previously reversed from this level, making it a key area to watch for a breakout.
A confirmed breakout above this resistance could trigger strong upward momentum.
2. Triple Bottom Formation
A Triple Bottom is a strong bullish reversal pattern. It consists of:
Bottom 1: First rejection from support.
Bottom 2: A retest of support with buyers defending the level.
Bottom 3: The final touch before an upward move, confirming the pattern.
This pattern signals that selling pressure is diminishing and buyers are preparing for a strong breakout.
3. Bullish Reversal & Breakout Zone
A breakout above the neckline resistance (around 1.0843) will confirm the pattern.
Traders should wait for a confirmed candle close above the resistance before entering a long position.
A retest of the breakout zone can provide an additional entry opportunity.
Trade Setup & Key Levels
🔹 Entry Strategy
Aggressive Entry: Enter at the breakout level (above 1.0843) with volume confirmation.
Conservative Entry: Wait for a breakout retest before entering long.
🎯 Take Profit Targets
TP1: 1.08868 (First resistance zone)
TP2: 1.09642 (Major resistance zone, strong price reaction expected)
❌ Stop Loss Placement
Stop Loss: Below 1.06786, under the support zone.
This ensures that if the price breaks below the key level, the trade is invalidated.
Market Sentiment & Expected Move
If the price breaks the resistance → Expect a strong bullish move toward TP1 and TP2.
If the price fails to break out → It may consolidate further or retest support.
Watch for increased volume on the breakout to confirm strength.
📌 Final Thoughts
This is a high-probability bullish setup based on a well-formed Triple Bottom Reversal pattern. Traders should monitor price action near the breakout zone and manage risk effectively with proper stop-loss placement.

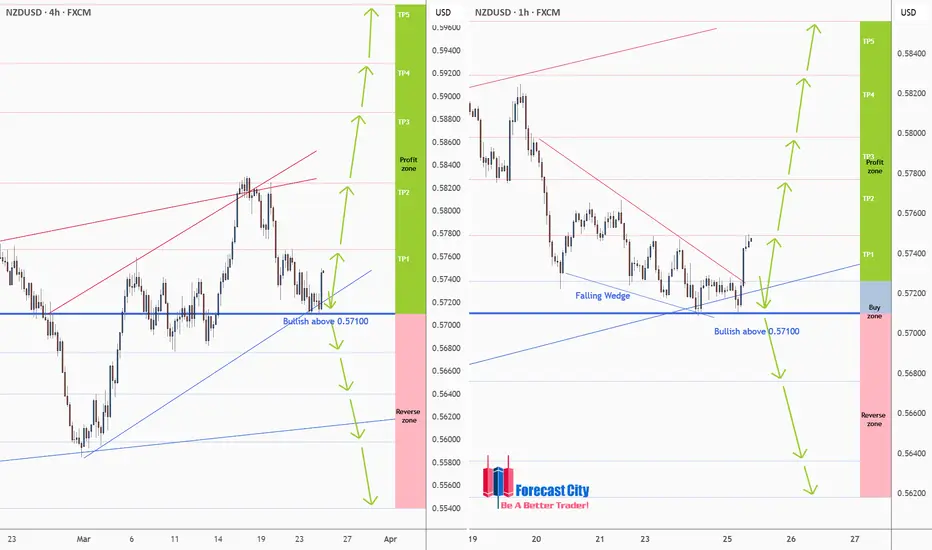
NZDUSD - H4, H1 Forecast - Technical Analysis & Trading IdeasTechnical analysis is on the chart!
No description needed!
OANDA:NZDUSD
__________________________________________________________________
❤️ If you find this helpful and want more FREE forecasts in TradingView,
. . . . . . . . Hit the 'BOOST' button 👍
. . . . . . . . . . . Drop some feedback in the comments below! (e.g., What did you find most useful? How can we improve?)
🙏 Your support is appreciated!
Now, it's your turn!
Be sure to leave a comment; let us know how you see this opportunity and forecast.
Have a successful week,
ForecastCity Support Team
Silver (XAG/USD) – Rising Wedge Breakdown & Retest📌 Overview of the Chart
The chart illustrates a classic Rising Wedge pattern that has broken down, signaling a potential bearish continuation. The price action respected technical structures, including support and resistance levels, trendlines, and key psychological zones.
The breakdown of the rising wedge led to a sharp decline, followed by a retest of the previous support as resistance, confirming further downside momentum. Traders analyzing this setup can identify clear entry points, stop-loss placements, and target objectives based on price action behavior.
🔹 1️⃣ Understanding the Rising Wedge Pattern
A Rising Wedge is a bearish pattern that forms when price moves upward within converging trendlines. It indicates that buying momentum is slowing, and a potential reversal or breakdown is imminent.
✔ Characteristics of the Rising Wedge on This Chart:
📈 Higher Highs and Higher Lows: The price was trending upwards, but the narrowing structure indicated exhaustion.
📊 Decreasing Momentum: Volume likely started declining as the price approached resistance.
📉 Bearish Breakdown: Price broke below the lower trendline, confirming the pattern’s bearish nature.
🔻 What Happened Next?
The price dropped sharply after the wedge breakdown.
A retest of the broken trendline acted as a confirmation of resistance.
The downtrend continued, targeting a lower support level.
🔹 2️⃣ Key Support & Resistance Levels
🔵 Major Resistance – 34.27 USD (All-Time High & Supply Zone)
This level served as a strong supply zone, rejecting multiple bullish attempts.
Price struggled to break this level, leading to a sell-off.
The stop-loss for short trades is placed above this zone to minimize risk.
🟠 Support Level – 32.80 USD (Previous Support Turned Resistance)
This was a key support zone before the wedge breakdown.
Once broken, price retested this level and faced rejection, confirming a trend shift.
⚫ Trendline Support (Now Broken)
The lower support trendline was a crucial guide for bulls.
Once price broke below, it signaled strong bearish control.
A retest of the trendline was unsuccessful, confirming a bearish continuation.
🟢 Target Zone – 31.93 USD (Projected Breakdown Target)
The measured move target of the rising wedge aligns around 31.93 USD.
If selling pressure continues, price may reach this level.
🔹 3️⃣ Trading Strategy – Short Setup & Execution
This setup provides a high-probability short trade based on the pattern breakdown.
📉 Short (Sell) Entry Criteria:
✅ Entry Zone: After the price broke below the wedge and retested the trendline (~33.80 USD).
✅ Confirmation:
Bearish candlestick formations (Doji, Engulfing, or Pin Bars).
Increased volume on bearish moves.
🚫 Stop-Loss Placement:
🔹 Above the resistance level (34.27 USD) – If price breaks above this, the setup is invalid.
🔹 Reasoning: Protects against unexpected bullish reversals.
🎯 Take-Profit Target:
🔻 Target Price: 31.93 USD (based on measured move projection).
🔻 Risk-Reward Ratio: At least 2:1 (adjusted based on volatility).
🔹 4️⃣ Market Psychology & Price Action Analysis
Understanding trader sentiment is crucial:
📌 Before the Breakdown:
Bulls were in control, pushing price higher.
However, momentum slowed down, forming the rising wedge.
Traders who identified this pattern anticipated a potential trend reversal.
📌 After the Breakdown:
Sellers overpowered buyers, causing a rapid break of structure.
The price retested the previous support as resistance, confirming further downside.
The market sentiment shifted to bearish, aligning with technical confirmations.
🔹 5️⃣ Alternative Scenarios & Risk Factors
🔄 Bullish Reversal (Invalidation of Bearish Bias)
🚨 If price reclaims 34.00-34.27 USD, it invalidates the bearish setup.
📌 A break above this level could trigger a new bullish wave, targeting higher highs.
⚠️ Key Risk Factors:
Unexpected macroeconomic events (e.g., Fed policy, inflation data, geopolitical tensions).
Strong bullish rejection at lower support zones (~32.00 USD).
Volume divergence (if selling volume dries up, bears may lose control).
📢 Conclusion: High-Probability Bearish Trade with Clear Risk Management
This rising wedge breakdown provides a strong short setup, with technical confirmations and price structure supporting further downside movement.
📉 Bearish Bias Until 31.93 USD
A breakdown retest suggests sellers remain in control.
Price is expected to continue lower unless bulls regain 34.00+ levels.
🔍 Key Trading Question:
Will Silver (XAG/USD) continue to its measured target of 31.93 USD, or will bulls defend key support and push prices higher?
Let’s discuss! 🚀👇

JPY/USD Technical Analysis – Bullish Breakout from Falling WedgeIntroduction
The JPY/USD chart showcases a classic falling wedge pattern, a strong bullish reversal signal. This pattern is characterized by converging downward-sloping trendlines, indicating a weakening bearish momentum. Eventually, buyers stepped in, leading to a breakout to the upside. This analysis breaks down key elements, including support and resistance zones, trendlines, trading strategy, and risk management.
1. Breakdown of the Chart Pattern
A. The Falling Wedge Formation (Bullish Reversal Pattern)
A falling wedge is a bullish technical pattern that forms when the price consolidates within two downward-sloping trendlines that converge over time. This signals that selling pressure is decreasing and a reversal may be near.
Downtrend Structure: The price was previously in a consistent downtrend, making lower highs and lower lows, which formed the wedge.
Breakout Confirmation: Once the price broke above the upper trendline, the pattern was confirmed, indicating the start of a bullish move.
Retest Possibility: Often, after a breakout, the price retests the upper trendline before continuing higher. If it holds, it strengthens the bullish outlook.
B. Key Levels Identified in the Chart
1. Support Zone (Buying Area)
The price found strong support in the 0.006291 – 0.006500 region.
Buyers stepped in, preventing the price from dropping further.
This support level coincides with the bottom of the wedge, further validating its importance.
2. Resistance Zone (Profit Target)
The 0.007100 – 0.007200 area is a major resistance level where sellers have previously dominated.
If the price reaches this level and consolidates, traders will look for either a breakout or a rejection.
A break above 0.007200 would indicate further bullish continuation.
3. Trendlines & Curve Formation
A curved trendline in the chart suggests a gradual transition from bearish to bullish momentum.
The dotted ascending trendline now acts as dynamic support, helping the price sustain its bullish move.
2. Trading Strategy & Risk Management
A. Entry Strategies
Traders have two primary ways to enter this trade:
Aggressive Entry:
Enter immediately after the breakout of the wedge.
Higher risk but captures early momentum.
Conservative Entry:
Wait for a pullback to the trendline before entering.
Lower risk as it confirms trend continuation.
B. Take Profit Targets
Primary Target: 0.007117 (Resistance level from previous highs).
Extended Target: 0.007200 (Next significant resistance).
C. Stop Loss Placement
Below the recent swing low at 0.006291 to protect against false breakouts.
Ensures a favorable risk-to-reward ratio.
3. Market Sentiment & Confirmation Signals
✅ Bullish Confirmation
Breakout from the falling wedge
Price holding above the trendline
Higher highs and higher lows formation
Increased buying volume
⚠️ Bearish Risks & Invalidations
A break below the trendline would indicate weak momentum.
If the price fails to hold support, it could reverse downward.
Low volume on the breakout could signal a fake breakout.
4. Final Thoughts
This setup provides a high-probability trading opportunity following the breakout from a falling wedge pattern. The risk-to-reward ratio is favorable, making it an ideal setup for trend-following traders. However, patience is key—waiting for a successful retest before entering can minimize risks. If the price maintains momentum, we could see a rally toward the 0.007100 – 0.007200 resistance zone in the coming weeks. 🚀

BTC/USD Rising Wedge – Bearish Breakdown Ahead?Introduction: Understanding the Market Structure
This Bitcoin (BTC/USD) 4-hour chart presents a technical setup with a mix of bullish and bearish formations. The analysis focuses on key support and resistance zones, trendlines, and chart patterns to determine the next possible move.
🔍 The key takeaway? BTC has formed a Rising Wedge, a bearish reversal pattern, signaling potential downside unless a breakout invalidates the setup.
1. Market Structure & Current Trend Analysis
📌 Market in Curve Formation – The Accumulation Phase
Before the recent rally, Bitcoin was in a downtrend, making lower lows and lower highs, suggesting a period of price weakness.
However, price found strong support at around $77,600 - $80,000, forming a curved bottom structure—an early signal of an accumulation phase.
This bottoming pattern transitioned into a bullish uptrend, leading to the formation of a rising wedge.
🔹 Key Observations:
✔ Accumulation near $77,600 created a base for buyers.
✔ The gradual recovery curve suggests a shift from bearish to bullish momentum.
✔ Bitcoin later formed higher lows, confirming a temporary uptrend.
⚠ Shift in Momentum – The Rising Wedge Appears
The price rallied from the support zone but started forming a Rising Wedge pattern, which is typically a bearish signal.
A rising wedge indicates that although buyers are pushing prices up, they are losing momentum.
The narrowing price range suggests that sellers are entering at higher levels, weakening bullish strength.
2. Key Technical Levels to Watch
🔵 Resistance Zone ($92,000 - $94,957)
The shaded area near $92,000 - $94,957 is a major resistance level, where BTC previously failed to sustain a breakout.
This supply zone has been tested multiple times, reinforcing its strength.
The Stop Loss for short positions is placed above $94,957—any breakout above this level would invalidate the bearish setup.
🟠 Support Zone ($77,600 - $80,000)
The strong demand zone between $77,600 - $80,000 aligns with previous support levels.
If the rising wedge breaks down, this is the first major price target where BTC could find support.
A strong breakdown below $77,600 could lead to further declines toward $75,000 or lower.
3. The Rising Wedge Pattern – Bearish Warning!
🔍 What is a Rising Wedge?
A Rising Wedge is a bearish reversal pattern that forms during an uptrend when price moves within two converging trendlines.
It indicates that buyers are losing strength, and sellers are preparing to take control.
Once the lower trendline breaks, it confirms bearish momentum, leading to a price drop.
📝 Current BTC/USD Rising Wedge Analysis:
BTC has formed higher highs and higher lows, but the price range is narrowing.
The lower trendline is critical—a breakdown below this level could trigger a sharp decline.
The bearish target aligns with the support zone near $77,600.
4. Trading Plan – Possible Scenarios
📉 Bearish Breakdown Scenario (High Probability)
✅ Entry: Short BTC if the price breaks below the rising wedge (~$86,000 - $85,500).
✅ Stop Loss: Above $94,957 to protect against invalidation.
✅ Take Profit Target: $77,600 - $80,000 (first support level).
✅ Extended Target: If BTC drops below $77,600, watch for $75,000 - $72,000.
✅ Risk-Reward Ratio: Ideally 1:3 or higher for optimal trade management.
📈 Bullish Breakout Scenario (Low Probability but Possible!)
If BTC breaks and closes above $94,957, the bearish setup becomes invalid.
A confirmed breakout above resistance could push BTC towards $98,000 - $100,000.
Traders should wait for volume confirmation before entering long positions.
5. Risk Management & Final Thoughts
⚠ Risk Factors to Consider:
If BTC breaks the wedge with low volume, the move might be a false breakdown.
Macroeconomic events, such as interest rate decisions, can influence price behavior.
Watch for bullish divergences in indicators like RSI or MACD before shorting aggressively.
🔎 Conclusion:
The Rising Wedge pattern suggests a bearish reversal—a breakdown could send BTC toward $77,600.
Traders should wait for confirmation before entering trades.
If BTC breaks above $94,957, a bullish continuation could push it toward $100,000.
🔥 Bearish Bias Until Breakdown Confirmation!
Would you like an indicator-based analysis (e.g., RSI, MACD, or Moving Averages)? 🚀

Gold (XAU/USD) Technical Analysis – Triangle Breakout & Bullish Overview of the Chart
This chart presents a daily timeframe (1D) analysis of Gold (XAU/USD) and highlights a well-defined bullish trend supported by a breakout from a triangle pattern. The overall price action suggests a strong uptrend continuation, with clearly marked support and resistance levels, trendlines, and potential trade setups.
Gold has been consistently respecting key technical levels, forming higher highs and higher lows, which is a classic indicator of a strong bullish market. Traders can use this analysis to identify entry points, stop-loss levels, and profit targets for a strategic trading approach.
Key Technical Components in the Chart
1. Triangle Pattern Formation – The Setup for Breakout
One of the most crucial formations in this chart is the triangle pattern, which acts as a continuation pattern.
The triangle pattern (highlighted in green) represents a period of consolidation where price action was squeezing between higher lows and lower highs before a breakout occurred.
This pattern suggests that buyers and sellers were in equilibrium, building up momentum before gold made a decisive move to the upside.
The breakout above the upper boundary of the triangle confirms the bullish continuation, leading to a strong rally.
📌 Technical Significance: Triangle patterns are a reliable technical structure used by traders to anticipate breakouts. The breakout direction (upward in this case) determines the next trend phase.
2. Trendline Analysis – Defining Market Structure
The dashed black trendline represents the primary ascending trendline, which has been respected multiple times, indicating that the market remains in an uptrend.
Several minor support levels (highlighted in blue) have acted as strong demand zones, preventing price breakdowns and helping sustain the bullish momentum.
A major support zone (highlighted in beige at $2,300-$2,400) serves as the base of the uptrend, where price action historically reversed strongly, indicating heavy institutional buying.
📌 Technical Significance: As long as the price remains above these support levels, the uptrend remains intact.
3. Breakout & Price Action Structure – Momentum Confirmation
The breakout from the triangle pattern signaled the beginning of a new bullish impulse wave, and the price action structure confirms this move.
Higher Highs & Higher Lows: The black zig-zag pattern represents a strong bullish structure where each retracement finds support before continuing higher.
Price Movement Post-Breakout:
After breaking above the triangle’s resistance, gold started forming higher highs at an accelerated pace.
Minor pullbacks are bouncing off key support levels, providing re-entry opportunities for traders.
📌 Technical Significance: A breakout followed by sustained higher highs and strong buying pressure is a key bullish signal.
Trading Plan & Strategy
1. Entry Strategy – Ideal Buying Zones
Buy on Pullbacks:
Enter near minor support levels to take advantage of retracements.
This improves the risk-to-reward ratio and reduces exposure to sudden reversals.
Confirmation Signals:
Look for bullish candlestick patterns (bullish engulfing, pin bars, hammer candles).
Increased trading volume on bullish moves supports trend continuation.
2. Stop-Loss & Risk Management
📍 Stop-Loss: $2,661
Placed below the most recent minor support level to protect against downside risk.
If price breaks below this level, it may signal a trend shift or deeper correction.
📍 Why this Stop-Loss Level?
It ensures a tight risk control while allowing room for natural price fluctuations.
3. Take-Profit & Target Projection
📍 Target Price: $3,170
The measured move projection from the triangle breakout suggests a target near $3,170, which aligns with historical resistance.
If the price approaches $3,100-$3,170, traders should monitor for potential reversals or further breakouts.
4. Key Factors Supporting the Bullish Bias
✅ Uptrend Structure: The market is making higher highs and higher lows, which is a textbook sign of bullish momentum.
✅ Breakout Confirmation: The price has broken out of the triangle pattern and is sustaining higher levels.
✅ Support Levels Holding: Each pullback is being absorbed by buyers at well-defined support zones.
✅ Momentum & Volume: Increased volume and strong buying pressure indicate that the bullish trend is likely to continue.
5. Risk Management & Market Conditions
Market Sentiment:
If gold continues to hold above the support zones, further upside momentum is likely.
If price starts breaking below key support levels, it may signal a trend reversal or deeper correction.
Geopolitical & Economic Factors:
Gold prices are often affected by inflation data, interest rate changes, and global uncertainties.
Traders should monitor economic news that could impact gold’s trend.
Conclusion – A High-Probability Trade Setup
This analysis confirms that gold (XAU/USD) is in a strong bullish uptrend following a successful triangle breakout.
🚀 Trade Setup Summary:
✅ Entry: Buy on pullbacks at minor support levels
✅ Stop-Loss: $2,661 (Below support)
✅ Target Price: $3,170 (Next resistance level)
✅ Risk-Reward Ratio: Favorable setup with strong trend confirmation
🔹 Final Verdict: As long as gold remains above the minor support levels, the bullish bias remains strong, making this a high-probability long trade setup.
Would you like to add any additional indicators (RSI, MACD) for confirmation? 📈

26.03.25 Morning ForecastPairs on Watch -
OANDA:XAGUSD
FX:EURUSD
FX:NZDUSD
A short overview of the instruments I am looking at for today, multi-timeframe analysis down to what I will be looking at for an entry. Enjoy!

AUDCAD | Reoccurring FractalsWe're looking at 3 complete fractals and the fourth one being the current one. Same phase as the last, a bit of sideways trading/consolidation then aggressive buying breaking out to the upside.
Price action has been trending upwards with HHs and HLs and we're currently at a Lower High bouncing off the lower trendline below.
Would be ideal to look for long positions only for this setup as bulls are looking stronger from this view.
~300pips going into the 3rd wave.

2025-03-25 - priceactiontds - daily update - nasdaq
Good Evening and I hope you are well.
comment: Volume is garbage but we are moving higher. Likely more due to strong bears stepping aside rather then strong bulls buying. 20700 is the 50% and we will likely get there over the next 1-2 days. I do think bears have to prevent the bulls from getting a 4th consecutive daily bull bar or more bulls could join and more bears cover. My thesis is that we are in W2 and forming a bear channel, so I would greatly prefer it if market stays below 20700. 20900 would be the breakout retest and is the next logical target above.
current market cycle: strong bear trend but currently in W2 (above 20700 that thesis drops to a 50/50 chance)
key levels: 19600 - 20700
bull case: Bulls have a bull trend from Globex open yesterday and keeping the market above the 1h 20ema. Right now longs with stop 20360 are reasonable since we are making higher lows. 20700 is the obvious target and then the breakout-retest 20900. As long as bulls keep the lower bull trend line valid, they are good. The upper wedge line is likely to get broken, so I don’t think it’s bigger resistance. Market is doing his best to keep most traders out of this move up, since most of the gains are made in the pre- and after market (obviously not futures).
Invalidation is below 20360.
bear case: Bears don’t have much right now. The bear trend is obviously still alive and market is likely forming a bear channel but since we are going up in a very tight channel, bulls are in control on the lower time frames. Bears need to either print a strong rejection tomorrow before or after we hit 20700. I’d prefer before, then another leg up to the 50% and then another strong rejection down to 20000 but it’s a rough guess. First target for bears is a break below 20300 again and going sideways.
short term: Neutral 20500 and bullish only closer to the 1h 20ema. 20700 is my bull target and there I expect the battle for either continuation of the big bear trend or transition into a big trading range.
medium-long term - Update from 2024-03-16: My most bearish target for 2025 was 17500ish, given in my year-end special. We don’t know if we have printed the W1 of the new bear trend or repeat the pattern from 2024, where we sold of very strong to reverse even more strongly and make new all time highs. Market needs a bounce and around 20000/20500 we will see the real battle for the next weeks.
trade of the day: Buying 20300 early in EU session or any pullback close to the 1h 20ema. Market is so strong since open of the week that moving far below the 1h 20ema was very low probability.

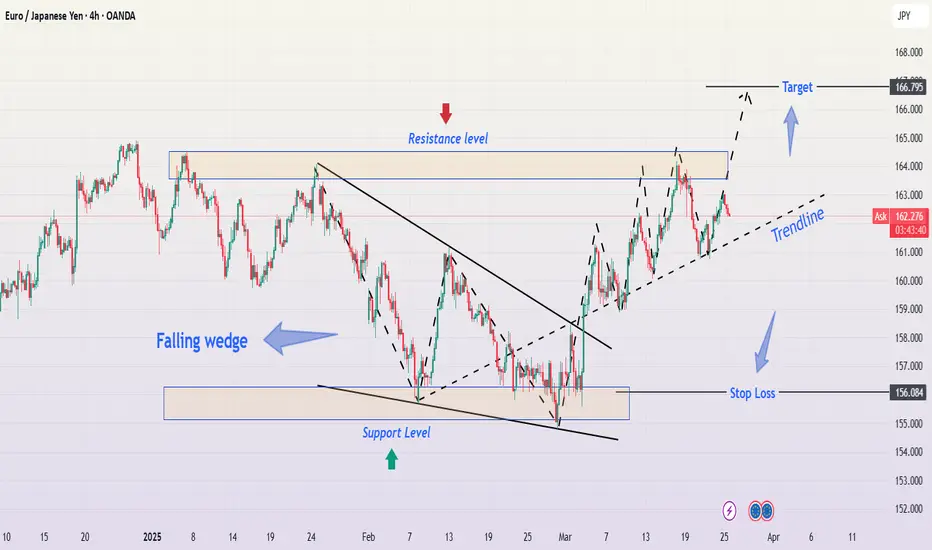
EUR/JPY Breakdown: Falling Wedge Breakout & Bullish SetupThe EUR/JPY 4-hour chart is presenting a well-structured price action setup, featuring a falling wedge breakout, a strong bullish trendline, and key resistance and support levels. This detailed analysis will walk through each aspect of the chart to provide a professional trading perspective.
1. Market Context & Price Action Overview
At the beginning of the chart, EUR/JPY was experiencing a downtrend, characterized by a series of lower highs and lower lows, forming a falling wedge pattern. This pattern is typically a bullish reversal signal, indicating that sellers are losing strength and buyers may take control.
Once the price reached a key support zone near 156.08, it bounced, leading to a breakout of the falling wedge. Since the breakout, the price has been moving in a bullish trend, forming higher highs and higher lows, respecting an ascending trendline.
2. Technical Patterns & Key Levels
🔹 Falling Wedge Pattern – Bullish Breakout
The falling wedge is identified by two converging trendlines sloping downward.
It indicates that bearish momentum is weakening as price compresses.
A breakout above the upper wedge line confirmed the shift in trend direction.
The breakout candle had strong bullish momentum, suggesting increased buyer interest.
🔹 Support and Resistance Levels
📉 Major Support Level (~156.08):
This level acted as a demand zone, where buyers aggressively stepped in.
The price formed multiple rejections at this level before breaking upwards.
A stop-loss placement below this level is ideal for bullish trades.
📈 Resistance Level (~163.50 - 164.00):
This zone has been tested multiple times as price approaches from below.
A break and retest of this resistance would confirm further bullish momentum.
If price faces strong rejection, a short-term pullback to the trendline may occur.
🎯 Final Target (~166.79):
This is the next major resistance level, aligning with previous swing highs.
It serves as a strong take-profit (TP) level for long positions.
If price reaches this level, we may see a consolidation phase or possible reversal.
3. Trend Analysis & Market Structure
📈 Bullish Trendline:
The price has been respecting an ascending trendline, acting as dynamic support.
This trendline connects higher lows, confirming a strong bullish trend.
As long as price stays above this line, buyers remain in control.
📊 Market Structure:
Since breaking out from the falling wedge, the price is forming a classic bullish structure of higher highs and higher lows.
This indicates sustained buyer pressure and a potential continuation toward resistance levels.
4. Trading Setup & Risk Management
📌 Entry Strategy:
Aggressive Entry: After the wedge breakout with a tight stop-loss.
Conservative Entry: Wait for a pullback to the trendline support or a break and retest of resistance at 163.50 - 164.00.
🔻 Stop Loss Placement:
Below 156.08 (previous support zone) to protect against trend invalidation.
Alternatively, below the rising trendline for a dynamic SL approach.
🎯 Take Profit Targets:
TP1: 163.50 - 164.00 resistance zone (Partial profits).
TP2: 166.79 final target, aligning with historical resistance.
5. Market Outlook & Potential Scenarios
✅ Bullish Scenario (High Probability)
If price holds above the trendline and breaks 163.50 - 164.00, we expect a continuation towards 166.79.
The structure remains intact as long as higher highs and higher lows persist.
❌ Bearish Scenario (Low Probability, but Possible)
If price fails at resistance and breaks below the trendline, it could signal a deeper retracement.
A break below 156.08 would completely invalidate the bullish setup, leading to a potential downtrend.
6. Summary & Key Takeaways
Trend Bias: Bullish, supported by a falling wedge breakout and higher highs.
Key Levels: Support at 156.08, resistance at 163.50 - 164.00, final target at 166.79.
Trading Strategy: Buy on retests of trendline or resistance breakouts.
Risk Management: Use dynamic stop-loss levels to minimize downside exposure.
🔹 Final Verdict:
If price remains above support and successfully breaks 163.50 - 164.00, a strong move toward 166.79 is expected. However, traders should remain cautious of trendline breakdowns and manage risk accordingly.
📊 Stay disciplined, follow your trading plan, and always use stop-loss protection! 🚀 #EURJPY #Forex #TradingStrategy #PriceAction