GU-Mon-07/07/25 TDA-Good support zone,but possible sell continueAnalysis done directly on the chart
Follow for more, possible live trades update!
I often share my live trades in Tradingview public chat in London session, stay tuned!
A simple idea plan (like Tradingview public posts) won't describe everything.
No one can predict how market will move, it's always good to react to how it moves.
It gives an idea of how price might move, but no one come from FUTURE.
So I always encourage people to openly and actively discuss in real time.
I don't give signals blindly, people should learn
and understand the skill.
Following blindly signals you won't know how to
manage the trade, lot size and replicate the move
over time.
That's why you need active real time discussions.
Trading is not get rich quick scheme!
Active in London session!
Not financial advice, DYOR.
Market Flow Strategy
Mister Y
Priceaction

GJ-Mon-07/07/25 TDA-Both sides possible, more structure->clarityAnalysis done directly on the chart
Follow for more, possible live trades update!
I often share my live trades in Tradingview public chat in London session, stay tuned!
I often repeat in my analysis, more structure, more clarity,
easier trend identification. I won't and I will never catch
every single move but with more structure and more clarity
you'll likely to increase the probability that a move will
happen in either direction.
I don't give signals blindly, people should learn
and understand the skill.
Following blindly signals you won't know how to
manage the trade, lot size and replicate the move
over time.
That's why you need active real time discussions.
Trading is not get rich quick scheme!
Active in London session!
Not financial advice, DYOR.
Market Flow Strategy
Mister Y

07.07.25 Morning ForecastPairs on Watch -
FX:AUDCAD
FX:USDJPY
FX:EURUSD
A short overview of the instruments I am looking at for today, multi-timeframe analysis down to what I will be looking at for an entry. Enjoy!

AUD/JPY: Rejection at Key ResistanceThis is a high-conviction short setup on AUD/JPY based on a powerful rejection pattern that has formed on the 4-hour chart. As you can see, the price spiked into the critical resistance zone between 95.00 and 95.55 but was immediately and forcefully rejected, leaving behind a long "Exhaustion Spike."
This is a classic sign of buyer exhaustion and seller dominance. It tells us that despite the recent rally, there is significant supply waiting at these higher levels. This price action provides a clear opportunity to short the pair in anticipation of a significant move down.
🏦 Fundamental Analysis
The fundamental backdrop provides a strong tailwind for this trade, with two key drivers:
1️⃣ Central Bank Divergence: The Reserve Bank of Australia (RBA) is in an easing cycle, having recently cut rates to 3.85% with more cuts expected. In stark contrast, the Bank of Japan (BoJ) is on a path of normalization, having already raised its rate to 0.50%. This divergence in monetary policy is structurally bearish for AUD/JPY.
2️⃣ Imminent Catalysts: This week is packed with event risk that is skewed to the downside for this pair. We have the RBA interest rate decision on Tuesday, July 8th , and the U.S. tariff deadline on Wednesday, July 9th . A dovish RBA or a "risk-off" move from the tariff news would likely accelerate the decline in AUD (a risk currency) and strengthen the JPY (a safe-haven currency).
📊 Technical Analysis
The price action on the chart confirms the bearish bias:
1️⃣ 4-Hour Rejection: The "Exhaustion Spike" at the 95.00 - 95.55 supply zone is the primary signal. It shows a clear failure by buyers and a strong takeover by sellers at a key level.
2️⃣ Long-Term Trend: On the daily chart, the price is trading below the critical 200-day moving average , confirming the long-term trend remains bearish.
3️⃣ Waning Momentum: There is a clear bearish divergence on the daily RSI. The price made a higher high, but the momentum indicator made a lower high, signaling that the rally is internally weak and losing steam.
📋 Trading Setup
This is a swing trade designed to capture a significant correction with a simple "set and forget" plan.
📉 Direction: SHORT / SELL
👉 Entry: Sell Limit @ 94.85
⛔️ Stop Loss: 95.60
🎯 Take Profit: 91.10
💡 Rationale: The entry is placed strategically to capitalize on a potential retest of the rejection area. The stop loss is placed safely above the rejection wick and the major resistance zone. The take profit targets the major structural support from the May 2025 lows, offering an excellent risk-to-reward ratio.

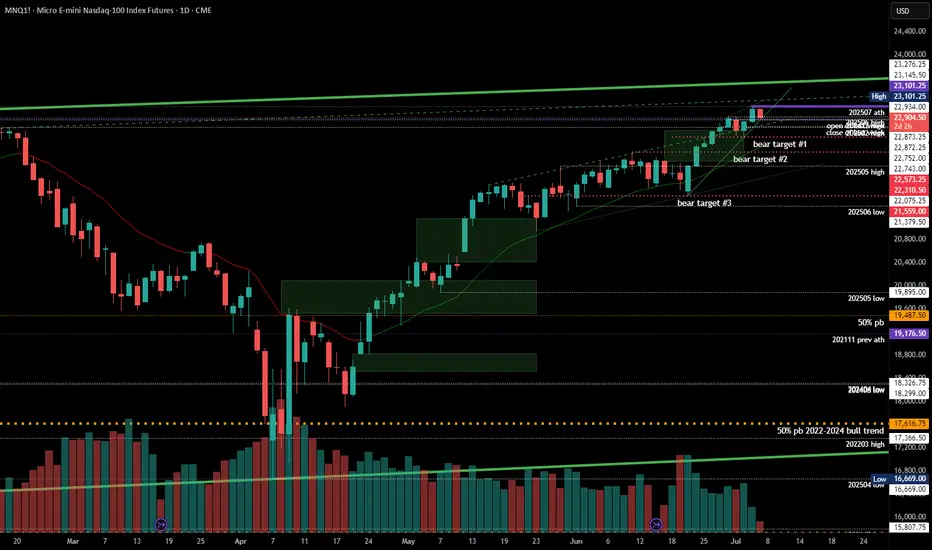
#202527 - priceactiontds - weekly update - nasdaq
Good Day and I hope you are well.
comment: Neutral. Chart is still max bullish but I have no more targets above and I’m fine with this going without me. Below 22600 I will start looking for lower targets. Until then best bears can get is sideways around 23000 but we will get a big move Monday/Tuesday once we have an answer on the US-EU tariff shit show. A good start for the bears is any price below 22584.
current market cycle: resumption of the bull trend but likely the final flag and we most likely will top out here around/under 23000
key levels for next week: 22000 - 23000
bull case: Bulls obviously still in full control. 2 bear bars out of the past 9 is a strong bull trend. Until we see much bigger selling pressure, technically we can only expect higher prices. Bulls broke above the bull channel from 21000 late may and confirmed the breakout now. The issues against the bulls are also the same arguments as for them. It’s overbought, climactic and very very late in the trend. This strong selling this late is something that usually happens before we turn,
Invalidation is below 22600
bear case: Just to make this clear again, bears have nothing right now. This chart is as bullish as it gets, that is why you can not look to short this yet. With that disclaimer, I also think it’s a bad buy. We are beyond overbought on many many economic indicators worsening and this trend is trying to accelerate. This is the time where weak/late bulls come around with the “this time it’s different” and "valuations don’t matter. We will again sell off big time this year but it’s stupid to trying to pick the top here.
Invalidation is above 23200 (any number I write here is stupid because it’s top picking. It could easily go to 23500 given the strength of this move)
short term: Neutral. No interest in buying but too early for shorts. Let’s see what the US-EU trade “talks” bring next week.
medium-long term - Update from 2024-06-29: No change in plans. I expect 20000 to get hit over the next 3 months and maybe 19000 again.
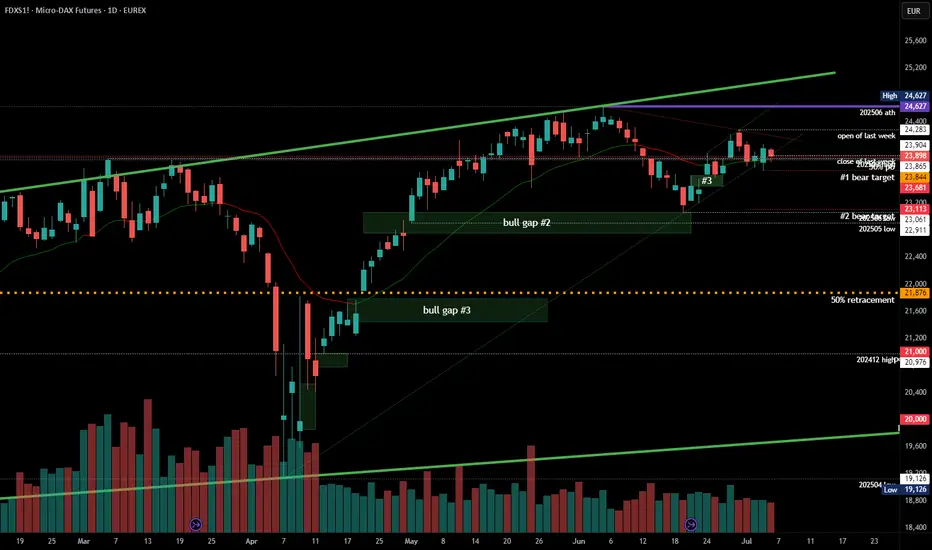
#202527 - priceactiontds - weekly update - daxGood Day and I hope you are well.
comment: Neutral. Clear triangle on the daily chart and mid point is 23850. Week closed at 23900. Market is in balance and I think it’s completely 50/50 for both sides where the breakout will happen. Given the tariff shit show, I would wait for it to happen and be flat until then. If they apply 10%+ tariffs on EU imports, we go down, if they postpone, we rally further. I trade only technicals but this is one of the few moments per year where news will completely determine where the markets will breakout out next.
Big if. If orange face does another TACO move, momentum is strong enough for markets to keep going and squeeze further. We need a very strong daily bear bar to kill it.
current market cycle: trading range - triangle
key levels for next week: 23500 - 24300 (above 24300, 500 comes into play and also likely 600+)
bull case: Bulls made a higher low but barely. This is a bad looking bull trend from the 23061 low and market is currently in breakout mode to decide where we go next. The 24283 high is a reasonable high to turn lower but as longs as bulls stay above 23600, there is a chance of this doing another try at 23300 and above the ugly bull channel is confirmed and higher prices are likely.
Invalidation is below 23500
bear case: Bears keeping it below 24000 is good but they are not doing enough or we would have made lower lows below 23600. Everything depends on the US-EU tariffs over the next days. Technically all bullish targets are met and the 24283 was high enough to qualify as a re-test. Market is free to go down again, it just needs a catalyst.
Invalidation is above 24300
short term: Neutral. I won’t gamble on the trade talk outcome but I am much more eager to sell this on bad news than to buy it on not-too-bad news.
medium-long term from 2025-06-29: Bull surprise last week but my targets for the second half of 2025 remain the same. I still expect at least 21000 to get hit again this year. As of now, bulls are favored until we drop below 23000.
XAUUSD Daily Outlook – July 7, 2025👋 Hey traders, welcome to the fresh week! After the Friday selloff, gold is approaching a key inflection point. Let’s break down what’s happening on the Daily chart and how to approach it with clarity — no guessing, just precision.
Stay focused. The real opportunity is always in how you prepare.
🌍 Macro + Sentiment
Market remains sensitive to yield shifts and broader risk sentiment (BRICS summit also continues)
Price remains elevated in premium territory after months of vertical flow — but structure is finally showing re-accumulation or re-distribution?
📈 Daily Bias
Neutral to bearish until the 3330–3344 zone fully flips cleanly as support
Structure shows lower highs, strong wick rejections in premium zones, and a need for confirmation
🧠 What the chart tells us:
Price is compressing between a D1 FVG (below) and unfilled premium OB (above)
Friday’s low wicked into a small imbalance — but was not a clean tap into the main OB
RSI is midrange, EMAs are flat, and momentum is indecisive
We're either gearing up for a bullish FVG reclaim or prepping for a deeper drop into discount
⚠️ Key Zones to Watch
🔵 Support Zones (Buy Zones)
3230–3208
→ D1 Fair Value Gap + unmitigated bullish OB + discount pricing
→ Valid only with clean bullish rejection. High interest for sniper entries if price returns.
3170–3154
→ Untapped daily OB + historical support wick + aligns with deeper discount zone
→ Stronger bounce zone if 3230 fails. Confluence with fib retracement & RSI likely oversold here.
🔴 Supply Zones (Sell Zones)
3420–3450
→ Premium FVG + D1 OB combo + previous bearish rejection wick
→ High probability inducement area. Valid only if price fails to hold 3344 flip.
3388–3402
→ Minor supply + internal structure break level
→ Short-term reaction area. Lower conviction but watch for rejection if price overextends.
🟡 Decision / Flip Zone
3327–3344
→ Former support now turned resistance
→ If this zone flips bullish and holds, bias shifts to continuation. If rejection occurs, confirms retracement deeper into discount.
✅ Conclusion
The market is entering a decision week — no rush. Let the chart guide you.
Clarity comes not from prediction, but preparation. This chart isn’t hindsight — it’s a live framework.
✨ Final Thought
If this chart feels clear, that’s because it was built with intention — not after the move, but before it happens.
The difference between noise and precision is structure.
And we don’t guess — we prepare.
🚀 If you appreciate detailed, real-time structure like this, hit follow and join the traders who value clean execution over hype.
💬 Drop your bias below — bullish or bearish this week?
📢 Disclosure: I use Trade Nation's broker feed on TradingView and I'm part of their influencer program.
📉 This is educational content and not financial advice.

XAUUSD Weekly Outlook | July 7–11, 2025“The market always whispers before it roars. The wise trader listens to structure.”
Hello beautiful minds 💬
We enter the second week of July with strong macro undercurrents and new structure shifts beginning to show. While the U.S. celebrated Independence Day, the market quietly set up key zones for next week’s liquidity sweep.
🔸 Macro & Geopolitical Overview
🟠 Geopolitics: Tensions continue post-BRICS Summit, with a focus on further de-dollarization talks.
💰 U.S. Economy: Consumer credit and NFIB small business confidence to kick off the week.
🔔 Big catalysts:
Wednesday: Fed speeches (Mouslem, Waller, Daly)
Thursday: Unemployment Claims + Bond Auction
Friday: Federal Budget Balance (a key fiscal stress indicator)
📉 Expect spikes in volatility mid-week and dollar reactions post-FOMC speeches.
🔸 WEEKLY BIAS:
Still bullish to neutral, but momentum is cooling inside a premium rejection range.
Price broke structure to the upside in May-June, forming a new weekly higher high (HH) above 3380 — but failed to hold convincingly above the volume imbalance (void zone) around 3430–3480.
We are now rejecting premium and hovering just under the 3327 level — previous institutional support and the midpoint of the weekly FVG.
🔹 Weekly Key Zones
🟢 Support zone to watch (buy interest)
3204–3230 = Weekly FVG + equilibrium retrace + EMA50 rising
This is the main discount reaction zone. If price taps in with bullish PA, we look for bullish continuation toward 3327 then 3380.
🟡 Mid-level (decision point)
3327 = prior key support now acting as resistance
Watch how price reacts here — if it flips cleanly with a daily close, short-term bullish pressure may return.
🔴 Supply zone / resistance (sell interest)
3420–3480 = Weekly FVG + premium OB + liquidity sweep zone
This is the main premium rejection area. If tapped again without strong volume or fundamentals, this may fuel a swing short setup.
🔸 What This Means for You
This week is about patience and precision. The cleanest setups may come after volatility spikes during Fed speeches. Structure will tell — but emotional control will confirm.
If you feel like you’ve been chasing trades lately… this is the week to reset.
Focus only on sniper setups. Wait for them to form. Let others rush.
🔚 Final Words from the Team
Clarity beats chaos. Always. This weekly map is your compass — now it’s your job to wait, watch, and act with precision.
🔔 Follow GoldFxMinds for structured gold planning that respects both price and time.
🗨️ Drop a comment with your bias — bullish or bearish this week?
—
📌 Disclosure: This analysis is for educational purposes only and reflects market structure at the time of writing. No financial advice.
EURJPY: Bullish Outlook Explained 🇪🇺🇯🇵
There is a high chance that EURJPY will continue rising
from an underlined horizontal support.
I see 2 strong price action confirmations:
the price violated a resistance line of a bullish flag
and a neckline of a double bottom pattern.
Goal - 170.4
❤️Please, support my work with like, thank you!❤️
I am part of Trade Nation's Influencer program and receive a monthly fee for using their TradingView charts in my analysis.

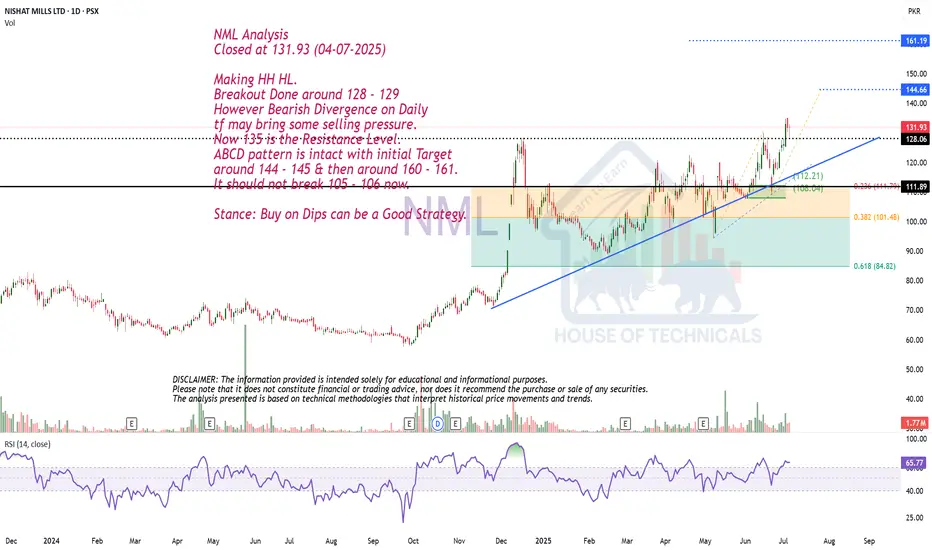
Making HH HL.NML Analysis
Closed at 131.93 (04-07-2025)
Making HH HL.
Breakout Done around 128 - 129
However Bearish Divergence on Daily
tf may bring some selling pressure.
Now 135 is the Resistance Level.
ABCD pattern is intact with initial Target
around 144 - 145 & then around 160 - 161.
It should not break 105 - 106 now.
Stance: Buy on Dips can be a Good Strategy.
EURUSD 4H Structure Analysis | MMC Strategy + Channel + CurveIn this EURUSD 4-hour chart analysis using MMC (Market Mind Concept), we are observing a textbook rising channel structure accompanied by a black mind curve (evidence of psychological support behavior). Let's break it down:
📊 Structure Overview:
Straight Ascending Channel:
Price has been respecting a clean, straight rising channel, forming higher highs and higher lows over the past several weeks. This structure provides a controlled bullish bias, but we are approaching an inflection point.
Black Mind Curve Support (Evidence 2):
A curved trendline (Mind Curve) is providing dynamic support. This curve intersects with the lower boundary of the rising channel—creating a confluence zone, which is likely to act as strong short-term support or the base of a reversal.
Major BOS (Break of Structure):
A significant bullish BOS occurred earlier, confirming momentum strength. This previous break is acting as a reference point for bullish continuation scenarios.
📉 Bearish Scenario:
If the price breaks below the channel and mind curve support, this would invalidate the current bullish channel structure.
A clean breakout + retest below the support zone may invite strong selling pressure, targeting previous support zones around 1.1500 – 1.1350.
📈 Bullish Scenario:
If the price holds above the mind curve and continues upward, we may see a breakout above the top of the channel.
A confirmed breakout could send price toward the 1.1900 – 1.2000 resistance zone.
Patience is key—wait for a confirmed breakout from the channel (either side) before engaging.
⏳ Strategy Outlook:
✅ Wait for channel breakout confirmation (up or down)
⚠️ Watch for fakeouts or liquidity grabs near channel boundaries
🔁 Mind Curve Support adds another layer of decision-making structure
🧠 Trade with the trend, but remain adaptable to shift if channel breaks
🔍 Summary:
The EURUSD pair is in a decision-making zone—either we get a bullish continuation breakout, or the structure fails and we flip into a bearish correction. The confluence of the straight channel and mind curve makes this setup high-quality for both trend traders and breakout traders.

USDJPY 4-Hour Technical Analysis (Smart Money Concept Breakdown)📈 Overall Market Structure Overview:
The chart reflects a multi-phase Smart Money playbook, consisting of:
Bullish channel structure
Breakout followed by liquidity sweep
Supply zone flip to demand
Price mitigation and structure shift
Anticipated reaction zone for upcoming move
🔎 Phase-by-Phase Analysis:
🧱 1. Ascending Channel Formation
Price was moving upward in a controlled bullish ascending channel, suggesting institutional accumulation with planned distribution above highs.
The channel breakout was the first significant liquidity event, where early breakout traders were baited.
💧 2. Fakeout and Supply Interchange into Demand (Ellipse Zone)
Once the channel broke, price sharply reversed, retracing into a previous supply zone.
However, institutions defended this zone, flipping it into a demand area.
This behavior, marked with the blue ellipse, signals “Supply Interchange in Demand” – a core SMC concept.
Here, orders were absorbed
Liquidity was trapped below
A bullish push confirmed institutional intent
🎯 3. Previous Target Hit – Completion of Bullish Leg
Price made a strong rally from the demand zone, hitting the previous target near 147–148 zone.
This bullish leg created a Major Break of Structure (BOS) confirming bullish dominance at that phase.
⚠️ 4. Distribution Begins: Shift in Momentum
After reaching the Major BOS area, price failed to hold higher levels.
A decline followed, indicating distribution by smart money.
The reaction was sharp and consistent, creating lower highs, signaling weakness.
🔄 5. Minor CHoCH Formation – Early Reversal Signal
A Minor Change of Character (CHoCH) occurred around the 144.000–143.000 area.
This is a key transition, where smart money transitions from bullish intent to potential bearish delivery.
📦 6. Next Target Zone – Bullish POI (Point of Interest)
The chart identifies a next target demand zone around 141.800–141.200, marked in green.
This zone:
Holds unmitigated demand
Sits below a recent liquidity pool
Aligns with past support
This is where Smart Money could re-enter, offering a long opportunity if a bullish CHoCH or BOS forms from that zone.
📊 Trade Scenarios & Forecast:
🔻 Bearish Short-Term Play (Sell Setup):
If price respects current resistance (144.500–145), and a lower high forms:
Short entry opportunity
Target: 142.000–141.200 demand zone
Confirmation: Strong bearish candle, CHoCH below minor support
🔺 Bullish Reversal Play (Buy Setup):
At the demand zone:
Look for bullish reaction + CHoCH or BOS
Long entry potential
Target: Retest of 144.000 or even 147.000 if liquidity allows
🔐 Smart Money Tactics in Play:
Liquidity Engineering:
Price trapped both bulls (at highs) and bears (below ellipse zone)
Supply into Demand Flip:
A classic trap where supply becomes a launchpad for bullish delivery
Minor CHoCH:
Early signal of intent change
Next POI (Point of Interest):
Potential reaccumulation zone below major liquidity grab
🧠 Educational Takeaway:
This analysis illustrates:
Why breakouts are often traps without confirmation
How to identify real institutional zones
The role of CHoCH/BOS in planning ahead
Importance of waiting for price to come to your levels, not chasing
⚠️ Risk & Caution:
News catalysts can cause deviation from technical levels
Always use stop loss and proper risk management
SMC is about patience and precision, not prediction
✅ Summary:
USDJPY is showing early signs of a smart money distribution and a potential pullback toward demand.
Watch closely for confirmation at the key zone (141.800–141.200) before engaging long. Until then, short setups on rallies may be favorable.

XAGUSD Analysis : Consolidation & FMFR Setup + Target🧭 Technical Overview:
Silver has had a strong bullish rally that started after the breakout of a long-term symmetrical triangle pattern. This breakout marked a Major Break of Structure (BOS) and shifted the overall market sentiment toward the bulls. Since then, price has been consolidating under a major resistance zone, forming a compression range, which is now shown as a blue elliptical zone in the chart.
This ellipse is not just a consolidation area — it represents a neutral compression zone where price can explode in either direction. The price action inside this area has been choppy and manipulative, sweeping both local highs and lows without real follow-through — a perfect environment for a Fake Move – then Reversal (FMFR) strategy.
🔍 Key Chart Components:
🔹 1. Ellipse (Dual Directional Zone)
This region shows indecision. Price is coiling inside, creating higher lows and lower highs — a volatility squeeze. A breakout from this ellipse is likely, but the first breakout move may be fake, followed by a quick reversal.
🔹 2. Major BOS (Break of Structure)
Price broke out of a long-term descending structure and pushed strongly upward, which marked a significant bullish shift. The pullback after that BOS was shallow — a sign of continued strength — but now we’re at a decision point.
🔹 3. Resistance Zone (Previous Target Area)
The price is now retesting a strong historical resistance around $37.00–$38.00, where we’ve seen rejections before. This is the liquidity zone where breakout traders enter long, but institutions may sweep them for liquidity before reversing.
🔹 4. Minor and Major CHoCH Levels
Minor CHoCH: Around $35.00–$35.50
Major CHoCH: Near $33.80–$34.00
These are reversal zones to watch if a fake move to the upside occurs and price rolls over.
📉 FMFR Setup Explained:
FMFR (First Move Fake Reversal) is a market behavior pattern where:
Price fakes a breakout in one direction (e.g., above resistance).
Attracts liquidity (traders’ orders).
Reverses rapidly in the opposite direction, trapping those who entered late.
In your chart, the blue notes say:
“In This Case, XAGUSD Have to Gave FMFR From Anyside”
“First Move Fake Then Reversal”
This highlights that no matter which direction the market initially breaks, it’s likely to reverse shortly afterward. This pattern is often seen before major moves when the market seeks to clear liquidity.
🔄 Scenarios to Watch:
🅰️ Bull Trap (Fake Breakout)
Price spikes above $37.80–$38.00.
Sweeps the highs and rejects sharply.
Reversal triggers below the ellipse, heading toward minor/major CHoCH.
🅱️ Bear Trap (Fake Breakdown)
Price dips below $35.00 (minor CHoCH).
Triggers panic sells.
Then rebounds quickly into the previous high zone or beyond.
⚙️ Trading Strategy Ideas:
Wait for Confirmation: Enter only after a confirmed breakout and retest OR a fakeout with reversal candles (e.g., engulfing, pin bar).
Use Tight Risk Management: Place stops outside sweep zones. This setup is volatile and can trap undisciplined trades.
Watch Volume & Wicks: Spikes with wicks and no close beyond the level usually confirm FMFR setups.
🔐 Key Levels to Watch:
Zone Price Level Action
Major Resistance $37.00–$38.00 Watch for fakeouts
Minor CHoCH ~$35.00–$35.50 Reversal entry zone
Major CHoCH ~$33.80 Last line of bullish defense
📝 Final Thoughts:
This is a textbook FMFR compression setup, where volatility is building inside a symmetrical price zone. The first aggressive move from this region is likely to be deceptive. Smart money traders look for trap setups, not the obvious direction. Silver is approaching a high-risk, high-reward decision zone, and staying patient will be key.
📊 Wait. Observe. React — don’t predict blindly.

GOLD (XAUUSD) 4H Technical Analysis – Channel Breakout & Target🧠 Executive Summary:
The GOLD market has completed a key structural shift following a successful bearish trendline breakout, and is now trading within a well-formed ascending price channel. Price action has recently bounced from the channel support area, which aligns closely with a retested zone that was previously resistance. All signs now point to a potential continuation of the bullish leg—but only if the current structure holds.
This analysis outlines the technical foundation, key trading zones, price action psychology, and risk management factors that define this setup.
🔍 Technical Breakdown
🔸 1. Trendline Breakout – The Structural Shift
The bearish trendline, which previously capped multiple upside moves throughout June, has finally been broken.
The breakout was accompanied by higher volume and larger bullish candles, indicating momentum.
After the breakout, price pulled back near the trendline and respected the newly flipped support zone.
This forms a classic Breakout–Retest–Continuation pattern, one of the most reliable in trend reversal scenarios.
🔸 2. Formation of Ascending Channel – A New Bullish Structure
After the breakout, price action established a consistent pattern of higher highs and higher lows, confirming the birth of a new ascending channel.
The channel support (around 3,320–3,330) has been tested multiple times and held strong.
The channel resistance lies between 3,390–3,400, which is now the next short-term target if bulls maintain control.
The channel offers both trend direction and entry timing opportunities as price bounces between its boundaries.
🔸 3. Retest Zone – Buyer’s Territory
The price is currently bouncing off the mid-channel zone, where the previous downtrend resistance overlaps with current channel support.
This confluence area is where smart money often enters after institutional accumulation at the base (around 3,270).
The bullish wick rejections around this zone signal a likely continuation toward the upper channel.
📈 Price Behavior & Market Psychology
What’s happening here isn't just lines and candles—there’s a psychological story unfolding:
Fear drove the market lower, respecting the bearish trendline until late June.
Hope and buyer aggression surged once the breakout confirmed.
Now we’re in the "belief" phase, where traders await confirmation of the new trend.
Many are watching for entry confirmation at support zones, and as long as fear doesn’t return (i.e., price breaking below 3,320), the structure remains valid.
🧭 Key Technical Levels to Watch
Level Type Price Range Notes
Major Support Zone 3,270–3,285 Key buyer zone, invalidation of bullish case below this
Channel Support 3,320–3,330 Retest zone after breakout, current active level
Mid-Channel Area 3,350–3,360 Decision zone – price may build momentum here
Channel Resistance 3,390–3,400 First bullish target, potential breakout area
Breakout Target 3,420–3,440 If price breaks channel resistance with volume
🧮 Trade Setup Ideas (Educational – Not Financial Advice)
🟢 Long Setup Option 1:
Entry: Upon confirmation above 3,340–3,345 with bullish engulfing candle or breakout bar.
Stop-Loss: Below 3,320 or slightly below channel support.
Take Profit: Partial at 3,390 (channel top), full at 3,420–3,440 breakout zone.
R:R Ratio: 1:2.5+ (highly favorable)
🔴 Bearish Scenario (Risk Management)
If price closes below 3,320 with momentum, expect a revisit to the 3,270–3,285 support.
This invalidates the current bullish channel structure and might bring in short-term bearish pressure.
Avoid long positions until new structure is formed.
🧠 Educational Takeaway for Traders
This analysis highlights the importance of:
Structure-based entries: Instead of chasing candles, you wait for confluence and entry triggers.
Multiple timeframe confirmation: Higher timeframes also show bullish bias, giving confidence to 4H trades.
Risk management: The current setup allows tight stop losses relative to potential reward, making it attractive.
By combining trendline breakouts, channel formations, and support/resistance flips, you significantly increase the probability of a successful trade.
📌 Final Thoughts:
Gold is giving traders a clean and structured opportunity. The market has shown strength through structure, not just random price spikes. With the ascending channel intact and price respecting support zones, there is a solid foundation for a bullish continuation toward 3,400 and beyond.
But as always, confirmation is key. Wait for price action to validate your bias, and never ignore risk management.

EUR/JPY: Bullish Setup on 170.00 Breakout & Dovish BoJWe've identified a compelling, high-conviction long trade setup on EUR/JPY, perfect for a limit order right now. This trade leverages a powerful combination of fundamental divergence and a confirmed technical breakout, setting the stage for quick execution and potential profit! 🎯💰
Fundamental Rationale: 🌍📊
Japanese Yen (JPY) Weakness: The JPY is under significant bearish pressure. 📉 The Bank of Japan's (BoJ) persistently dovish monetary policy, keeping interest rates at historic lows, creates a wide interest rate differential. This fuels "carry trades," where investors borrow low-yielding JPY to invest in higher-yielding currencies like the Euro, increasing JPY supply. Recent weak economic data, including a decline in Tokyo CPI, reinforces expectations that the BoJ will not hike rates in 2025. Additionally, a global "risk-on" sentiment diminishes the JPY's safe-haven appeal, leading to capital outflow and sustained Yen depreciation. 🐻📉
Euro (EUR) Stability: While the Euro isn't showing explosive bullish momentum, its relative stability provides a crucial counter-balance to the weakening Yen. 🇪🇺 The European Central Bank (ECB) is inclined to maintain its current policy, and recent Eurozone inflation data hasn't significantly altered expectations for further rate cuts in H2 2025. This steady footing, paired with the pronounced JPY weakness, creates a compelling bullish case for EUR/JPY. The Euro's role is to be a stable anchor against a fundamentally weak JPY, allowing the cross to climb. ⚖️
Technical Setup: 📊✨
Decisive Breakout Confirmed: EUR/JPY has achieved a powerful and decisive breakout above the critical psychological resistance of 170.00 and its previous yearly high of 169.75. This is a monumental technical event! Such a sustained move above key long-term barriers signals strong underlying buying pressure and confirms a "new trigger for the bulls," indicating a high probability of continued uptrend. 🚀⬆️
High-Probability Entry Strategy: Our entry strategy is designed for a quick and successful fill. Following the confirmed breakout, we anticipate a classic "breakout and retest" phenomenon, where price pulls back to retest the former resistance (now new support). By placing a limit order slightly below the current market price, at 170.10, we aim to catch this anticipated pullback, securing an optimal entry with a tighter risk profile. 🔄🎯
Clear Resistance Target: Our single Take Profit target is strategically set at 170.90, just below the next significant resistance: the 78.6% Fibonacci retracement level at 170.93. This level, derived from a previous long-term decline, represents a key area where price might encounter resistance. Targeting slightly below it increases the probability of the TP being hit before any potential reversal. 🎯✅
Trade Parameters: 📋✨
Currency Pair: EUR/JPY 💶🇯🇵
Direction: Long (Buy) ⬆️
Entry (Limit Order): 170.10
Take Profit (TP): 170.90
Stop Loss (SL): 169.60
Risk-Reward Ratio: 1.6:1 (A favorable ratio for a high-probability setup!) ✅

04.07.25 Morning ForecastPairs on Watch -
FX:GBPJPY
FX:USDJPY
OANDA:XPTUSD
FX:EURCAD
A short overview of the instruments I am looking at for today, multi-timeframe analysis down to what I will be looking at for an entry. Enjoy!

EIHotel,1W , Bullish it has formed a flag Pattern and ready to breakout of pattern , wait until weekly strong close and take the trade with proper risk management and proper position sizing .
Follow for more Swing Ideas Like this

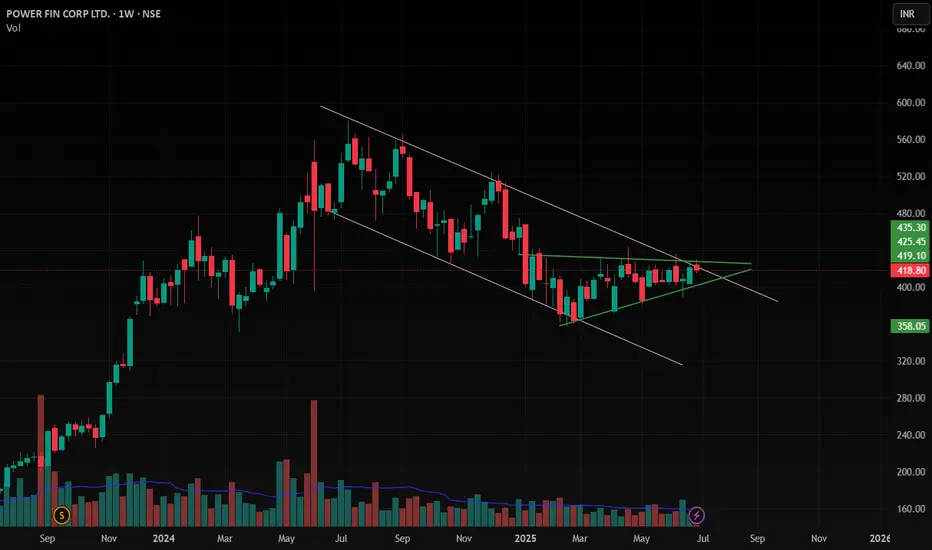
PFC , 1W , Bullishit has formed a Very Good Pattern and Ready to giving a Breakout and Wait patiently for Weekly close , after that enter into Trade , follow proper position sizing and follow risk management
follow for more Swing Ideas like this
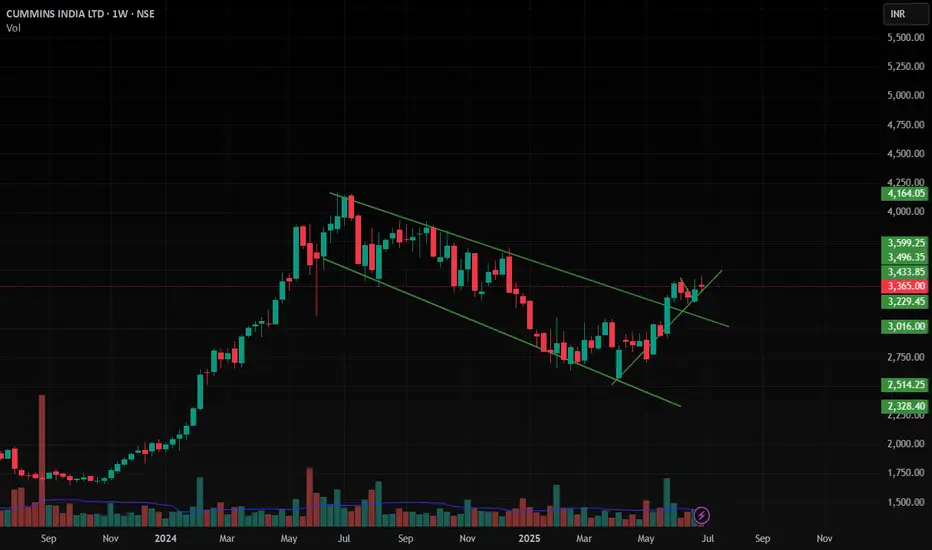
Cumminsind , 1W, Bullishit has Formed a very Good Pattern and Given a Breakout with Good Volume and now it is Trending to Up side ,
Follow proper position sizing and Risk Management
Follow for More Swing Ideas Like this
UPL , 1W , Weekly Bullish As the UPL pattern is looking very Good and Giving Breakout and Enter only after the Close of Weekly time frame .
follow your risk Management , proper Position Sizing

Gold (XAUUSD) – July 4: Structure Shift & Short BiasYesterday’s price action (July 3) delivered a crucial structure break that changes our short-term trading outlook.
We were expecting a bullish continuation with a clean break above the 3365 M15 swing high .
Price reached as high as 3364, but failed to break the high — showing early signs of exhaustion.
Then came the PMI news release, triggering a sharp drop that broke the M15 Higher Low and shifted structure.
🔻 Structure Has Shifted
As of today, July 4, the intraday market structure has flipped from bullish to bearish.
✅ M15 trend: Now in a confirmed downtrend
✅ H4 trend: Entering a pullback phase
❌ Previous bullish continuation setup is invalidated
We now adjust our approach to align with the new structure — not the old expectation.
📉 Updated Bias: Short
With M15 and H4 now aligned in pullback, our active bias is bearish.
This means:
• We are not planning any long trades until structure shifts back
• Focus shifts to short setups only, executed with discipline
🔍 Intraday Short Setup Plan – July 4
We are watching for price to retrace into valid M15 POI zones before resuming the downtrend.
🔸 First zone to watch:
• 3348–3352 → M15 POI with strong probability for rejection
🔹 Execution Rule:
→ If price enters this zone
→ And we see M1 confirmation (ChoCh + micro BoS)
→ We will plan a short entry, with structure-based SL and minimum 1:3 RR
🎯 Downside Levels Ahead:
If bearish momentum continues, the next potential reversal/support zone is:
📍 3280–3285
→ This will be a key area to observe for signs of exhaustion or base formation
→ Until then, trend remains valid to the downside
🧭 Final Thoughts:
This shift from bullish to bearish bias is a textbook example of why we follow structure — not predictions .
The market gave a clean BoS at 3358, but failed to follow through.
Instead of forcing the long, we’ve now flipped bias in line with the chart’s reflection.
📖 Let the chart guide your thinking.
Structure reveals the direction.
Confirmation controls the execution.
The chart is the mirror.
📘 Shared by @ChartIsMirror
Author of The Chart Is the Mirror: Mastering Gold with Structure, Stillness, and Price Action

2025-07-03 - priceactiontds - daily update - daxGood Evening and I hope you are well.
comment: On my weekly chart I think this W4 was too deep to be part of a strong bull trend. 24000 is a decent spot to go sideways rather than up but above 24100 means I’m likely wrong and bears could give up for 24500+. I would not look for shorts until we see better selling pressure again. The Globex spike from 23681 to 23963 was beyond weird. It’s a bull wedge but will likely break out sideways in Globex session. 50/50 for both sides I think.
current market cycle: unclear. bull trend could continue but trading range is most likely
key levels: 23600 - 24500
bull case: Bulls want a retest of 24500+ but they find no buyers around 24000. They tried so many times to print 24000 and today they finally did it again but they would need to stay above 23900 and go sideways until bears give up. Markets can poke at a price long enough until one sides gives up.
Invalidation is below 23860.
bear case: Bears need lower lows again and if they can get below 23860, many bulls could cover in fear of a bigger pullback down to 23700. As of now bears have zero arguments since we only made higher lows since Globex low but we are also barely making higher highs and if we do, they have tails above.
Invalidation is above 24100.
short term: Completely neutral. Can go both way. US markets are overbought and once the profit taking starts, Dax won’t hold up either. Not much interest in guessing which way we go from 24000. Best to sit on hands and wait for a clear and strong signal.
medium-long term from 2025-06-29: Bull surprise last week but my targets for the second half of 2025 remain the same. I still expect at least 21000 to get hit again this year. As of now, bulls are favored until we drop below 23000
trade of the day: Longs since the giant Globex bull spike but had to have wide stops and scale in. Not an easy day.

Dow’s fighting hard for that breakoutDow Jones is moving within a bullish channel
with low selling pressure —
strong legs pushing toward the top.
I’m expecting another solid bullish leg.
BLACKBULL:US30
