GJ-Wed-4/06/25 TDA-GJ strong push, will it continue?Analysis done directly on the chart
Follow for more, possible live trades update!
Trading is not easy, there are so many factors,
variants that influence the price movement.
Generally when big moves happen, it is caused
by big news, important speeches, flash news.
Markets don't move randomly, it's really important
to understand why price had this particular move,
at that specific time and ask why.
Not financial advice, DYOR.
Market Flow Strategy
Mister Y
Priceaction

04.06.25 Morning ForecastPairs on Watch -
FX:EURUSD
FX:USDJPY
FX:GBPCHF
OANDA:XPTUSD
A short overview of the instruments I am looking at for today, multi-timeframe analysis down to what I will be looking at for an entry. Enjoy!

HUGE $5 to $49 today +900% vertical $MCTR told you early!HUGE 🤯 $5 to $49 today +900% vertical 🚀 shared a chart with you early before it went on a power squeeze NASDAQ:MCTR

2025-06-03 - priceactiontds - daily update - nasdaqGood Evening and I hope you are well.
comment: Bulls buy every dip and so should you, until it stops working. Clear target above and also clear invalidation level below us. Trade the wedge.
current market cycle: trading range
key levels: 20700 - 22000
bull case: Bulls will likely get a third leg up tomorrow and if they want it bad, we could accelerate upwards for 22000. Right now the wedge is clear but if we get so close to 22000, I doubt market will hesitate to print it. Bulls have to stay above 21500 or risk a deeper pullback to 21300 and I don’t know if they could do 22000 afterwards. If we print below 21500, I think I’d expect a lower high below 21800 but for now they are in full control and are favored for 22000.
Invalidation is below 21500.
bear case: Literally the exact same play every day. Globex and EU sell it, US session pumps. Don’t fight it. Will end soon but just don’t be early. Below 21500 would be a start but only a daily close below 21000 will make me turn bear.
Invalidation is above 22100.
short term: Neutral because longs above 21650 are bad. Wait for a pullback to 21600 or 21550. Can you make them work? Sure but you would have to have a stop at least 21400 and scale in. Bears have nothing for now.
medium-long term - Update from 2024-05-24: Will update this section more after the coming week but in general the thesis is as for dax. Down over the summer and sideways to up into year end. I don’t think the lows for this year are in.
trade of the day: Longing the double bottom on the 15m tf on US open at 24500.

$5 to $19 or +300% vertical! Catching a safe piece of $MCTR$5 to $19 🚀 Catching a safe piece daily from the move like that is all you need to keep the job away 💯 NASDAQ:MCTR

EURUSD - Short Opportunity Ahead EURUSD is currently approaching a key resistance level after a strong upward move. Price action is showing signs of exhaustion, and bearish signals are beginning to emerge. If the pair fails to break above the resistance and confirms a rejection, we may see a short-term pullback or a potential trend reversal.
A clean break below the recent support zone could provide a short opportunity, with possible downside targets near previous lows. As always, proper risk management is essential, especially in high-volatility conditions.
---
Key Technical Points:
Price nearing a strong resistance zone
Bearish candlestick formation / divergence (if applicable)
Wait for confirmation before entering a short position
🔒 This is a trade idea for educational purposes only — not financial advice.

GBP Bearish Outlook | Potential GBP Short Setup The GBP is currently showing signs of weakness as it approaches a key resistance zone. Price action suggests a potential bearish reversal, with lower highs forming and momentum indicators signaling exhaustion. A rejection from this level could lead to a continuation of the downtrend. Traders may look for short opportunities upon confirmation of a breakdown below support, with potential targets at previous swing lows.
Key Points:
Price testing major resistance zone.
Bearish candlestick patterns visible.
Momentum divergence / overbought RSI (if applicable).
Potential short entry on breakdown with tight risk management.
This is just idea not financial advice

GOLD (XAUUSD) 1H Chart | Bullish Breakout Idea With Key Zones > "Gold is showing strong bullish structure on the 1H timeframe. Price is approaching key breakout zones with momentum building. This idea highlights critical support/resistance levels and potential breakout targets. Watch for confirmation before entry."
This is just idea not a financial advice !

NZDCAD - Lucrative Range!Hello TradingView Family / Fellow Traders. This is Richard, also known as theSignalyst.
📈NZDCAD has been hovering within a range between the red support and blue resistance.
This week, NZDCAD has been bearish and approaching the red support.
Moreover, it is retesting the lower bound of its rising wedge pattern in blue.
🏹 Thus, the highlighted blue circle is a strong area to look for buy setups as it is the intersection of support and lower blue trendline acting as a non-horizontal support.
📚 As per my trading style:
As #NZDCAD approaches the blue circle zone, I will be looking for bullish reversal setups (like a double bottom pattern, trendline break , and so on...)
📚 Always follow your trading plan regarding entry, risk management, and trade management.
Good luck!
All Strategies Are Good; If Managed Properly!
~Rich
Disclosure: I am part of Trade Nation's Influencer program and receive a monthly fee for using their TradingView charts in my analysis.

03.06.25 AUDUSD Trade Recap (Breakeven Manual Close)A long position taken on AUDUSD for a breakeven manual close, full explanation as to why I made this decision in the recap and my current thoughts on this pairs next move

Full trade plan with exact prices laid out ahead of time!After shortsellers forcefully pushed NASDAQ:MODV down from mid $2's I said this will most likely result into powerful squeeze.
I said buy at the dip $2.31 exactly, waited to get filled, double dip to $2.31 happened to get a full position and from there straight up to mid $3's, took profits in 2 parts and sent out messages live as it was happening so everyone that followed along knew what to do.
Solid +30% gain in minutes, taking safest piece of the 200% move the stock made before focus shifted elsewhere.
That's how it's done, in and out at highly predictable levels, then moving on to the next stock because NASDAQ:NIVF NASDAQ:EYEN NASDAQ:REVB are already up and hot this morning, not marrying it and holding & hoping forever.

JPYUSD Technical Breakdown | Inverse Head & Shoulders + Target🔍 Pattern Breakdown: Inverse Head & Shoulders (H&S)
We’ve identified a textbook Inverse Head & Shoulders pattern, a classic bullish reversal formation that often appears at the end of a downtrend. Here's how the structure played out:
Left Shoulder:
The initial drop formed a local low, followed by a short recovery, creating the first "shoulder" on the left.
Head:
A deeper push down formed the lowest point of the pattern, indicating a possible trap for sellers or exhaustion in bearish momentum. This is the "head" and the key anchor of the pattern.
Right Shoulder:
A higher low forms, showing buyers stepping in earlier and with more strength. This symmetry confirms the structure and signals a potential reversal in trend.
Neckline:
Drawn across the highs between the shoulders, this key resistance line was broken decisively, confirming the bullish pattern and triggering an upward breakout.
📌 Trendline + Retest Zone = Confluence Support
After the breakout above the neckline:
Price surged strongly, showing confidence in the reversal.
It pulled back gently to retest the neckline, which now acts as support.
This retest also aligns with the upward trendline, adding confluence — a strong signal in technical trading that increases the probability of a successful continuation move.
This zone is labeled on the chart as:
🟦 “Like a Retesting Zone After Boom” — a perfect description of what’s occurring.
🎯 Target and Resistance Zones
The price is now moving toward a major resistance zone marked between 0.007020 – 0.007060, with a target zone slightly above at 0.007080.
These zones represent historical selling pressure or supply areas. A breakout above this region would open doors to even higher levels, signaling strong bullish continuation.
📈 Why This Setup Matters (MMC Strategy Applied)
Using the Market Mapping Concept (MMC) approach, this trade idea combines:
Market structure (Inverse H&S pattern)
Momentum confirmation (strong bullish move after breakout)
Zone mapping (support/resistance confluence)
Trendline validation (clean structure with pullback respect)
This creates a well-defined trade setup with clear entry and exit logic, excellent risk-to-reward potential, and technical confirmation.
✅ Summary: Bullish Outlook With Managed Risk
Bias: Bullish continuation as long as price holds above the neckline/trendline zone.
Confirmation: Inverse H&S pattern + successful retest.
Target: 0.007060–0.007080 resistance zone.
Invalidation: Break below 0.006980 and close under trendline support.
💬 Minds Post Caption (Extended)
🔥 JPYUSD Ready to Fly? Inverse Head & Shoulders Breakout Spotted!
Clean reversal pattern (H&S) just completed with a strong neckline breakout and a perfect retest at trendline confluence. MMC analysis suggests bullish continuation toward the 0.007060+ resistance zone. Classic "retest after boom" move. Watching price action closely! 🚀📊

XAGUSD Analysis – Market Mapping Concept (MMC) + Target🧭 Overview:
Today's Silver price action presents a textbook example of how MMC can guide traders through:
Identifying the smart money accumulation phase.
Anticipating breakout momentum .
Locating key reversal areas based on previous liquidity maps and structural shifts.
We are currently observing Silver in the early stages of a structural retest after a breakout from consolidation. This gives rise to two powerful scenarios: either a bullish continuation after structure confirmation or a deeper retracement if the structure fails.
🔍 Detailed Chart Explanation:
🔷 1. Volume Contraction Phase
The market spent multiple sessions forming a symmetrical wedge, visible by narrowing price movement and consistent lower highs and higher lows.
This was accompanied by declining volume, signaling accumulation/distribution by institutional players.
The wedge served as a liquidity trap, drawing in both early shorts and longs before the true direction was revealed.
✅ MMC Principle: Volume contraction often precedes major breakouts as market makers build positions quietly.
🔷 2. SR Interchange – Breakout Confirmation
Price finally broke above the upper trendline, triggering a bullish impulse and confirming SR interchange (resistance turned support).
This move was backed by a strong bullish candle, showing aggressive participation and institutional involvement.
📌 This breakout candle set the tone for a structural shift—transforming from sideways to upward momentum.
🔷 3. Rapid Expansion Toward Previous Target Zone
After the breakout, price accelerated directly into a previous high (target) zone marked in blue.
According to MMC, this zone often acts as a liquidity magnet, where late buyers enter and professional traders take profits.
A rejection wick formed right after touching this zone—classic smart money behavior, catching retail traders chasing the move.
✅ MMC Principle: Prior highs/lows are not just resistance—they're engineered targets for liquidity collection.
🔷 4. Target + Reversal Area
After the rejection, price declined back into the Target + Reversal Zone. This area aligns with MMC’s ideal structure for potential buy-side re-accumulation.
This zone is where previous volume imbalances occurred, meaning it is likely to act as support if the bullish trend is to continue.
📊 Current price is consolidating within this zone, suggesting a possible bullish continuation if structure holds.
🔷 5. Structure Mapping – The Key to MMC
The most recent price reaction highlights the importance of structure mapping: identifying areas where market logic aligns with trader behavior.
The bearish pullback into the structure zone may complete a retest, and traders are watching closely for bullish confirmation.
⚙️ Technical Summary:
Key Zone Description
Volume Contraction Signals accumulation before breakout.
SR Interchange Breakout level where resistance turned to support.
Previous Target Zone Liquidity pool, ideal for institutional exits or reversal.
Target + Reversal Zone Demand zone where the trend may resume if confirmed.
Structure Mapping Current phase; price is aligning into new bullish structure or preparing for drop.
🧭 What to Watch Next:
🔹 Scenario A – Bullish Case:
Price holds within the Target + Reversal Zone.
Confirmation via bullish engulfing candle or breakout of lower high.
Target: retest of 34.80+, then potential extension to 35.20.
🔹 Scenario B – Bearish Case:
Breakdown below structure base at 33.85–34.00.
Could lead to a deeper correction toward 33.40 or 32.80 (previous volume node).
📌 Volume + Structure = Decision Point. Next few candles are crucial for validating direction.
🛠 Strategy & Execution:
Approach: Wait for confirmation candles before entering. Avoid reacting impulsively within the structure zone.
Entry Idea:
Buy on bullish confirmation in the reversal zone.
Place stop below structure invalidation.
Target the top of the previous target zone or higher.
Risk Management: Use tight SLs below 33.85 and scale in only on confirmation.
📅 Timeframe: 1H
🔭 Sentiment: Cautiously Bullish
🎯 Technique: MMC Structure Mapping + Volume-Based Targeting
🧠 Final Thoughts:
This XAGUSD chart showcases the predictive power of MMC when applied correctly. By understanding where smart money operates, traders can improve accuracy, timing, and risk control.
📌 If you found this analysis helpful, like and follow for daily insights. Drop your thoughts in the comments—do you trade MMC-style setups?

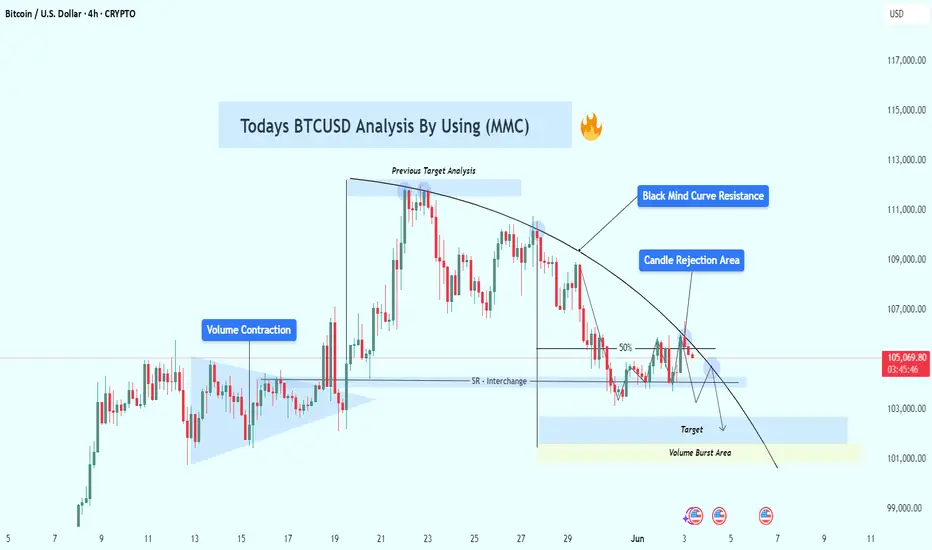
BTCUSD Analysis Using MMC – Bearish Rejection & Target🔷 Introduction:
Bitcoin is showing classic Market Maker manipulation at work—volume compression, false breakouts, support-resistance flips, and a fading rally under a well-defined descending curve.
This post offers a deep dive into the true intentions of smart money behind recent price actions, helping traders avoid traps and align with institutional moves.
🔎 Detailed Breakdown of Chart Structure:
🧱 1. Volume Contraction Zone – The Calm Before the Storm
📅 Period: May 13–18
Price consolidates within a symmetrical triangle pattern.
Volume steadily decreases as price tightens – a sign that market makers are accumulating positions while keeping volatility low.
This low-volume phase creates uncertainty for retail traders, shaking out weak hands and building a base for a deceptive breakout.
🔍 MMC Insight: Market Makers reduce volatility to absorb liquidity without alerting the market to their accumulation. This builds energy for a manipulated move.
📌 2. False Breakout to Previous Target Zone (~$110,000)
📅 May 20–23
A sudden bullish impulse takes price to the previous target zone, marked as a key area of historical liquidity.
Retail traders enter late long positions at this stage, anticipating further breakout.
🎯 But instead:
Price swiftly rejects from this level, forming long upper wicks and bearish engulfing candles.
This move is a liquidity sweep, where smart money offloads positions to late buyers.
🔍 MMC Insight: Institutions engineer a breakout to bait traders, only to dump into the momentum they create.
🔁 3. SR Interchange (Support Flips to Resistance)
📅 May 27–June 2
Former support around $104,000 – $105,000 is broken and then retested from below.
Price attempts to reclaim it, but fails—each touch results in rejection.
This confirms the area has flipped to resistance, aligning with MMC’s SR Interchange Rule.
📉 Significance: This zone now acts as a control point where market makers defend short positions.
🚫 4. Candle Rejection Area – Curved Trendline Resistance
A visually defined curved resistance line caps each rally, suggesting consistent seller presence.
Recent candles show clear rejection wicks and small-bodied candles at this level—classic distribution behavior.
Market is compressing under this trendline, hinting at an imminent breakdown.
🔍 MMC Insight: Curved trendlines show passive sell pressure where institutions repeatedly cap price in preparation for a drive lower.
📉 5. Next Target & Volume Burst Area: $101,000 – $102,000
This zone is crucial due to:
Presence of imbalance (inefficiency) left from previous bullish moves.
Likely stop loss clusters from retail long traders.
Historical high-volume node suggesting pending revisit for order rebalancing.
🟨 Yellow Zone = Volume Burst Area: Expected to act as a magnet for price due to liquidity concentration.
🧠 Psychology of the Trap:
📈 Retail Bias: “Bullish triangle breakout means more upside.”
🧠 Institutional Plan: “Use that belief to create exit liquidity, then reverse.”
This is textbook MMC manipulation:
Contract volume to build positions.
Break out to bait liquidity.
Reverse at supply.
Sell into rejection zones.
Trap traders at SR flips.
Drive price to reclaim liquidity at lower targets.
📊 Strategy Plan:
🔻 Bearish Bias Setup:
Entry Zone: $105,200 – $106,000 (candle rejection area)
SL: Above $106,800 (above supply curve)
TP1: $103,000
TP2: $101,000
TP3 (optional): $99,000 for deeper flush
🔁 Flip Bullish if:
Price reclaims $107,000 with momentum and closes above the curve.
Watch for volume confirmation and bullish SMC patterns (e.g., BOS + FVG fill).
⚠️ Risk Management & Notes:
Trade with 1–2% max risk per position.
Let confirmations play out (don't preempt rejection).
Watch U.S. data releases this week (highlighted on chart) – potential volatility triggers.
📌 Conclusion:
Bitcoin’s current behavior is a masterclass in market structure manipulation. Understanding MMC lets us:
Avoid false breakouts
Align with institutional intentions
Trade with probability, not emotion
Expect lower prices unless $106,800 is cleanly broken. The path of least resistance currently points downward toward liquidity zones.
XAUUSD Reversal Zones Identified (MMC Analysis) + Target🧠 Overview:
Today’s GOLD chart shows clear institutional footprints using the Market Maker Concept (MMC). We're seeing a sequence of liquidity sweeps, breaks of structure (BOS), and supply/demand (SD) interchanges, all pointing to a well-orchestrated bullish expansion.
This detailed analysis will break down:
Key structure shifts and manipulation zones
BOS confirmations and their implications
Upcoming reversal target zone and trade management suggestions
🔍 Chart Breakdown:
🔸 1. SR Interchange Zone (Demand Zone)
Around $3,270 – $3,280, price showed strong bullish rejection.
This zone represents a Support-Resistance Flip, where price absorbed sell-side liquidity before launching upward.
Market Makers often use this zone to induce short positions, then reverse to trap retail sellers.
🔸 2. Major BOS (Break of Structure)
Occurred near $3,365, signaling a confirmed bullish shift in market structure.
This BOS is important because it shows displacement, a core MMC trait where institutions break structure with momentum.
Once BOS was confirmed, price formed a short-term pullback, aligning with re-accumulation principles.
🔸 3. Previous Target Zone + SD Interchange
Around $3,370 – $3,385, previously identified as a resistance/target zone.
After breaking this zone, price retested it and turned it into new support (SD Interchange).
This is a common MMC move: old resistance becomes a new demand zone post-manipulation.
🔸 4. Target Hit & Bullish Continuation
Price surged upward and hit the next logical target, pausing briefly.
This confirms that the market is following liquidity engineering – price sweeps zones to collect orders, then pushes higher.
🔸 5. Next Reversal Zone: $3,440 – $3,460
This is a key supply zone based on prior inefficiencies and potential smart money exits.
Traders should watch this zone carefully for signs of bearish reaction:
Rejection wicks
Bearish engulfing patterns
RSI/MACD divergence
Volume exhaustion
💡 Trade Strategy Ideas:
✅ Bullish Bias (If price holds above BOS)
Buy retracements into demand zones (e.g., $3,365 or $3,385)
Targets: $3,420 and then $3,450
Use trailing stops to lock in profits
❌ Bearish Setup (Upon reversal signs in $3,440 – $3,460 zone)
Look for short confirmations like lower highs or bearish engulfing candles
Targets: $3,385 (former demand) or $3,365 (BOS level)
⚠️ Risk Management:
Stick to 1-2% risk per trade
Wait for confirmation before entering any reversal
Set clear invalidation levels (above $3,460 for shorts)
🔚 Conclusion:
This GOLD analysis demonstrates classic MMC and Smart Money behavior:
BOS with confirmation
Institutional demand flip
Precise target fulfillment
Approaching a high-probability reversal zone
The next few sessions will be critical. Stay sharp and patient—let the market confirm the next direction.

03.06.25 Morning ForecastPairs on Watch -
FX:EURUSD
FX:GBPAUD
FX:AUDUSD
FX:AUDCAD
A short overview of the instruments I am looking at for today, multi-timeframe analysis down to what I will be looking at for an entry. Enjoy!

GU-Tue-3/06/25 TDA-DR 1.35577 tapped, GU consolidatingAnalysis done directly on the chart
Follow for more, possible live trades update!
Consistency, build solid confidence in your
execution, management. It's not easy, but
if your plan is to stay for the long term. With
discipline, consistently showing off, patience,
dedication, study, learn, apply. You'll eventually
get there!
Not financial advice, DYOR.
Market Flow Strategy
Mister Y

GJ-Tue-3/06/25 TDA-From htf outlook, GJ quite messy zoneAnalysis done directly on the chart
Follow for more, possible live trades update!
More structure, more clarity, better trend identification.
On htf outlook, GJ is sitting in a complicated area.
Not a bad idea to risk low and preserve your capital with
this market condition and market positioning until more
clarity is shown.
Not financial advice, DYOR.
Market Flow Strategy
Mister Y

AUDCAD | Double Top RejectionThe double top rejection mentioned in the last post. We can see that price topped out at 0.90 and is now retesting the breakout from the last swing low.

AUDCAD | HnS Pattern | 500pips DownPrice action has continued selling off after retesting the previous breakout below the neckline and will be looking to hit another 500pips+
When looking at local price action on lower timeframes the double top rejection at ~0.90 has entered a distribution phase which is signaling price to fall further with the first target at 0.88 and so on.
For price to hit the last target around 0.855 I would like to see a break first then a retest/distribution phase.

AUDUSD Asia SessionWe could see bullish momentum during the Asian session pushing price into the upper supply zone around 0.65200. From there, we’ll be monitoring for bearish price action (PA) to potentially confirm a short setup.
If confirmation aligns, the short idea targets the demand zone between 0.64600–0.64500.
This is a forecast — not a signal. Trade execution will depend on what price does upon reaching the supply. We’ll drop to the H1 or M15 to refine entries if bearish confirmations present themselves.
Higher Timeframe Context: clearly marked HTF supply. Price has made a corrective leg up into this zone.
Liquidity & Reaction Area: There's likely resting liquidity above the most recent highs before the 0.65200 zone — perfect for a sweep.
Entry Plan: Smart to wait for CHoCH or BOS on LTF once we enter the supply zone. Avoid rushing — let the zone prove itself.
Target Area: The 0.64600–0.64500 zone aligns with previous structure and a minor FVG — solid short-term TP.

02.06.25 Morning ForecastPairs on Watch -
FX:AUDUSD
FX:USDJPY
FX:EURGBP
A short overview of the instruments I am looking at for today, multi-timeframe analysis down to what I will be looking at for an entry. Enjoy!

Xrp - New all time highs will come next!Xrp - CRYPTO:XRPUSD - is preparing for new all time highs:
(click chart above to see the in depth analysis👆🏻)
Xrp has clearly been trading sideways for the past 8 years. Meanwhile, market structure is respected perfectly and it seems to be just a matter of time until Xrp will create new all time highs. With the recent bullish break and retest, this scenario becomes even more likely.
Levels to watch: $3.0
Keep your long term vision!
Philip (BasicTrading)
