Gold price analysis on May 29Not beyond the previous analysis of the D candle confirming the decrease and maintaining the trend of the candle on May 27
After touching the breakout zone of 3257, Gold is reacting to increase again and there is a high possibility that there will be buying force in the market today
3275 is the reaction zone that Gold is facing in front of this increasing force when breaking 3275 will head to 3285 and this is an important breakout zone with a large number of sellers accumulating in this zone. Breaking 3285 is considered a temporary break of the downtrend and waiting for the next reaction zones for SELL strategies around 3302 and 3314
The support zones with a tendency to react to prices and are also targets for SELL signals are noted in the resistance zone of this morning's Asian session around 3256. Two notable support zones today for bottom-probing signals are noted around 3238 and 3220.
Priceactionanalysis

EUR/CHF Triangle Setup- Breakout or Breakdown ImminentThe EUR/CHF pair is currently consolidating within a triangle pattern on the 1-hour chart. This type of pattern typically forms when neither buyers nor sellers are in full control, leading to a tightening price range between descending resistance and ascending or flat support. In this case, the resistance trendline (marked in red) is sloping downward, while the support zone (highlighted in green) remains relatively flat around the 0.9330–0.9335 region.
The repeated tests of both resistance and support lines suggest that a major breakout or breakdown is likely approaching. The height of the triangle (measured from the initial impulse move) provides the basis for projecting potential breakout and breakdown targets.
🔼 Breakout Scenario (Bullish):
If price breaks above the descending resistance line, especially with volume confirmation, it may trigger a bullish move toward the breakout target of 0.9406. This level is calculated by adding the height of the triangle to the breakout point. Traders could look for buying opportunities upon breakout with stops placed below the breakout candle or just under the triangle.
🔽 Breakdown Scenario (Bearish):
Alternatively, if price breaks below the flat support zone, a bearish continuation is expected, targeting 0.9281, which is derived by subtracting the triangle's height from the breakdown level. This would indicate sellers regaining control, and the pair may revisit recent swing lows. A breakdown with strong bearish candles would validate this move.
📌 Strategy Notes:
This is a neutral-to-directional setup, meaning traders should wait for a confirmed breakout or breakdown before entering.
Volatility contraction inside the triangle typically precedes an explosive move.
Entry can be taken post-breakout with volume, or with a retest of the broken trendline for confirmation.
===============================================================
Disclosure: I am part of Trade Nation's Influencer program and receive a monthly fee for using their TradingView charts in my analysis.

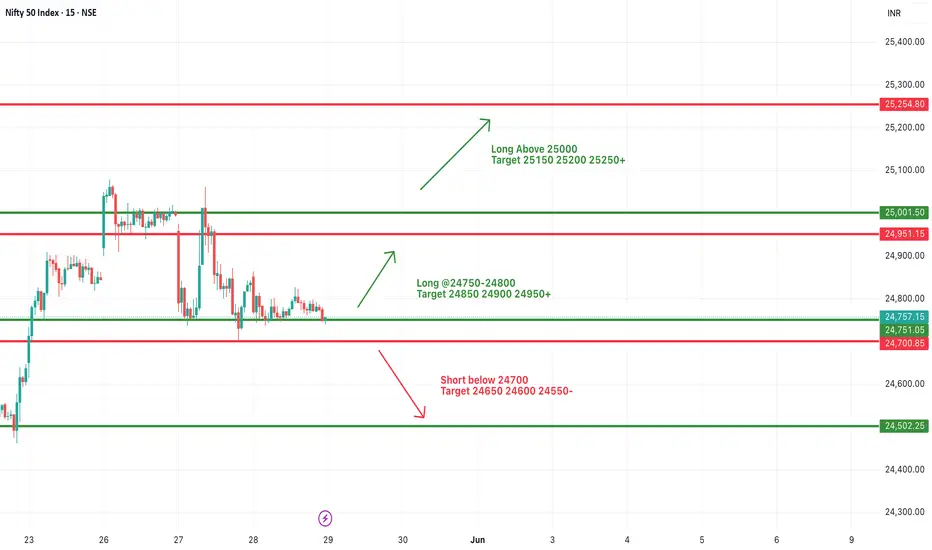
#NIFTY Intraday Support and Resistance Levels - 30/05/2025Nifty is expected to open flat around the 24800–24850 range. The market has shown signs of recovery from lower levels, and if it manages to hold above the 24800–24850 support zone, we can expect a continuation of upward momentum. In that case, possible intraday upside targets are 24900, 24950, and a breakout beyond 25000 could extend the rally toward 25150, 25200, and 25250+ levels.
However, if Nifty fails to sustain above 24800 and faces resistance near 24900–24950, a pullback may occur. A confirmed breakdown below 24700 would signal weakness and could trigger a fresh round of selling. In such a scenario, downside targets would be 24650, 24600, and possibly 24550.
Today’s session may start off sideways with consolidation between key levels. Wait for clear confirmation above 24850 for longs or below 24700 for shorts. Keep trailing your stop-loss and book partial profits near every target zone.

[INTRADAY] #BANKNIFTY PE & CE Levels(30/05/2025)Today, Bank Nifty is expected to open flat near the 55600 zone. If it sustains above the 55550–55600 range, a bullish rally may continue with upside targets at 55750, 55850, and 55950+.
Further breakout above 56050 could trigger strong momentum toward higher targets of 56250, 56350, and 56450+.
On the downside, if Bank Nifty slips below the 55450–55400 level, a bearish move may unfold with downside targets at 55250, 55150, and 55050.

29.05.25 Morning ForecastPairs on Watch -
FX:AUDCAD
FX:EURUSD
TVC:USOIL
FX:GBPJPY
A short overview of the instruments I am looking at for today, multi-timeframe analysis down to what I will be looking at for an entry. Enjoy!

#NIFTY Intraday Support and Resistance Levels - 29/05/2025Today, Nifty is expected to open flat near the 24750 level. If it sustains above the 24750–24800 zone, a bullish move is possible with upside targets at 24850, 24900, and 24950+.
Further rally may be seen if Nifty breaks above the 25000 level, aiming for extended targets of 25150, 25200, and 25250+.
On the downside, if Nifty slips below 24700, a bearish trend may unfold with downside targets at 24650, 24600, and 24550.
[INTRADAY] #BANKNIFTY PE & CE Levels(29/05/2025)Today, Bank Nifty is expected to open flat near the 55450–55500 zone. If it sustains above the 55550 level, a bullish rally may unfold with potential upside targets of 55750, 55850, and 55950+.
On the downside, if Bank Nifty fails to hold and breaks below the 55450–55400 zone, it could trigger a bearish move toward 55250, 55150, and 55050.
Expect consolidation near key levels. Wait for breakout or breakdown confirmation before entering trades. Use tight stop-loss and book profits at each target.


Apple - Please look at this chart!Apple - NASDAQ:AAPL - is just wonderful:
(click chart above to see the in depth analysis👆🏻)
Last month, Apple created a quite strong bullish rejection wick of about +25%. It was actually no surprise at all, because market structure was perfectly pushing price higher. Following the bullish break and retest pattern, new all time highs will most likely follow.
Levels to watch: $200, $300
Keep your long term vision!
Philip (BasicTrading)

28.05.25 Morning ForecastPairs on Watch -
OANDA:AU200AUD
FX:GBPAUD
A short overview of the instruments I am looking at for today, multi-timeframe analysis down to what I will be looking at for an entry. Enjoy!

USD/CHF Bearish Rejection Setup – Short Opportunity1. Market Context & Structure
The USD/CHF currency pair is currently exhibiting a bearish market structure on the 1-hour chart. After a sharp decline from the 0.8360+ level, the price has attempted to recover but remains in a corrective phase. This recovery appears to be forming lower highs and is approaching a key resistance zone. The overall structure shows a series of sharp drops followed by weaker upward retracements, a classic sign of sellers still being in control. The current rise toward the 0.8300–0.8310 level is likely a corrective move, not a reversal, and could act as an ideal zone for a fresh bearish entry.
2. Key Technical Zones
Three key price zones define this setup. The first is the resistance zone between 0.8300 and 0.8310, marked with a red box. This area has previously acted as a strong supply zone where price faced heavy selling pressure, and it is likely to be respected again. The second important area is the intermediate support between 0.8210 and 0.8225, which could serve as a partial target for profit booking or re-entry on bounce. Finally, the major demand zone lies around 0.8160 to 0.8175, a level where price previously paused before resuming upward correction. These zones collectively provide logical stop loss and target levels for managing the trade with discipline.
3. Trading Plan (Sell Setup)
The trade idea here is to initiate a short position as the price enters the 0.8300–0.8310 resistance zone. This level aligns with the previous high and the edge of a well-defined supply area. A stop loss should be placed slightly above the resistance zone—around 0.8330—to avoid getting stopped out by minor spikes or false breakouts. For targets, the first take-profit can be at 0.8225, near the intermediate support zone. If bearish momentum continues, the next logical target is at 0.8175, which aligns with previous price rejections. This plan offers a clean setup with a favorable risk-to-reward ratio of at least 1:2 or higher, depending on the exact entry and target levels.
4. Confluences Supporting the Trade
Several technical factors strengthen the case for a short position at the identified level. First, the price is moving within a downtrend, confirmed by the lower highs and lower lows. The approach toward the resistance zone appears to be a corrective wave, not a breakout. Second, the chart shows a potential M-pattern formation, where the second peak aligns closely with the previous one, indicating a likely double-top scenario. Moreover, price previously reversed sharply from this resistance zone, and similar rejection candles could appear again. This confluence of trend, price action patterns, and zone-based analysis strongly supports the bearish outlook.
5. Expected Move
Based on the current structure, once price reaches the resistance at 0.8300–0.8310, a rejection is expected. This could lead to a pullback first to the 0.8225 support area. If this level is broken with momentum, a continued decline toward the 0.8175–0.8160 zone is highly probable. This move aligns with the overall bearish trend and would complete the projected wave structure shown in the chart. Traders should watch for signs of reversal (bearish engulfing, rejection wicks) at resistance to confirm entry.
6. Trade Management
Proper trade management is key to success with this setup. Once the position is live, it's recommended to book partial profits around the 0.8225 level to secure gains. The stop loss can then be moved to breakeven or entry price to make the trade risk-free. If price bounces from this level, re-entry opportunities can be evaluated with tighter stop-losses. If the move continues beyond 0.8225, the position should be held toward the 0.8175 target with trailing stop-loss adjustments. Also, traders should be cautious around high-impact USD or CHF news events, which can cause volatility and invalidate technical levels.
===================================================================
Disclosure: I am part of Trade Nation's Influencer program and receive a monthly fee for using their TradingView charts in my analysis.

[INTRADAY] #BANKNIFTY PE & CE Levels(28/05/2025)Today, Bank Nifty is expected to open flat near the 55350–55400 zone. If it sustains above 55550, bullish momentum can be expected with upside targets of 55750, 55850, and 55950+.
If the index starts falling below 55450–55400, it may trigger a bearish move with downside targets at 55250, 55150, and 55050.
Further weakness can be seen if Bank Nifty breaks below 54950, leading to extended targets of 54750, 54650, and 54550.
On the other side, if Bank Nifty reclaims and sustains above 55050–55100, fresh buying can be considered with potential upside toward 55250, 55350, and 55450+.


XAU/USD Bounces Off Strong Support Zone – Bullish MomentumGold (XAU/USD) has shown a strong bounce from the clearly defined support zone around the 3280–3290 level on the 1-hour timeframe. This zone has held multiple times in the past, confirming its significance. Additionally, the 200 EMA (red) is aligned with this horizontal support, creating a strong confluence area. Price action has respected this level, forming a bullish reversal candle setup, indicating potential for upside movement.
Based on this structure, a long (buy) trade can be considered around the 3300–3305 range, ideally after a bullish confirmation candle or price holding above the EMAs. This entry provides an opportunity to ride the next wave upward while maintaining a favorable risk-to-reward ratio.
The stop loss for this trade should be placed just below the support zone—around 3275 USD. Placing the stop slightly below this area protects against fakeouts while still maintaining good risk control. This is a logical level where the setup would be invalidated if breached.
For targets, the first potential resistance and partial profit booking zone is near 3335–3340 USD. This zone acted as resistance during previous price swings. If momentum sustains, the second target zone is around 3360–3370 USD, which marks a previous swing high and a likely destination for bullish continuation. For extended upside potential, traders can aim for 3385+ USD, especially if the price action is supported by volume and broader market sentiment.
This setup offers a clean technical play with a risk-reward ratio of approximately 1:2.5 or higher. Traders can also trail their stop-loss once the price crosses above the first target to protect gains while riding further upside.
=================================================================
Disclosure: I am part of Trade Nation's Influencer program and receive a monthly fee for using their TradingView charts in my analysis.

EURJPY still to expect bearish for new week
OANDA:EURJPY strong bearish bounce from top line of price action, currently price in rectangle and on bottom line of price action.
EUR with all showing self the weakest in last periods and expectations are still to see weaknes, here expecting break of rectangle and trend line of PA and higher bearish continuation till res zone.
SUP zone: 163.300
RES zone: 160.600

27.05.25 Morning ForecastPairs on Watch -
FOREXCOM:COFFEE
FX:GBPAUD
A short overview of the instruments I am looking at for today, multi-timeframe analysis down to what I will be looking at for an entry. Enjoy!

Gold Price Analysis May 26After a correction, the D candle on the following day confirmed a strong price increase towards ATH in the near future
The barrier to reach the all-time peak is not much and it is difficult to have a downtrend at the present time
The gold price increase in the early Asian session met with a price reaction at the Gap opening zone around 3356. With the candle's force, it is completely possible to push the price up to 3364 in the late Asian session or early European session. The nearest lower border is noted around the Asian session resistance zone this morning at 3335-3336. If 3364 does not break in the European session, it can give a pretty good SELL signal with a target of 333x and deeper at 321x. If it breaks 3264, it confirms a strong uptrend and only BUYs and does not look for a SELL point. The resistance until the target of 3405. 3191-3292 still plays a daily support role for any prolonged price decline of Gold

[INTRADAY] #BANKNIFTY PE & CE Levels(27/05/2025)Today, Bank Nifty is expected to open flat near the 55550 level. If it sustains above 55550, we may see further bullish momentum with upside targets of 55750, 55850, and 55950+. This breakout level may trigger strong buying interest.
On the downside, if Bank Nifty fails to hold above 55550 and drops below the 55460–55400 zone, then a bearish move may be seen toward 55250, 55150, and 55050 levels.
If it slips further below 55100, another buying opportunity may come near the 55050–55100 zone for a possible bounce targeting 55250, 55350, and 55450+.

#NIFTY Intraday Support and Resistance Levels - 27/05/2025Today, Nifty is expected to open flat near the 25000 level. If it sustains above 25000, we may see bullish momentum toward 25150, 25200, and 25250+. This level is a key breakout zone for further upside.
However, if Nifty fails to hold above 25000 and starts trading below the 24950–24900 zone, a short trade setup may trigger with downside targets of 24850, 24800, and 24750.
Further weakness will be confirmed only if Nifty breaks below 24750–24700, possibly extending the downside to 24600 and 24550.

Bitcoin - Approaching the all time high!Bitcoin - CRYPTO:BTCUSD - will break out again:
(click chart above to see the in depth analysis👆🏻)
It has been quite some time since we saw such a strong move on Bitcoin. But finally - not totally unexpected to be honest - Bitcoin is following its destiny and about to create another new all time high. Patience is key and strategy, risk and mindset will help you master the volatility.
Levels to watch: $100.000
Keep your long term vision!
Philip (BasicTrading)

26.05.25 Morning ForecastPairs on Watch -
FOREXCOM:COFFEE
FX:GBPAUD
FX:EURAUD
A short overview of the instruments I am looking at for today, multi-timeframe analysis down to what I will be looking at for an entry. Enjoy!

[INTRADAY] #BANKNIFTY PE & CE Levels(26/05/2025)Today, Bank Nifty is expected to open with a gap-up above the 55550 level. If it sustains above this zone, we may see a strong upside rally toward 55750, 55850, and 55950+. This level breakout can trigger bullish momentum for the session.
However, if Bank Nifty fails to hold above 55550 and slips below 55450–55400, then a short trade opportunity arises with downside targets at 55250, 55150, and 55050.
Further weakness can be expected only if Bank Nifty breaks below 54950, opening downside levels of 54750, 54650, and 54550.

BTC- New Impulse Soon You Can See read captionbitcoin (BTC) – Bullish Outlook
Price action breaking above key resistance, signaling potential trend continuation
Strong volume supports the move, confirming buyer strength
Higher highs and higher lows forming—classic bullish market structure
RSI and MACD both showing bullish divergence
Next target zone: TSXV:XX ,XXX – watch for consolidation or breakout
Overall sentiment shifting positive with macro tailwinds
